i tif c n e C i o c n S f l e a r n e o n i c t e
a 2
nr 0
et 1
1
n I
ISC 2011
Proceeding of the International Conference on Advanced Science,
Engineering and Information Technology 2011
Hotel Equatorial Bangi-Putrajaya, Malaysia, 14 - 15 January 2011
ISBN 978-983-42366-4-9
ISC 2011
International Conference on Advanced Science, Engineering and Information Technology ICASEIT 2011
Cutting Edge Sciences for Future Sustainability Hotel Equatorial Bangi-Putrajaya, Malaysia, 14 - 15 January 2011
SR
IE
AUNVI IT
NI
ESE
D K
O B
IN N
R AG
JA A L S A A E N P M N A A L U A T Y A S
S A I
REP
N I
NOI TAI COSSA STNEDUTS NA IENSOD
Organized by Indonesian Students Association Universiti Kebangsaan Malaysia Proceeding of the
Effects of Nonlinearities on Induced Voltages Across
Lumped Devices
Ziya Mazloom
Department of Science, Islamic Azad University, Mehriz branch Mehriz, 89818-56571, Iran
Tel.:+98 935 995 8222, E-mail: [email protected]
Abstract— There have been many studies on induced currents and voltages along overhead conductors due to lightning flashes. In
most of these studies lumped loads and components are connected only as line terminations [1]-[4]. In studies where series and shunt connected components are connected along the lines the effects of nonlinear components and effects are disregarded [5]-[8]. This is not always correct as nonlinear effects will introduce high frequencies in the system and affect the current and voltage wave distribution. In this paper the effects of series and shunt components and nonlinear phenomenon on a system representative of the Swedish electrified railway system will be investigated. It is seen how introduction of different linear and nonlinear components affect the propagating voltage wave forms.
Keywords— Power system lightning effects, crosstalk, power system simulation, transients.
I. INTRODUCTION
The lightning flash has been widely studied and the underlying physics are well known. Several methods have been developed on lightning field calculations [9]-[11] and field to wire coupling [1]-[4]. These studies are mainly on conventional power systems, or similar systems, where the lumped loads and components, such as transformers, switchgear, generators, etc., are connected as line terminations. In these works nonlinear effects, e.g. pole ground resistance, due to soil ionization [12], and pole to wire flashovers [13] have been disregarded.
In case of direct lightning strikes, i.e. if a lightning flash would physically hit a system or if a lightning would strike close to a multiconductor transmission line (MTL) system the voltages at the pole locations close to the lightning strike location will most likely increase beyond the flashover threshold of the pole to conductor insulator. This will result in a conductor to pole flashover.
Studies on lightning interaction with systems having components connected in series and as shunts along the MTL have been made in [5]-[8]. In these studies the system investigated was the Swedish electrified railway network. In these works it was seen how the introduction of series and shunt components and devices affect the current and voltage wave propagation.
II. A SWEDISH ELECTRIFIED RAILWAY NETWORK
To understand the voltage wave propagation along electrified networks, conductor layouts and components connected along the system has to be known.
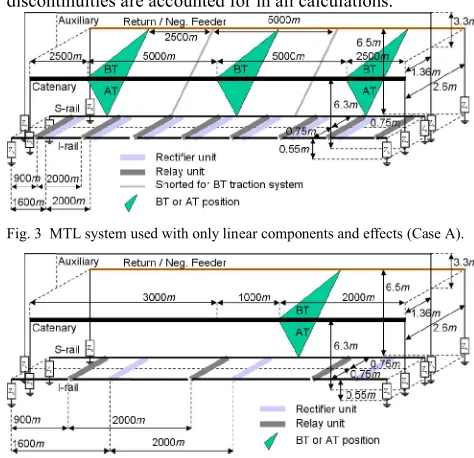
A typical single track Swedish electrified railway system consists of nine overhead conductors, S-rail, I-rail, catenary, two return conductors/negative feeders (noted as return conductors) and three auxiliary wires, with different radii and one buried communication cable. A cross sectional view of these conductors is shown in Fig. 1. The conductor radii and characteristic impedances of these conductors are presented in Table I. These conductors are connected to the poles by insulators as seen in Fig. 2. Due to different line operating voltages of the overhead conductors the insulator withstand voltages are different. The insulator type and voltage withstand levels are presented in Table II.
The poles are simulated to be connected to the finitely
conducting ground through a 50pole footing resistance. As
contrary to Case A, the nonlinear effects due to pole to wire flashovers are accounted for in Case B calculations.The series devices shown in Figs. 3 and 4 are typical devices connected along a typical single track Swedish electrified railway system. These devices consist mainly of track side transformers, namely booster (BT) and autotransformers (AT), and track circuits, consisting of rectifier and relay units. Refer to [14] for more information on the MTL systems, devices and the way these are connected along the networks.
Fig. 1 A cross sectional view of a typical single track electrified railway system showing nine overhead conductors and one buried cable.
TABLE I
CONDUCTOR RADII AND CHARACTERISTIC IMPEDANCES FOR LINE
TERMINATIONS IN FIG 3.
S-rail I-rail Catenary Return
conductor Auxiliary wire
Radii
(mm) 49.5 49.5 50.6 8.2 5.6
Zc
() 186 186 331 442 490
Fig. 2 Insulators, connections and pole footing resistance in a single track BT system (adopted from [13]).
TABLE II
INSULATOR MATERIAL AND WITHSTAND VOLTAGES.
Conductor Insulator type Withstand voltage (kV)
R3 (Catenary) Rod 225
R4 (Reinforcement) Line post 170
R5, R6 (Return) Spool 60
R7, R8, R9 (Auxiliary) Pin 140
There are two cases simulated for each of the systems presented in Figs. 3 and 4. The difference between the
calculations for a given MTL system is the track side transformer system used. The notation of the four cases simulated are presented in Table III. Track circuits and discontinuities are accounted for in all calculations.
Fig. 3 MTL system used with only linear components and effects (Case A).
Fig. 4 MTL system used including the nonlinear effects of pole to wire flashover (Case B).
TABLE III
NOTATIONS USED FOR THE CASES CALCULATED
MTL system of Fig. 3 MTL system of Fig.4
BT system Case A1 Case B1
AT system Case A2 Case B2
The electromagnetic interference source used in all calculations is representative of a subsequent lightning return stroke with the same base current parameters as presented in [15]. The peak amplitude of the lightning base current is kept as unity for the Cases A1 and A2 and about 12kA for Cases B1 and B2. The lightning is simulated to strike at a perpendicular distance of 50m away from the mid point of the system under study.
The lightning fields are calculated using the modified transmission line model with linear decay [4] with a return
stroke velocity of 1.3x10¹⁰m/s and the field to wire coupling
model adopted is the Agrawal et al. model [1]. The wave
propagation along the MTL system with series and shunt connected lumped devices is solved using a method developed by the author [5]-[8], [14], using the FTDT method [16]-[18] for solving the current and voltage propagation along the MTL system and a Kirchoff’s current and voltage laws [19]-[20] to account for the lumped series and shunt connected components.
III. INDUCED VOLTAGES
It is interesting to look at the voltages appearing across the devices as these will suffer the effects of induced voltages.
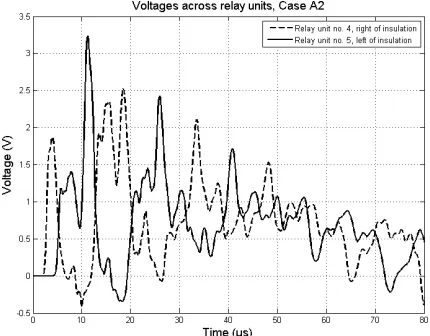
Case A2, the AT at the left end (LE) (Fig. 7) and the same relay units as for Case A1 (Fig. 8).
Fig. 5 Voltage waveforms across BT windings along return conductors (catenary voltage waveforms are similar hence not shown) for Case A1.
Fig. 6 Voltages appearing across relay units suffering the highest voltage peaks for Case A1.
Fig. 7 Voltage waveforms across AT windings along return conductors (catenary voltage waveforms are similar hence not shown) for Case A2.
Fig. 8 Voltages appearing across relay units suffering the highest voltage peaks for Case A2.
As figs. 5 (bottom window) and 7 are compared it is seen that the AT windings at the LE of the MTL system (Case A2) are suffering more than two times higher peak voltages as compared to BT at the RE of the MTL system (Case A1). In fig. 5 (top window) it is seen that the voltages appearing across the BT at the middle of the line, which is closest to the lightning strike location, is suffering voltages as high as the AT in Fig. 5. The oscillations at late times of Fig. 5 (top window) are most likely due to resonances in the winding LC elements.
From Figs. 6 and 8 it is clear that the voltages appearing across the track circuits suffering the highest voltage peaks are having similar wave shapes and peaks for Cases A1 and A2.
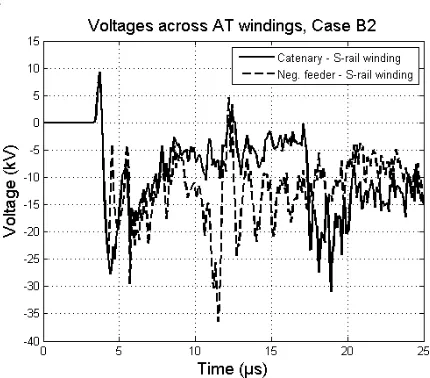
For Cases B1 and B2 the voltages across transformer windings (Figs. 9 and 12) and the voltages across all relay units (Figs. 10-11 and 13-14) are studied.
As Figs. 9 and 12 are compared it is seen that the peak induced voltages across the AT windings are more than twice as high as compared to voltages across BT windings. Both of these wave shapes are showing oscillatory behaviour.
Fig. 10 Voltages appearing across relay units closer to the middle of the line for Case B1.
Fig. 11 Voltages appearing across relay units closer to the line ends for Case B1.
Fig. 12 Voltage waveforms across AT windings for Case B2.
Fig. 13 Voltages appearing across relay units closer to the middle of the line for Case B2.
Fig. 14 Voltages appearing across relay units closer to the line ends for Case B2.
The voltage wave shapes at the middle of the line, Figs. 10 and 13, are dominated by the pole to wire flashover phenomenon. These wave shapes show very high oscillations and peak voltages and seems to be indifferent to the track side transformer system. It was seen in the simulations that the pole to wire flashovers occur up to 300m away from the middle of the line. This is the reason why oscillations are seen across the components at the middle of the line and not across the components at other positions, e.g. the relay units closer to the line ends, Figs. 11 and 14. The main difference between the voltage wave shapes across the relay units closer to the line ends is seen across relay unit no. 5. This is most likely due to the presence of a transformer winding between the catenary wire and the S-rail in Case B2.
As results from Case A and B are to be compared attention has to be given to the time span of the figures. As the peak voltages from Case A and B are to be compared the difference in lightning channel base current has to be kept in mind as the induced voltage will increase proportionally.
The highest peak voltages seen across the transformer windings for Cases A1 and A2 are much lower as compared to the peak voltages seen in Cases B1 and B2.
The peak voltages across the relay units in Cases B1 and B2 (closer to the line ends) are generally similar to the peak voltages across relay units suffering the highest voltage peaks in Cases A1 and A2. This with the exception of relay unit no. 5 in Case B2 which is suffering a peak about two times higher than the peak voltages of the other cases.
IV. CONCLUSIONS
In this paper it is seen how the induced voltages wave shapes and peaks across different systems vary as the track side transformers are changed from BT to AT systems. Also, the effects of pole to wire flashover on the induced voltages across series and shunt connected devices along MTL systems, representative of typical Swedish single track electric railway system, is presented.
It is seen that the voltage appearing across the track side transformer windings is change based on the type of transformer system used, i.e. BT or AT system. Whereas the voltage appearing across the relay units (connected between the rails) are relatively insensitive to changes in the track side transformer system.
The nonlinear effect of pole to wire flashover results not only in much more oscillatory behavior of the voltage wave shapes, it also results in higher voltage peaks across the track side transformer windings.
In this work is has been shown that the presence of different components do largely affect the voltage, and accordingly current, wave shapes and peaks. It is also clear that nonlinear effects introduce oscillations and change the peak current and voltage values, due to alteration in current distribution.
NOMENCLATURE
Zc characteristic impedance
REFERENCES
[1] A. K. Agrawal, H. J. Price and S. Gurbaxani, “Transient response of a multiconductor transmission line excited by a nonuniform electromagnetic field”, IEEE Transactions on Electromagnetic Compatibility, Vol. 22, No. 2, pp. 119-129, 1980.
[2] C. D. Taylor, R. S. Satterwhite and C. W. Harrison, “The response of a terminated two-wire transmission line excited by a nonuniform electromagnetic field”, IEEE Transactions on Antennas and Propagation, Vol. 13, No. 6, pp. 987-989, 1965.
[3] F. Rachidi, “Formulation of the field-to-transmission line coupling equations in terms of magnetic excitation field”, IEEE Transactions on Electromagnetic Compatibility, Vol. 35, No. 3, pp. 404-407, 1993. [4] V. Rakov and A. A. Dulzon, “Calculated electromagnetic fields of
lightning return strokes”, Tekhnicheskaya Elektrodinamika, No. 1, pp. 87-89, 1987.
[5] Z. Mazloom, N. Theethayi and R. Thottappillil, “Influence of discrete series devices on crosstalk phenomena in multiconductor transmission lines“, Proceedings of the 18th International Zurich Symposium on Electromagnetic Compatibility, Munich, Germany, 2007.
[6] Z. Mazloom, N. Theethayi and R. Thottappillil, “Modeling of passive series devices on multiconductor transmission lines for transient analysis in power and railway systems”, Proceeding of the EuroEM 2008, Switzerland, 2008.
[7] Z. Mazloom, N. Theethayi, R. Thottappillil, “Method to include lumped devices in multi-conductor transmission line system models”,
Proceedings of the IEEE Power Engineering Society General Meeting 2009, Calgary, Canada, 2009.
[8] Z. Mazloom, N. Theethayi and R. Thottappillil, “A method for interfacing lumped-circuit models and transmission-line system models with application to railways”, IEEE Transactions on Electromagnetic Compatibility, Vol. 51, No. 3, pp. 833-841, 2009.
[9] M. Paolone, F. Rachidi, A. Borghetti, C. A. Nucci, M. Rubinstein, V. A. Rakov and M.A. Uman, “Lightning electromagnetic field coupling to overhead lines: Theory, numerical simulations, and experimental validation”, IEEE Transactions on Electromagnetic Compatibility, Vol. 51, No. 3, 2009.
[10] F. Rachidi and C. A. Nucci, “On the Master, Uman, Lin, Standler and the modified transmission line lightning return stroke current models”,
Journal of Geophysical Research, Vol. 95, No. D12, pp. 20389-20394, 1990.
[11] M. A. Uman and D. K. McLain, “Magnetic field of the lightning return stroke”, Journal of Geophysical Research, Vol. 74, No. 28, pp. 6899-6910, 1969.
[12] Technical Council of the IEEE Power Engineering Society, IEEE Guide for the Application of Insulation Coordination, IEEE Standard 1313.2, 1999.
[13] N. Theethayi, Y. Liu, R. Montano, R. Thottappillil, M. Zitnik, V. Cooray, and V. Scuka, “Theoretical study on the consequence of a direct lightning strike to electrified railway system in Sweden”, Journal Electrical Power System Research, vol. 74, pp. 267–280, 2005. [14] Z. Mazloom, “Multi-conductor transmission line model for electrified
railways: A method for including responses of lumped devices”, Ph.D. Thesis, ISBN 978-91-7415-557-0, Royal Institute of Technology (KTH), 2010.
[15] C. A. Nucci, F. Rachidi, M. Ianoz, and C. Mazzetti, “Lightning-induced voltages on overhead lines,” IEEE Transaction on Electromagnetic Compatibility, vol. 35, no. 1, pp. 75–86, Feb. 1993.
[16] C. R. Paul, Analysis of Multiconductor Transmission Lines, John Wiley and Sons Incorporation, 1994.
[17] F. Rachidi and S. Tkachenko (editors), Electromagnetic Field Interaction with Transmission Lines From Classical Theory to HF Radiation Effect, WIT Press, UK, 2008.
[18] F. M. Tesche, M. V. Ianoz and T. Karlsson, EMC Analysis Methods and Computational Models, John Wiley and Sons Incorporation, 1997. [19] L. S. Bobrow, Elementary linear circuits analysis, Oxford University
Press, Oxford University Press Incorporation, 1987.