A b s t r a c t. Development of a low-cost computer-based system for multi-point measurement of velocity and temperature has been completed. The principle is based on hot-wire anemometry. A typical probe consists of a cold thermistor for flow temperature detection and a hot thermistor for flow velocity detection. The later is self-heated by a thermal potentiometer circuit. The change in resistance of the thermistor is related to the airflow. The designed probes were calibrated with reference to known parameters. The system developed can monitor and analyze 48 velocities and temperature sets in a ventilated space. System development and results are presented.
K e y w o r d s: velocity, temperature, ventilation, probe, thermistor
INTRODUCTION
Thermistors have found widespread application in measurements of temperature and especially fluid flow. For measuring the fluid flow as a flowmeter, a thermoresistive device is electrically heated to a temperature (T) higher than that of the surrounding medium (Ta) and then placed in the flow stream which draws from the device an amount of heat proportional to the flow. The change in resistance of the thermoresistive device is directly related to the airflow which in turn is directly related to the resulting temperature of thermistor. Self-heated thermistors have been used by previous researchers for fluid flow measurements. Okamoto et al.(1993) developed a digital anemometer consisting of a cold thermistor for flow temperature and a hot thermistor for flow velocity detection. The latter is self - heated by a thermal bridge. They found a linear digital output by comparing the voltage across the self-heated thermistor with the characteristic waveform generated by direct digital synthesizing. Oliveriraet al.(1995) developed an experi-mental prototype of an anemometer with a pulse width
modulated (PWM) excitation voltage. They used a ther-mistor placed in one arm of a Wheatstone bridge as a flow detection sensor heated by a PWM voltage. A negative feed-back circuit substituted the thermal power absorbed by the fluid from the heated sensor maintaining it at a constant temperature. The pulse width contained information about the fluid velocity and, using a timer counter, the velocity information was found in digital form without use of a con-ventional A/D converter. No report on the performance of their system was provided.
A multi-point temperature and velocity measurement system was developed by Zhanget al.(1996) for studying air flow patterns and temperature distribution in ventilated spaces. Their system measured up to 32 points using thermistors as measuring elements. The system consisted of multi-head temperature and velocity sensors, on-line data analysis, graphical presentation of temperatures and velocities, and the option of data logging. A relative error of less than 3% for velocity was reported and temperature measurements were reported as accurate to within 0.05°C in the range of 0-45°C. The system developed with this research used the procedures successfully demonstrated by the work of Zhanget al.(1994).
SYSTEM DESIGN AND INSTRUMENTATION Probe assembly
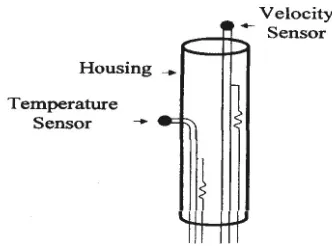
The configuration of one typical temperature and velocity probe is illustrated in Fig. 1. It is constructed with two matched thermistors, two military grade resistors, and necessary wiring. For temperature sensing, a 10 K ohms resistor was connected in series with one thermistor to form a potentiometer circuit with 0.5 volt as the power supply. For
Development of multiple velocity and temperature probe sets for ventilated spaces
R. Alimardani
1* and S.J. Hoff
21Agricultural Engineering Dept., Faculty of Agriculture, Tehran University, Karaj, Iran 2
Agricultural & Biosystem Engineering Dept., Iowa State University, Ames, IA 50010, USA
Received June 7, 2004; accepted December 1, 2004
© 2005 Institute of Agrophysics, Polish Academy of Sciences *Corresponding author’s e-mail: [email protected]
A
A
Agggrrroooppphhyhyysssiiicccsss
w w
velocity sensing, a 392 ohms resistor and a second thermistor with a 12 volt power supply were connected in series. A flexible plastic tube (7 mm diameter and 15 cm long) was used for the housing of probes. All wires were passed through the tubing with the velocity thermistor at the top of the housing and the temperature thermistor located to the side with the head outside and 25 mm below the velocity thermistor. In this configuration, both sensor heads were exposed to open air space during measurement.
Hardware
The data acquisition system consisted of a CR-10 data logger, three AM416 multiplexers (both from Campbell Scientific Inc.; Logan, Utah), a 12V constant voltage power supply (SOLA Model 83-12-218-03, Newark Electronic Inc.), and a built-in PC-Board with 16 - 4 position DIP switches. The CR-10 was linked to a microcomputer via a 9-pin serial data interface for communication. The AM416 multiplexer had 16 sets of differential channels in which each set was used for one probe. A total of 48 probes were constructed and connected in a batch of 16 to each multiplexer.
Software
The system software is supported by a program written using the PC208E software package (Campbell Scientific Inc, Logan, Utah). Language of the program is in CSI format. The software has the ability of scanning all three multiplexers at a frequency of 10 scans s-1. The data are sampled, averaged, and stored in CR-10 final storage location and then downloaded to the computer in the form of text for further analysis.
Methodology
When a thermistor is placed in a potentiometer circuit with a known input voltage (Vs) and circuit resistance (Ro), the output voltage of thermistor (Vt) can be measured. From
the following equation, the resistance of the thermistor (Rt)
in the circuit is determined:
R R V
V V
t o t
s t
=
- . (1)
The corresponding temperature of the thermistor can be determined by use of the Resistance - Temperature (R-T) curve that is based on the calibration of an individual thermistor. The R-T data supplied from the thermistor manufacturer (RTI Electronics Inc.; Anaheim, CA) were Least-Squares fit to the Steinhart-Hart equation which is written explicitly inT as Eq. (2):
1/T=C0+C1(lnRt)+C2(lnRt)3 (2) where: C0, C1 and C2 were determined by regression method. The thermistors selected for this application are an NTC type ACCU-CURVE series ACC-001 with 2252 Ohms @ 25°C. The ACC-001 spherical thermistor has a dia-meter of 1.5 mm with a dissipation and thermal time constant of 1mW °C-1and 10 s, respectively. TypicalR-T characteristics of the thermistors are shown in Fig. 2. The result of regression analysis with Eq. (2) showed an R2of 0.9999 and standard error ofTof 0.07512°C.
Theory of operation
Rusmussen (1961) developed the basic theory for the behavior of thermistors in a moving fluid. If a thermistor is heated above the ambient temperature due to electrical energy input, an energy balance on the thermistor yields as follows:
CdT
dt P K T T
v
v a
= - ( - ) (3)
where:Cis the heat capacity (J kg-1°C-1),Tvis the tempe-rature (°C),Pis the supplied energy to the thermisor (mW), andKis the dissipation factor of the thermistor (mW °C-1), Tais the surrounding fluid temperature (°C) and t is time (s).
Fig. 1.Schematic of a typical temperature/velocity probe.
Fig. 2.Typical Resistance – Temperature curve for thermistor.
Temperature
(°C)
Resistance (ohm)
Taroni and Zanarini (1975) have studied the response of thermistors in detail. In a steady state condition, Eq. (3) reduces to:
P=K T( v-Ta). (4)
The dissipation factor,K, of a given thermistor depends on the relative speed and properties of the fluid, and also the orientation of the thermistor relative to the air flow. Now, for a fixed orientation and with the range of ambient temperature fluctuation limited to that for which the variation in fluid properties is negligible,Kis only a function of fluid speed. Therefore, the thermistor can be calibrated as a flowmeter by experimentally determining the relationship between dissipation factor, power input, and the temperature difference (Tv- Ta). So, Eq. (4) can be re-written as:
I R2 v=Ah T( v-Ta) (5) where:Rv,A, andIare resistance, surface area, and current passing through the thermistor respectively. The convection heat transfer coefficient,h, is related to the thermodynamic properties of the fluid, typically presented as the Nusselt number (hd/k) (where: h is heat transfer coefficient, d is diameter, andkis thermal conductivity). The relationship between Nusselt number and other thermodynamic fluid properties and characteristics of the flow around the thermistor have been studied by Olivari and Carbonaro (1993). Typically, by dimensional analysis one must have:
Nu=f(Re, Pr). (6)
The general form of non-dimensional heat transfer relationship, at fixedPrandtlnumber is:
Nu=a + b Ren. (7)
Now, replacingNuin Eq. (5) by (7) and noting thatReis a function ofV, the Eq. (5) can be re-written as:
I2Rv=(a + b Vn) (Tv– Ta). (8)
In the above equation, a represents the natural convection term and b Vnthe force convection term. After rearranging, Eq. (8) can be written as:
V A B I R
T T
n v
v a
= + -2
( ). (9)
This is the basis for the system presented in this paper. IandRvmay be determined by Eq. (1),TvandTaare known by Eq. (2), A and B are the intercept and slope of the regression equation and their values are determined in the calibration procedure for each thermistor.
Calibration of probes
Calibration experiments were performed for each set of temperature-velocity probe at the Air Dispersion Labora-tory in the Agricultural and Biosystem Engineering
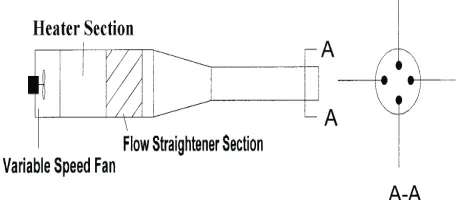
De-partment at Iowa State University to determine all requied calibration coefficients. For temperature calibration, a Copper-Constantan thermocouple sensor was employed as refe-rence. An Omni-directional anomometer (Model 8470, TSI Inc.) was used for velocity calibration. The temperature and velocity thermistors were calibrated simultaneously in a ple-num chamber constructed for this purpose. The experimental plenum chamber (Fig. 3) consisted of three sections including: (1) a rectangular sheet metal cross section of 30x50 and 40 cm long; (2) a pyramidal sheet metal section at 50 cm in length with 30x50 cm at one end and converged to 15 cm in diameter at the other end; and (3) a PVC duct with 15 cm in diameter and the length of 60 cm. On the pyramidal section, sheet metal work was done to converge from rectangular to circular cross section. The plenum was equipped with a 20 cm diameter axial fan wired in a circuit with a variable speed controller. Two air straighteners were mounted inside the rectangular cross section to reduce the air swirling at the outlet. The temperature inside the plenum was controlled by two spring type heaters installed between the fan and the air straighteners. One of the heaters was wired to a variac for temperature variation control.
The probes for calibration (10 per batch) were mounted uniformly and radially along the duct circle at 5 cm to the outlet end of the plenum with the probe heads toward the center of duct section. The calibration was carried out for temperature in the range of 20-45°C in steps of 2°C. The velocity at each temperature setting varied from 0 to 5 m s-1 in steps of 0.3 for 0 to 2 and 0.5 for 2 to 5 m s-1 under isothermal conditions. The values of A and B for each thermistor were obtained through the regression analysis.
RESULTS AND DISCUSSIONS
For each experiment conducted during the calibration procedure, data scanning started after 15 min so that a steady state condition was achieved. The true velocity and temperature along with the output voltages for each batch of 10 probes were recorded with a scan rate of 2 s and averaged over a period of 3 min. Equation (1) was used to convert the output voltages of each thermistor to resistance and then, using the R-T Eq. (2), the temperatures of both thermistor
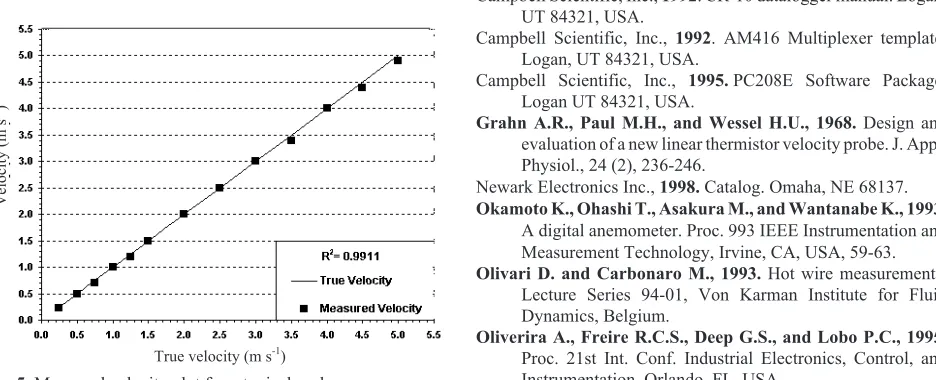
heads were determined. Regression analysis for each temperature thermistor was carried out by regressing the measured temperature over the true temperature as shown in Fig. 4. An R2ranging from 0.9957 to 0.9987 with standard errors of 0.3192 to 0.4847°C and the variance ranging from 0.59 to 1.3°C were found. Equation (9) was used for calculation of measured velocities based on the temperature and output voltages of the velocity thermistor. A compa-rable optimum n-value of 0.485 was used in Eq. (9) for all the velocity thermistors through their entire range. The values forAandBwere found for each probe from analysis of data and used in Eq. (9). The regression analysis for the relationship betweenV and other obtained parameters in Eq. (9) showed good agreement with R2 ranging from 0.9750 to 0.9946 with standard errors ranging from 0.0451 to 0.0164 m s-1, respectively. The measured and true velocities for a typical probe are shown in Fig. 5. It is noted that the line drawn through data in Figs 4 and 5 is more likely a 1:1 line for the base of comparison. Figure 6 is a presentation of standard error for a typical probe showing that. as the velocity increases, the error in measurement decreases.
CONCLUSIONS
1. For the measurement system developed, 96 thermistors were used as the measuring elements. The system can handle measurements of velocity and temperature for 48 locations.
2. The accuracy of temperature over the range of 20 to 45°C was better than 0.048°C. For the velocity at low temperature, an accuracy of better than 0.24 m s-1 was obtained. This range of flow velocity would cover the velocity of airflow in ventilated spaces. At higher tempera-ture, the system performed better with an increase in accuracy to 0.11 m s-1.
3. The system can be operated on a microcomputer and present on-line monitoring and graphs for airflow pattern, temperature distribution, and air flow velocity studies in greenhouses, nursery buildings and basic ventilation systems.
4. A good application of the system developed is for controlling the temperature and velocity in automated greenhouse systems due to its high performance/cost ratio.
REFERENCES
Campbell Scientific, Inc.,1992. CR-10 datalogger manual. Logan, UT 84321, USA.
Campbell Scientific, Inc., 1992. AM416 Multiplexer template. Logan, UT 84321, USA.
Campbell Scientific, Inc., 1995.PC208E Software Package. Logan UT 84321, USA.
Grahn A.R., Paul M.H., and Wessel H.U., 1968. Design and
evaluation of a new linear thermistor velocity probe. J. Appl. Physiol., 24 (2), 236-246.
Newark Electronics Inc.,1998.Catalog. Omaha, NE 68137.
Okamoto K., Ohashi T., Asakura M., and Wantanabe K., 1993.
A digital anemometer. Proc. 993 IEEE Instrumentation and Measurement Technology, Irvine, CA, USA, 59-63.
Olivari D. and Carbonaro M., 1993.Hot wire measurements.
Lecture Series 94-01, Von Karman Institute for Fluid Dynamics, Belgium.
Oliverira A., Freire R.C.S., Deep G.S., and Lobo P.C., 1995.
Proc. 21st Int. Conf. Industrial Electronics, Control, and Instrumentation. Orlando, FL, USA.
Fig. 5.Measured velocity plot for a typical probe.
Fig. 4.Measured temperature plot for a typical probe.
Temperature
(°C)
True temperature (°C)
True velocity (m s-1)
Velocity
(m
s
-1 )
Fig. 6.Standard error for a typical probe.
True velocity (m s-1)
Velocity
(m
s
Rusmussen R.A., 1961.Application of thermistors to measure-ments in moving fluids. The Review of Scientific Instruments, 33 (1) 38-42.
RTI Electronic Inc., 1998. Thermistor Catalog. Anaheim, CA 92806-2509.
Taroni A. and Zanarini G., 1975.Dynamic behavior of themistor
flow meters. IEEE Trans. Industrial Electronics, Control, and Instrumentation. V22, 391-396.
TSI Inc.,1988.Air Velocity Transducer Operation and Service Manual. St. Paul, MN, USA.
Zhang G. and Morsing S., 1994.Multi-head thermistor
anemo-meter. Department Research Notes. 1095-2. National Institute of Agricultural Engineering, Bygholm, Denmark.
Zhang G., Morsing S., and Strom J.S., 1996.A computerized