www.nat-hazards-earth-syst-sci.net/11/3335/2011/ doi:10.5194/nhess-11-3335-2011
© Author(s) 2011. CC Attribution 3.0 License.
and Earth
System Sciences
Drought-induced building damages from simulations at
regional scale
T. Corti1,*, M. W ¨uest2, D. Bresch2, and S. I. Seneviratne1
1Institute for Atmospheric and Climate Science, ETH Zurich, Zurich, Switzerland 2Swiss Reinsurance Company, Zurich, Switzerland
*now at: Center for Climate Systems Modeling, ETH Zurich, Zurich, Switzerland
Received: 24 December 2010 – Revised: 22 July 2011 – Accepted: 24 October 2011 – Published: 19 December 2011
Abstract. We present a model computing damage costs
from drought-induced soil subsidence related to shrinking and swelling soils. The model uses an indicator applica-ble across different climate regimes. The influence of ge-ology and land use on regional damage levels is taken into account. Simulation results are evaluated at departmental scale, showing a good representation of the regions affected by drought-induced soil subsidence. Substantial differences between simulated and observed damages are however found in some departments.
1 Introduction
Certain soils shrink and swell in response to dry and wet con-ditions, inducing vertical soil movements, known as drought-induced soil subsidence of expansive or shrinking soils (Corti et al., 2009). These soil movements can cause important damage to buildings and other infrastructure. In this study, we will refer to this phenomenon as “drought-induced soil subsidence”.
It is important to note that there are various other causes for soil subsidence not related to shrinking and swelling of soils, which also have a large potential for economic dam-ages (Cabral-Cano et al., 2008). These causes include land slides, depressions over underground cavities (Doornkamp, 1993) or the excess withdrawal of groundwater or other flu-ids (Basagaoglu et al., 1999; Stramondo et al., 2007). Here, we do not consider these other types of soil subsidence.
In France, the phenomenon of drought-induced soil subsi-dence has first been reported after the 1976 drought, when severe building structure failures occurred. In 1989, tens of thousands of buildings were affected (Salagnac, 2007). As a consequence, drought-induced soil subsidence has
Correspondence to: T. Corti ([email protected])
been integrated in the natural catastrophes insurance system (Cat-Nat). Since then, this phenomenon has caused as much damage in France as floods (CCR, 2007).
So far, damage costs from drought-induced soil subsi-dence have not attracted much attention in the natural haz-ard and climate research communities. Most previous stud-ies on the subject are concerned with damage data analy-sis, geological or constructional aspects (Plante, 1998; Webb, 1999; Doornkamp, 1993; Crilly, 2001; Fityus et al., 2004, e.g.). These studies have shown variations in the sensitivity of building infrastructure to drought-induced soil subsidence. In particular, the fraction and size of vulnerable structures de-pends on the properties of the underground (Popescu et al., 1998), the presence of trees (Richards et al., 1983; Navarro et al., 2009) and the type of buildings (Crilly, 2001).
In a recent study, Corti et al. (2009) presented a meteorologically-based model system (hereafter named C09 model) to simulate damages from drought-induced soil sub-sidence. The simulation results showed that the model is capable of reproducing observed annual drought-induced building damages in France. This indicates that meteorology is the principal driver determining the interannual variability of damages from drought-induced soil subsidence in France on a national level. However, this first model has several lim-itations. It uses a damage indicator that is only applicable in regions where the soils are swollen at least once a year. This means that the model cannot be used in predominantly dry climates. Moreover, regional differences in geological prop-erties and land use are not considered. Finally, the model was only evaluated at the national level (aggregated estimates).
2 Data
2.1 Meteorological data
We use monthly mean temperature and precipitation obser-vations from two gridded data sets: CRU TS 2.1 (Mitchell and Jones, 2005) and E-OBS (Haylock et al., 2008), provid-ing two descriptions of the meteorological situation for the past decades. The meteorological data was interpolated to a regular grid with 0.05 degrees resolution.
2.2 Susceptibility
As mentioned above, not all buildings are affected equally by drought-induced soil subsidence. Among other factors, the fraction and size of vulnerable structures depends on the geological properties of the underground, building types and the structure of the surrounding area. Based on data concern-ing geology and land cover, we have constructed a dataset quantifying the susceptibility to drought-induced soil subsi-dence in France.
2.2.1 Geological data
The Bureau de Recherches G´eologiques et Mini`eres (BRGM) assessed the subsidence risk arising from geolog-ical conditions for three quarters of metropolitain France, classifying the regions in four categories with no, low, medium or high risk for drought-induced soil subsidence. In addition, BRGM assessed the exact location of numer-ous damaged properties, revealing that the relative number of damaged buildings for the four categories amounts to 0.02, 0.14, 0.40 and 1.00, respectively. These numbers are scaled arbitrarily, since the total number of considered buildings is not evident from the investigations by BRGM. For the present study, We have performed a correlation analysis of the data provided by BRGM with information on the par-ent soil material from the European soil database (ESDB) (JRC, 2009), and found a correlation coefficient of 0.83 (not shown). Based on this correlation, we have extrapolated the geological information to entire metropolitan France. We then quantified the relative damage risk for the different cat-egories based on the damage locations reported by BRGM mentioned above.
2.2.2 Land use data
We use the CORINE Land Cover 2000 (CLC) dataset (CEC-EEA, 1993; (CEC-EEA, 2007), produced by photo-interpretation of satellite images, to characterize the land use of the French domain. This information is used to reflect the influence of building types and the presence of vegetation close to build-ings on the susceptibility to drought-induced soil subsidence across the urban and rural areas.
First, we aggregated the 44 land cover classes into three categories: urban center, urban discontinuous, and rural –
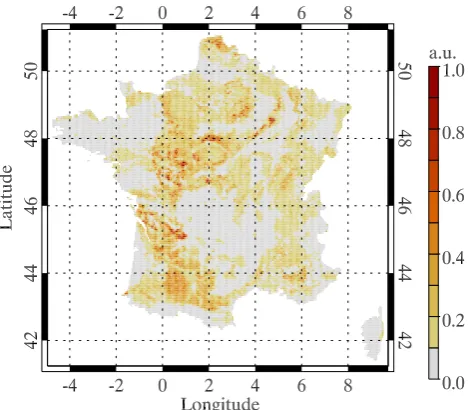
Fig. 1. Susceptibility to drought-induced soil subsidence from geology and land cover in arbitrary units (a.u.).
2.2.3 Combined susceptibility
We combined the geological and land cover information by multiplying the respective
susceptibili-ties. The resulting map is shown in Figure 1. The susceptibility can be seen as the relative number
of buildings susceptible to drought-induced soil subsidence, i.e., the relative number of buildings
90
damaged in case of a drought event.
2.2.4 Population density
Population density data was obtained from the European Environment Agency Data Service (EEA,
2009) and interpolated to derive the number of inhabitants at 0.05 degrees spatial resolution.
2.3 Damage data 95
We use two types of damage data for drought-induced soil subsidence: estimates for damage costs
on the national level (Section 2.3.1), and on the departmental level (Section 2.3.2). Both types of
data represent compensations granted for damages registered in connection with an interministerial
decree, declaring a state of natural disaster due to drought-induced soil subsidence. This implies that
4
Fig. 1. Susceptibility to drought-induced soil subsidence from ge-ology and land cover in arbitrary units (a.u.).
selected based on the CLC class descriptions. The urban center category contains one CLC class only: the continous urban fabric. The urban discontinuous category consists of 6 classes: the discontinous urban fabric class, all industrial, commercial and transport units (4 classes); and all artificial, non-agricultural vegetated areas (2 classes). All other CLC classes are subsumed in the rural category.
For each of the 95 French departments, we then com-puted the fraction of population living in areas belonging to the three categories. To determine the relative suscepti-bility of the categories to drought-induced soil subsidence, we then performed a multivariate linear regression compar-ing the land use fractions to the mean damage levels (cost per capita) reported in the departments. The result showed that the urban centers are insusceptible (susceptibility of 0.0) to drought-induced soil subsidence and that discontinuous ur-ban areas (0.50) are half as susceptible as rural areas (1.00).
2.2.3 Combined susceptibility
We combined the geological and land cover information by multiplying the respective susceptibilities. The resulting map is shown in Fig. 1. The susceptibility can be seen as the rela-tive number of buildings susceptible to drought-induced soil subsidence, i.e. the relative number of buildings damaged in case of a drought event.
2.2.4 Population density
Population density data was obtained from the European En-vironment Agency Data Service (EEA, 2009) and interpo-lated to derive the number of inhabitants at 0.05 degrees spa-tial resolution.
2.3 Damage data
We use two types of damage data for drought-induced soil subsidence: estimates for damage costs on the national level (Sect. 2.3.1), and on the departmental level (Sect. 2.3.2). Both types of data represent compensations granted for dam-ages registered in connection with an interministerial decree, declaring a state of natural disaster due to drought-induced soil subsidence. This implies that damages are usually in-spected and reported directly after a drought event and can thus be attributed to it. There is thus a high plausibility that the damage was indeed caused by the drought event and does not stem from other causes. However, this procedure also implies that the reported damage might contain an admin-istrative or political component, which does not necessarily reflect the real magnitude of an event. In addition, the lack of an interministerial decree for a drought event might lead to the accumulation of damages and to anomalously high dam-age costs registered at a later event.
2.3.1 National estimates
Dumas et al. (2005) provide estimates of drought-induced soil subsidence damages in France covering the time pe-riod 1989 to 2002 from two sources: the Caisse Cen-trale de R´eassurance (CCR) and the F´ed´eration Franc¸aise des Soci´et´es d’Assurance (FFSA). Mean values of the two datasets are used here. In addition, the data is inflation-adjusted to the year 2000 based on the growth in Gross Do-mestic Product and Consumer Price Index, accounting for the increasing number of buildings and their value, respec-tively. The uncertainty was determined as twice the mean difference between the two data sets and at most 30 % of the reported value of one year. For the year 2003, a prelimi-nary estimate of damage costs was reported by CCR (2007), amounting to 1060 million Euros adjusted to the year 2000. We use this data to derive vulnerability and soil shrinkage curves (cp. Sect. 3.3) and to evaluate the damage simulations on a national level.
2.3.2 Departmental estimates
Insured value and loss data with departmental resolution cov-ering the years 1995 to 2003 was collected from several in-surers by the Swiss Reinsurance Company and provided in an anonymized manner. We use this data to evaluate the sim-ulated temporal mean damage on a departmental scale.
For most years, data from four insurers are available. The data is adjusted to the year 2000 based on the growth of Gross Domestic Product (GDP) and Consumer Price Index (CPI), in order to account for the increasing number of buildings and their value, respectively. Upscaling to the whole French market shows good agreement with the damage data on the national level provided by Dumas et al. (2005).
On a departmental level, the estimated annual damage re-ports differ widely from insurer to insurer, limiting the pos-sibilities for quantitative analysis. Averaged over the years 1995 to 2002, the differences between estimates from indi-vidual insurers amount to a factor of two on average. Since we have data available from four insurers, this implies a typ-ical uncertainty of 50 % for the mean departemental damage costs. For the year 2003, the differences are substantially higher, resulting in an uncertainty of a factor of three. In addition, certain insurers report no damages in some depart-ments where other insurers report substantial damage costs, suggesting that the damage reports for 2003 are incomplete.
Using data from the individual insurers, upscaling of the whole French market results in damage cost estimates for 2003 ranging from 560 to 1630 million Euros. The lower values might be the result of incomplete reporting. This is, however, purely speculative at the moment. Totalization of the damage costs from the different insurers at departemen-tal level and subsequent upscaling yields a best estimate of national damage costs of 890 million Euro, 17 % below the value reported by CCR (2007).
3 Model
3.1 Overview
We simulate building damages from drought-induced soil subsidence with an updated simulation framework based on the C09 model. We have updated the model by including in-formation about the regional differences in susceptibility to drought-induced soil subsidence (see Sect. 2.2) and introduc-ing a new indicator for drought-induced soil subsidence.
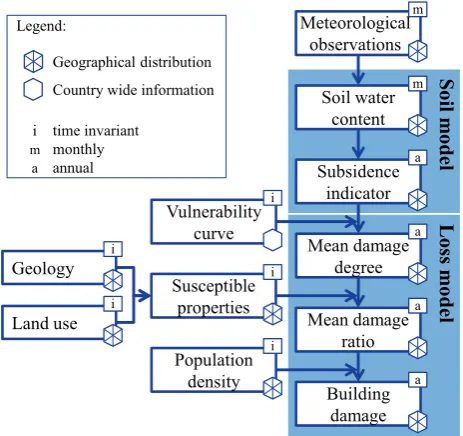
Figure 2 outlines the model for simulating damages from drought-induced soil subsidence. As in the C09 model, me-teorological data is used as input to a two-layer soil model based on the water balance procedure underlying the Palmer Drought Severity Index (PDSI) (Palmer, 1965; Weber and Nkemdirim, 1998), resulting in monthly estimates of soil moisture content. Also as in C09, we use a constant wa-ter holding capacityWCof 500 mm, relating the soil mois-ture contentSto the relative soil moisture saturationθin the equation
S=WCθ. (1)
From the monthly soil water content time series, the in-dicator for drought-induced soil subsidence is derived on an annual basis. The indicator is either the annual soil mois-ture deficit, as in the model (see Sect. 3.2.1), or the explicit indicator for drought-induced soil subsidence (Sect. 3.2.2).
L o s s m o d e l S o il m o d e l Vulnerability curve Meteorological observations Soil water content Subsidence indicator Mean damage degree Mean damage ratio Building damage Susceptible properties Population density Geology Land use Legend: Geographical distribution Country wide information
i time invariant
m monthly a annual m m a a a a i i i i i
Fig. 2. Model outline for simulating damage from drought-induced soil subsidence.
Using data from the individual insurers, upscaling of the whole French market results in damage 135
cost estimates for 2003 ranging from 560 to 1630 Million Euros. The lower values might be the result of incomplete reporting. This is however purely speculative at the moment. Totalization of the damage costs from the different insurers at departemental level and subsequent upscaling yields a best estimate of national damage costs of 890 Million Euro, 17 % below the value reported by CCR (2007).
140
3 Model
3.1 Overview
We simulate building damages from drought-induced soil subsidence with an updated simulation framework based on the C09 model. We have updated the model by including information about the regional differences in susceptibility to drought-induced soil subsidence (see Section 2.2), and 145
introducing a new indicator for drought-induced soil subsidence.
Figure 2 outlines the model for simulating damages from drought-induced soil subsidence. As in the C09 model, meteorological data is used as input to a two-layer soil model based on the water balance procedure underlying the Palmer Drought Severity Index (PDSI) (Palmer, 1965; Weber and Nkemdirim, 1998), resulting in monthly estimates of soil moisture content. Also as in C09, we use 150
a constant water holding capacityWCof 500 mm, relating the soil moisture contentSto the relative
6
Fig. 2. Model outline for simulating damage from drought-induced soil subsidence.
computed by multiplying the mean damage degree by the fraction of susceptible buildings. Finally, the mean damage ratio is scaled by the population density, resulting in annual building damages.
3.2 Subsidence indicators and vulnerability curves
3.2.1 Soil moisture deficit
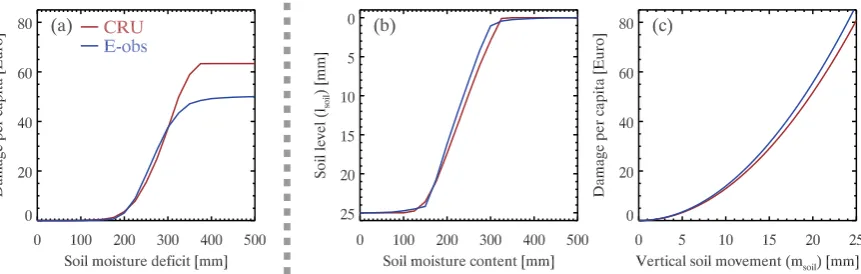
In regions with at least one wet season, such as the winters in France, it can be assumed that the soils are completely swollen once per year. In such climates, the occurrence and the magnitude of drought-induced soil subsidence depends on the amount of drying during the year, more specifically on the lowest soil moisture content. The highest soil moisture content, on the contrary, is irrelevant since it can be assumed to be high enough to imply completely swollen soils. This means that the annual soil moisture deficit, i.e. the difference between the water holding capacity and the minimum annual soil water content, can be seen as an appropriate indicator for drought-induced soil subsidence (see, e.g. C09). In the loss model, the annual soil moisture deficit indicator is trans-lated into mean damage degree using a vulnerability curve (Fig. 3a). To date, no specific vulnerability curves are avail-able for drought-induced soil subsidence, in contrast to other hazards, such as floods (Dutta et al., 2003, e.g.). However, a few characteristics of a vulnerability curve for drought-induced soil subsidence can be safely assumed. First, no damage is expected at zero soil moisture deficit. Second, the damage degree should monotonously increase with increas-ing soil moisture deficit. Based on these assumptions we can
derive optimum vulnerability curves. For that purpose, we use a genetic algorithm as in C09. See Sect. 3.3 below for more details.
3.2.2 Explicit indicator for drought-induced soil subsidence
As an alternative approach, we explicitly simulate the shrink-age and swelling of a soil. In this simulation, the vertical level if a soil depends on the computed soil moisture content, described by a soil shrinkage curve, i.e.
lsoil=s(θ ), (2)
wherelsoil is the vertical soil level andsthe shrinkage curve as function of the relative soil moisture saturationθ.
The indicator to use in the loss model part of the simula-tion is then the vertical soil movementmsoil,
msoil=lmaxsoil −lsoilmin=s(θmax)−s(θmin), (3) where max and min denote the annual maximum and min-imum values, respectively. There are soil shrinkage curves available for different soil types (Peng and Horn, 2005; Cor-nelis et al., 2006, e.g.). These curves apply, however, only for soil volumes with homogeneous soil water content, not for entire soil columns with vertically varying soil moisture con-tent. We can still assume that a soil shrinkage curve suitable for entire soil columns is a monotonously increasing func-tion, with the lowest (highest) vertical soil level at lowest (highest) soil moisture content. In addition, we can expect the curve to be flat at both the dry and wet end, forming an “S” shape.
We therefore use the genetic algorithm described in Sect. 3.3 to derive a soil shrinkage curve (Fig. 3b). To do that, we have to make two further assumptions. First, we scale the soil shrinkage curve to set the maximum soil subsi-dence at 25 mm, in agreement with observed soil subsisubsi-dence (Plante, 1998). This assumption is only a matter of scaling and has no influence on the simulated damages, since this term cancels out in the damage computation. Second, we assume the vulnerability curve to be a simple quadratic func-tion (Fig. 3c). This assumpfunc-tion impacts the result of the de-rived shrinkage curve. Sensitivity test using linear and cubic vulnerability curves showed no noticeable influence on the simulated damages (not shown).
3.3 Genetic algorithm
As in Corti et al. (2009), we use an optimization routine in-spired by nature, known as genetic algorithm (David, 1998), to derive empirical sets of parameters, such as vulnerability or soil shrinkage curves. For the soil moisture deficit indica-tor (Sect. 3.2.1), we use the algorithm to derive an optimum vulnerability curve. For computations with the explicit indi-cator for drought-induced soil subsidence (Sect. 3.2.2), a soil shrinkage curve is needed.
Fig. 3. Vulnerability curves for simulations with the soil moisture deficit indicator (a). Soil shrinkage (b) and
vulnerability (c) curves for simulations with the explicit indicator for drought-induced soil subsidence.
soil shrinkage curve, i.e.,
l
soil=
s
(
θ
)
,
(2)
185
where
l
soilis the vertical soil level and
s
the shrinkage curve as function of the relative soil moisture
saturation
θ
.
The indicator to use in the loss model part of the simulation is then the vertical soil movement
m
soil,
m
soil=
l
max soil−
l
min soil
=
s
(
θ
max
)
−
s
(
θ
min)
,
(3)
190
where
max
and
min
denote the annual maximum and minimum values, respectively. There are
soil shrinkage curves available for different soil types (Peng and Horn, 2005; Cornelis et al., 2006,
e.g.,). These curves apply, however, only for soil volumes with homogeneous soil water content,
not for entire soil columns with vertically varying soil moisture content. We can still assume that
a soil shrinkage curve suitable for entire soil columns is a monotonously increasing function, with
195
the lowest (highest) vertical soil level at lowest (highest) soil moisture content. In addition, we can
expect the curve to be flat at both the dry and wet end, forming an “S” shape.
We therefore use the genetic algorithm described in Section 3.3 to derive a soil shrinkage curve
(Figure 3b). To do that, we have to make two further assumptions. First, we scale the soil shrinkage
curve to set the maximum soil subsidence at 25
mm
, in agreement with observed soil subsidence
200
(Plante, 1998). This assumption is only a matter of scaling and has no influence on the simulated
damages, since this term cancels out in the damage computation. Second, we assume the
vulner-ability curve to be a simple quadratic function (Figure 3c). This assumption impacts the result of
the derived shrinkage curve. Sensitivity test using linear and cubic vulnerability curves showed no
noticeable influence on the simulated damages (not shown).
205
Fig. 3. Vulnerability curves for simulations with the soil moisture deficit indicator (a). Soil shrinkage (b) and vulnerability (c) curves for simulations with the explicit indicator for drought-induced soil subsidence.
The algorithm determines optimum vulnerability (soil shrinkage) curves as follows. First, a population of 100 ran-dom curves is generated, fulfilling the general criteria out-lined in Sect. 3.2.1 (Sect. 3.2.2), such as monotonicity. Each curve is defined at 21 supporting points covering the whole range of soil moisture deficits (relative soil moisture satura-tion). For each curve, a damage simulation is performed for the observation period (1989 to 2002) and the curve’s fitness is evaluated. The fitness is defined here as the inverse root mean square error between simulated and observed damage. Then, a subset of the 25 curves with the highest fitness is se-lected, replicated and randomly modified to form a new pop-ulation of curves. Through iteration, an optimal vulnerability (soil shrinkage) curve can thus be determined.
4 Results and discussion
We separately discuss results on the national and departmen-tal scale and focus on the time period 1989 to 2002. In ad-dition, we analyze the results for the exceptional year 2003, which was characterized by extreme heat wave and drought conditions (Sch¨ar et al., 2004; Andersen et al., 2005; Ciais et al., 2005) and by exceptionally widespread soil subsidence in France (Salagnac, 2007).
4.1 Results on national scale
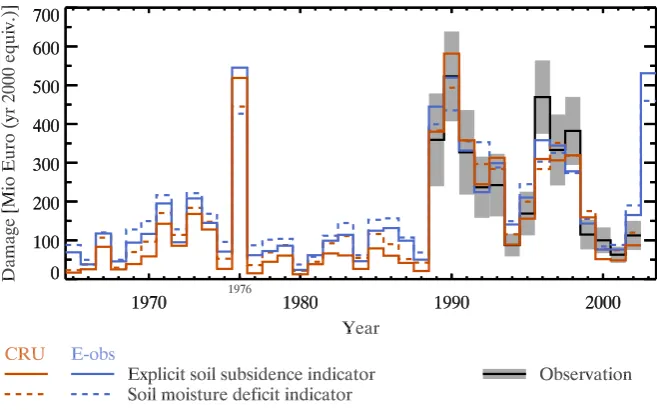
Results from simulations for the whole of France are pre-sented in Fig. 4. The individual simulation results are simi-lar. The differences induced by the different meteorological data sets are of the same magnitude as the differences from the two indicators. The similar performance of the two indi-cators confirms their equivalence as soil subsidence damage indicators in France and thus supports the assumptions made to derive the soil moisture deficit indicator (see Sect. 3.2.1) to be robust.
All four simulations agree quite favorably with the obser-vations available for the time period 1989 to 2002. Only for the year 1996, all simulation results lie outside the uncer-tainty range of the observed damages. The differences be-tween the simulation results are generally smaller than the uncertainty range. These damage observations hence do not allow to evaluate the respective quality of the two meteoro-logical data sets and damage indicators.
As for the time before 1989, for which no observations are available, the lower simulated damages with the exceptional peak in 1976 are in qualitative agreement with reports that substantial soil subsidence was only observed in 1976 during that period. This is true for all simulations.
For the year 2003, the simulation with the soil moisture deficit indicator yield damage costs of 460 million Euros, identical to the simulation with the C09 model. The costs derived using the explicit indicator for drought-induced soil subsidence amount to 530 million Euros. The model thus underestimates the damage costs reported by CCR (2007) of 1060 million Euros by a factor of two.
This means that regional differences in land use and geol-ogy considered in our refined model are unable to explain the large damage cost reported in 2003. A detailed discussion of potential reasons for this is provided in the next section.
4.2 Results on departmental scale
Figure 5 compares observed and simulated mean damage ra-tio in Euro per capita, averaged over the time period 1989 to 2002 using a bivariate color map (Teuling et al., 2010). The red (blue) shadings indicate that the simulation overestimates (underestimates) the observed damage ratio. The green dots indicate agreement within 50 % between simulation and ob-servation. The simulation is based on the E-OBS meteoro-logical data set and uses the explicit indicator for drought-induced soil subsidence. Simulations using different combi-nations of meteorological data set and subsidence indicator
Fig. 4. Damage time series for simulations and observations drought-induced soil subsidence with uncertainty
range.
with the exceptional peak in 1976 are in qualitative agreement with the reports that substantial soil 240
subsidence soil subsidence was only observed in 1976 during that period. This is true for all simula-tions.
For the year 2003, the simulation with the soil moisture deficit indicator yield damage costs of 460 Million Euros, identical to the simulation with the C09 model. The costs derived using the explicit indicator for drought-induced soil subsidence amount to 530 Million Euros. The model thus 245
underestimates the damage costs reported by CCR (2007) of 1060 Million Euros by a factor two. This means that regional differences in land use and geology considered in our refined model are unable to explain the large damage cost reported in 2003. A detailed discussion of potential reasons for this is provided in the next section.
4.2 Results on departmental scale
250
Figure 5 compares observed and simulated mean damage ratio in Euro per capita, averaged over the time period 1989 to 2002 using a bivariate color map (Teuling et al., 2010). The red (blue) shadings indicate that the simulation overestimates (underestimates) the observed damage ratio. The green dots indicate agreement within 50% between simulation and observation. The simulation is based on the E-obs meteorological data set and uses the explicit indicator for drought-induced soil 255
subsidence. Simulations using different combinations of meteorological data set and subsidence indicator yield comparable results leading to the same conclusions as detailed in the following (not shown).
10
Fig. 4. Damage time series for simulations and observations of drought-induced soil subsidence with uncertainty range.
Fig. 5. Mean departemental observed and simulated damage ratio in Euro per capita, averaged for the time
period 1989 to 2002. Simulation driven by Eobs meteorological data set and explicit indicator for drought-induced soil subsidence. Stipples indicate an agreement within 50% between simulation and observation.
There is a good qualitative agreement between simulated and observed damage occurrence, as detailed in Table 1. In 42 out of 95 departments, simulation and observation agree on mean damages
260
ratio below 2 Euro per capita (light gray shading). In 29 departments, substantial damages are found in simulation and observation, with damage ratios agreeing within 50%. In 16 departments, sim-ulation and observations disagree on the presence of a substantial damage level. Especially strong disagreement occurs in the department Puy de Dˆome in central France, where observed damages exceed 20 Euro per capita are opposed by simulated damages below 2 Euro per capita. Qualitative
265
agreement on the occurrence of damages, but larger differences between simulation and observa-tion are found in 8 departments. There are at least two explanaobserva-tions for the underestimaobserva-tion in the department Puy de Dˆome. First, the reported damages might not stem from drought-induced soil subsidence, but from soil subsidence due to another cause. In that case however, the damages have been reported falsely as damages from drought-induced soil subsidence within the natural
catastro-270
phes insurance system. Second, varying construction standards might play a role, yielding higher damages in this department.
By comparison, the overall agreement is poor for the year 2003 (Table 1). In the large majority
11
Fig. 5. Mean departemental observed and simulated damage ratio in Euro per capita, averaged for the time period 1989 to 2002. Simulation driven by E-OBS meteorological data set and explicit indicator for drought-induced soil subsidence. Stipples indicate an agreement within 50 % between simulation and observation.
yield comparable results, leading to the same conclusions as detailed in the following (not shown).
There is a good qualitative agreement between simulated and observed damage occurrence, as detailed in Table 1. In 42 out of 95 departments, simulation and observation agree on mean damages ratio below 2 Euro per capita (light gray
shading). In 29 departments, substantial damages are found in simulation and observation, with damage ratios agreeing within 50 %. In 16 departments, simulation and observa-tions disagree on the presence of a substantial damage level. Especially strong disagreement occurs in the department Puy de Dˆome in central France, where observed damages above
Table 1. Evaluation of simulated damage costs on departmental level. Number of departments with agreement or disagreement between simulated and observed damage costs concerning the absence of substantial damage levels or on the damage level within the range of uncertainty. See text for exemplary explanation.
Agreement on Agreement on Disagreement on Disagreement on Indicator absence of damages damage level absence of damages damage level 1989–2002
CRU
Soil moisture deficit 43 23 15 14
explicit subsidence simulation 49 26 12 8
E-OBS
Soil moisture deficit 40 31 18 6
explicit subsidence simulation 42 29 16 8
2003 E-OBS
Soil moisture deficit 6 26 37 26
Explicit subsidence simulation 10 26 34 25
20 Euro per capita are opposed by simulated damages below 2 Euro per capita. Qualitative agreement on the occurrence of damages, but larger differences between simulation and ob-servation, are found in 8 departments. There are at least two explanations for the underestimation in the department Puy de Dˆome. First, the reported damages might not stem from drought-induced soil subsidence, but from soil subsidence due to another cause. In that case, however, the damages have been reported falsely as damages from drought-induced soil subsidence within the natural catastrophes insurance sys-tem. Second, varying construction standards might play a role, yielding higher damages in this department.
By comparison, the overall agreement is poor for the year 2003 (Table 1). In the large majority of departments, simu-lation and observation disagree on the presence of damages or at least on the damage level. For some departments, the disagreement on the absence of damages might be the result of incomplete damage reports by the insurers, i.e. the occur-rence of damages might have been correctly simulated, but was not reported. This does, however, not solve the underes-timation of the damage level diagnosed in more than 20 de-partments.
Several explanations for the poor performance in 2003 are possible. First, the damages reported in 2003 might include reports of damages from previous events. Such damage ac-cumulation is a potential side effect of the French insurance system, which requires a declaration of state of natural disas-ter due to drought-induced soil subsidence to allow individu-als report damages. Second and related to the previous point, the large public and media attention concerning the 2003 heat wave might have fostered a higher rate of damage re-ports than previous events. Third and similar to the previous discussion for the department Puy de Dˆome, the damages might stem from a physical mechanism not included in our model, e.g. from subsidence due to excessive ground water extraction or other causes. In that case, however, the damages
should not have been reported within the natural catastro-phes insurance system. Finally, varying construction stan-dard might play a role, yielding higher damages in regions affected by drought-induced soil subsidence for the first time in 2003 (Corti et al., 2009).
5 Conclusions
We have presented and evaluated a refined version of the model simulating damage costs from drought-induced soil subsidence introduced by C09. We introduced a new indica-tor for drought-induced soil subsidence, explicitly simulating the shrinkage and swelling of soils. In the evaluation, this in-dicator yielded results of equivalent quality as the original indicator for France and should therefore be used preferen-tially due to its broader applicability across different climate regimes. In the new model, the influence of geology and land use on regional damage levels is taken into account by determining the fraction of buildings susceptible to drought-induced soil subsidence.
The evaluation of damage simulations on departmental scale showed a good representation of the regions affected by drought-induced soil subsidence. Substantial differences be-tween simulated and observed damages were however found in some departments. Investigations focusing on these de-partments might provide valuable insight regarding the ori-gin of these damage costs.
Data Service at http://dataservice.eea.europa.eu/dataservice/. Geo-logical information was obtained from the Bureau de Recherches G´eologiques et Mini`eres (BRGM) at http://www.argiles.fr. The European Soil DataBase (ESDB) was obtained from http://eusoils.jrc.ec.europa.eu/ESDB Archive/ESDB/.
Edited by: A. Barros
Reviewed by: two anonymous referees
References
Andersen, O. B., Seneviratne, S. I., Hinderer, J., and Viterbo, P.: GRACE-derived terrestrial water storage depletion associated with the 2003 European heat wave, Geophys. Res. Lett., 32, L18405, doi:10.1029/2005GL023574, 2005.
Basagaoglu, H., Marino, M. A., and Botzan, T. M.: Land subsi-dence in the Los Banos-Kettleman City area, California: Past and future occurrence, Phys. Geogr., 20, 67–82, 1999.
Cabral-Cano, E., Dixon, T. H., Miralles-Wilhelm, F., Diaz-Molina, O., Sanchez-Zamora, O., and Carande, R. E.: Space geodetic imaging of rapid ground subsidence in Mexico City, Geol. Soc. Am. Bull., 120, 1556–1566, 2008.
CCR: Natural disasters in France, Caisse Centrale de R´eassurance, Paris, 2007.
CEC-EEA: CORINE Land Cover; technical guide. Report EUR 12585EN, Office for Publications of the European Communities, Luxembourg, 144 pp., 1993.
Ciais, P., Reichstein, M., Viovy, N., Granier, A., Ogee, J., Allard, V., Aubinet, M., Buchmann, N., Bernhofer, C., Carrara, A., Cheval-lier, F., De Noblet, N., Friend, A. D., Friedlingstein, P., Grun-wald, T., Heinesch, B., Keronen, P., Knohl, A., Krinner, G., Loustau, D., Manca, G., Matteucci, G., Miglietta, F., Ourcival, J. M., Papale, D., Pilegaard, K., Rambal, S., Seufert, G., Sous-sana, J. F., Sanz, M. J., Schulze, E. D., Vesala, T., and Valentini, R.: Europe-wide reduction in primary productivity caused by the heat and drought in 2003, Nature, 437, 529–533, 2005.
Cornelis, W. M., Corluy, J., Medina, H., Hartmann, R., Van Meir-venne, M., and Ruiz, M. E.: A simplified parametric model to describe the magnitude and geometry of soil shrinkage, Eur. J. Soil Sci., 57, 258–268, 2006.
Corti, T., Muccione, V., Kllner-Heck, P., Bresch, D., and Senevi-ratne, S. I.: Simulating past droughts and associated building damages in France, Hydrol. Earth Syst. Sci., 13, 1739–1747, doi:10.5194/hess-13-1739-2009, 2009.
Crilly, M.: Analysis of a database of subsidence damage, Struct. Surv., 19, 7–14, 2001.
David, A. C.: An Introduction to Genetic Algorithms for Scientists and Engineers, World Scientific Publishing Co., Inc., 200 pp., 1998.
Doornkamp, J. C.: Clay Shrinkage-Induced Subsidence, Geogr. J., 159, 196–202, 1993.
Dumas, P., Macaire, A., and Chavarot, A.: Mission d’enquete sur le regime d’indemnisation des victimes de catastrophes naturelles. rapport particulier sur les risques de subsidence dus a la secher-esse, IGF-CGPC-IGE, Paris, 2005.
Dutta, D., Herath, S., and Musiakec, K.: A mathematical model for flood loss estimation, J. Hydrol., 277, 24–49, 2003.
EEA: Corine land cover 2000, European Environment Agency, 2007.
EEA: Population density grid of EU-27+, version 5, EEA data ser-vice, European Environment Agency, 2009.
Fityus, S. G., Smith, D. W., and Allman, M. A.: Expansive Soil Test Site Near Newcastle, J. Geotech. Geoenviro. Eng., 130, 686–695, 2004.
Haylock, M., Hofstra, N., Klein Tank, A., Klok, E., Jones, P., and New, M.: A European daily high-resolution gridded dataset of surface temperature and precipitation, J. Geophys. Res.-Atmos., 113, D20119, doi:10.1029/2008JD010201, 2008.
JRC: European Soil Database, Joint Research Centre, European Commission, 2009.
Mitchell, T. D. and Jones, P. D.: An improved method of construct-ing a database of monthly climate observations and associated high-resolution grids, Int. J. Climatol., 25, 693–712, 2005. Navarro, V., Candel, M., Yustres, A., Sanchez, J., and Alonso,
J.: Trees, soil moisture and foundation movements, Comput. Geotech., 36, 810–818, 2009.
Palmer, W. C.: Meteorological drought, Research Paper No. 45, US Weather, Bureau: Washington DC, 1965.
Peng, X. and Horn, R.: Modeling soil shrinkage curve across a wide range of soil types, Soil Sci. Soc. Am. J., 69, 584–592, 2005. Plante, S.: Subsidence case studies: using soil suction techniques,
Struct. Surv., 16, 141–145, 1998.
Popescu, M. E., Rosenbaum, M. S., Schreiner, D. H., and Nathanail, P. C.: Regional scale assessment of expansive soils as a geo-hazard, in: Geotechnics of Hard Soils – Soft Rocks, Vol 1, edited by: Evangelista, A. and Picarelli, L., A a Balkema Publishers, Leiden, 283–288, 1998.
Richards, B. G., Peter, P., and Emerson, W. W.: Effects of vegeta-tion on the swelling and shrinking of soils in Australia, Geotech-nique, 33, 127–139, 1983.
Salagnac, J. L.: Lessons from the 2003 heat wave: a French per-spective, Build. Res. Informat., 35, 450–457, 2007.
Sch¨ar, C., Vidale, P. L., L¨uthi, D., Frei, C., H¨aberli, C., Liniger, M. A., and Appenzeller, C.: The role of increasing temperature variability in European summer heatwaves, Nature, 427, 332– 336, 2004.
Stramondo, S., Saroli, M., Tolomei, C., Moro, M., Doumaz, F., Pesci, A., Loddo, F., Baldi, P., and Boschi, E.: Surface move-ments in Bologna (Po Plain-Italy) detected by multitemporal DInSAR, Remote Sens. Environ., 110, 304–316, 2007.
Teuling, A., Stoeckli, R., and Seneviratne, S. I.: Bivariate color maps for visualising climate data, Int. J. Climatol., 30, 1408– 1412, doi:10.1002/joc.2153, 2010.
Webb, P.: Hoopsafe beams to rectify subsidence damage in low-rise buildings, Structural Survey, 17, 109–116, 1999.
Weber, L. and Nkemdirim, L.: Palmer’s drought indices revisited, Geogr. Ann. Ser. a-Phys. Geogr., 80A, 153–172, 1998.