AN EXPERIMENTAL STUDY AND MODELLING OF THE RESPONSE OF A VIBROFLUIDIZATION
TECHNIQUE FOR PARTICLE SIZING
A thesis submitted to the University of London for the degree of
Doctor of Philosophy
by
Bahram Keyvani
Department of Chemical and Biochemical Engineering University College London
All rights reserved
INFORMATION TO ALL U SE R S
The quality of this reproduction is d ep en d en t upon the quality of the copy subm itted.
In the unlikely even t that the author did not sen d a com plete manuscript
and there are m issing p a g e s, th e se will be noted. Also, if material had to be rem oved, a note will indicate the deletion.
uest.
ProQ uest 10017171
Published by ProQ uest LLC(2016). Copyright of the Dissertation is held by the Author.
All rights reserved.
This work is protected against unauthorized copying under Title 17, United S ta tes C ode. Microform Edition © ProQ uest LLC.
ProQ uest LLC
789 East E isenhow er Parkway P.O. Box 1346
Abstract
This thesis describes the results of an experimental study and modelling of the response of a vibrofluidization technique for particle sizing. The principle of operation of the device is simple and relies on the fact that when a container, partially filled with a powder is vibrated in the vertical direction with a maximum acceleration greater than that due to gravity, the particles inside the container become effectively "fluidised". The degree of damping experienced by the vibrating system is a direct function of the average particle size; larger particles give rise to a higher degree of damping. In the case where the container is attached at the free end of a cantilever, the average particle size is directly related to the resonant amplitude of vibration of the cantilever. This forms the basis for the application of this type of device for particle sizing.
A convenient and deceptively logical explanation would be to attribute the observed damping of oscillation to particle/wall friction. Indeed, the response of the system was modelled accordingly by Mahgerefteh and Al-Khoory (1991) using visco-elastic vibration phenomena.
The results of this work show, using direct experimental evidence that the primary mechanism responsible for the observed damping is a consequence of the phase lag between the vibrating cavity and the test powder. The previously proposed particle/wall interaction mechanism although applicable, is simply a direct manifestation of the phase lag phenomenon. In addition preliminary results obtained proving the applicability of the device for particle size distribution analysis are also presented.
The phase lag between the vibrating cavity and the powder is monitored using a sonic technique. This is achieved by measuring the intensity of the noise generated as a result of the impact of the powder with the containing cavity during oscillations. The results show a direct correlation between phase lag and the average particle size. A semi- empirical model is also developed which satisfactorily predicts the system's response in terms of a large number of design and operating parameters. This model is expected to serve as a powerful tool for design optimization.
ACKNOWLEDGEMENTS
My special thanks go to my supervisor Dr Haroun Mahgerefteh for his valuable supervision, constant encouragement and help throughout this work.
I wish to express my appreciation to all the technical staff of the departmental workshop for their helpful support and construction of the apparatus. I am very grateful to Mr Martin Vale and his colleagues in the electronic workshop for their very prompt responses and help at any time.
Omar Khayyam
l i s t o f contents
LIST OF CONTENTS
ABSTRACT 2
ACKNOW LEDGEMENTS 4
CHAPTER 1
In tro d u ctio n 13
CHAPTER 2
Particulate characteristics and fundam ental definitions 16
2.1 Particle size 16
2.2 Particle shape 18
2.3 Particle density 18
2.4 Powder classification 19
2.5 Segregation and percolation 19
2.6 Methods of presenting particle size distribution data 19 2.6.1 Average particle size : mean, median and mode 21 2.6.2 Presentation and analysis of data from sieve tests 22 CHAPTER 3
L iterature survey on particle size m easurem ent 26
3.1 Introduction 26
3.2 Review of existing methods for particle size distribution
analysis 26
3.2.1 Sieving 26
3.2.2 Optical methods 28
3.2.2.1 Microscopy 28
3.2.2.2 Light interaction 31
3.2.3 Gravitational methods 35
3.2.3.2 Centrifugal method 36
3.2.4 The electrical sensing zone method 38
3.2.5 Elutriation method 40
3.2.6 Sonic method 43
3.2.7 Pulse method 44
3.2.8 Adsorption method 44
3.2.9 Cascade impactor 45
3.2.10 Field flow fractionation 46
3.2.11 Gas cyclones 47
3.2.12 X-ray method 48
3.3 Conclusion 49
3.4 Particulate bed behaviour during vibrofluidization 53
3.5 Conclusion 55
CHAPTER 4
Particle size measurement using vibrofluidization 57
4.1 Introduction 57
4.2 The apparatus 58
4.2.1 The electronic drive and detection systems 60 4.2.2 Computer aided data acquisition and analysis system 63 4.3 Methodology for the measurement of average particle size
using the vibration technique 65
4.3.1 The effect of powder mass 68
4.3.2 The effect of powder density 68
4.4 Optimization of the system's response in terms of resolution in
List o f contents
4.4.1 The effect of vibration intensity 73
4.4.2 The effect of presence of air in the sample cell 77 4.4.3 The effect of the vibrating cell design 80
4.4.3.1 Internal surface roughness 80
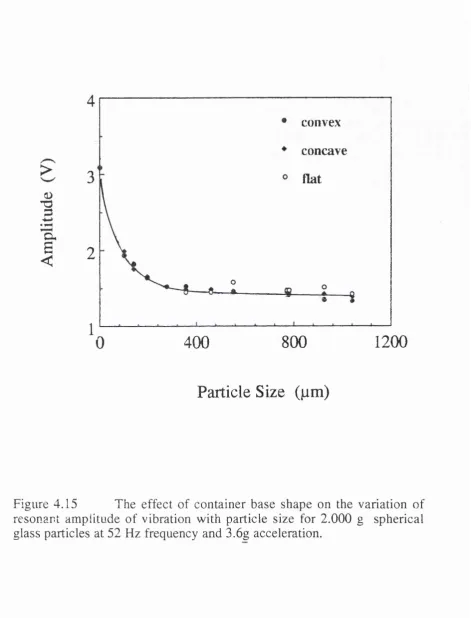
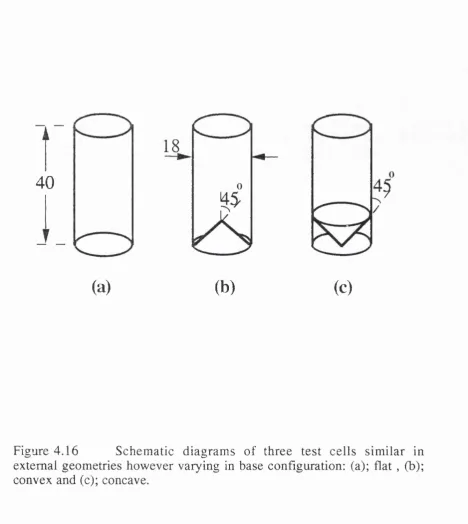
4.4.3.2 The effect of the cell internal diameter 80 4.4.3.3 Bed height to the cell diameter ratio (h/D) 83 4.4.3.4 The effect of the base shape of the vibrating cell 86 4.4.3.5 The effect of sample cell elasticity 86
4.5 Conclusion 90
CHAPTER 5
Theoretical modelling of the system’s response for
particle sizing 92
5.1 Introduction 92
5.2 Literature survey of theoretical models in vibrofluidization 92
5.2.1 Plastic body model 96
5.2.1.1 Incompressible gas model 98
5.2.1.2 Compressible gas model 104
5.2.1.3 Wall friction model 108
5.2.1.4 Expanding bed model 111
5.2.2 Summary 114
5.2.3 Visco-elastic body model 115
5.3.3 Variation of damping coefficient with cell internal
diameter 127
5.3.4 Variation of damping coefficient with vibration intensity 129 5.3.5 Variation of damping coefficient with particle size 129 5.3.6 Number of equivalent layers of particles 133
5.4 Model validation 140
5.5 Conclusion 147
CHAPTER 6
The measurement of the phase lag between the vibrating
cell and the fluidised bed 149
6.1 Introduction 149
6.2 Experimental arrangement 151
6.2.1 Selection of signal detector 151
6.2.2 Phase lag measurement electronics 152
6.3 Results 155
6.4 Conclusion 169
CHAPTER 7
Particle size distribution analysis using vibration
segregation method 171
7.1 Introduction 171
7.2 Particle size distribution analysis using the vibrating reed
device 171
7.3 Particle size distribution analysis using segregation 178 7.4 Particulate segregation literature survey 179
7.4.1 Gas fluidization 179
7.4.2 Pouring heaps 180
List o f contents
7.4.4 Radial and axial segregation 181
7.4.5 Cohesive segregation 182
7.4.6 Shaking 182
7.4.7 Vibrational segregation 183
7.5 Segregation mechanism 185
7.5.1 Trajectory segregation 185
7.5.2 Fluidization 185
7.5.3 Percolation of fine particles 186
7.5.4 The rise of coarse particles during vibration 187
7.5.5 Convection effects 188
7.5.6 Elutriation segregation 189
7.6 Kinetics of segregation 189
7.7 Experimental 190
7.7.1 Apparatus 190
7.7.2 Results 197
7.7.2.1 Vibration segregation : Optimization of segregation
efficiency 197
7.7.2.1.1 The effect of supporting particles height 198
7.7.2.1.2 The effect of support gauze 202
7.7.2.1.3 The effect of discharge nozzle 205 7.7.2.1.4 The effect of vibration frequency 205 7.7.2.1.5 The effect of vibration prior to sample
collection 209
7.7.2.1.6 Presentation of particle size distribution data
obtained from vibrofluidization : Primary results 211
7.7.2.1.7 The effect of support particle density 211
1 .1 2 2 Optimization of the system’s response in terms of
resolution in particle size classification 214 7.7.2.2.1 The effect of support bed particles on the
efficiency of the segregation column 215
7.7.2.2.1.1 The effect of diameter of the support
bed particles 215
7.7.2.2.1.2 The effect of frequency of vibration on the
size selection of the supporting particles 215 7.7.2.2.1.3 The effect of composition of the
support bed particles 223
1.1.2.3 Determination of particle size distribution using
vibrofluidization 225
7.8 Conclusion 228
CHAPTER 8
Particle size measurement using free vibration technique 231
8.1 Introduction 231
8.2 Free vibrating systems 231
8.3 Experimental set up 233
8.4 Results 233
8.4.1 The variation of decay constant with time during decay
period 236
8.4.2 The dependency of decay function on particle size 237 8.4.3 The effect of powder mass, density, cell diameter and
vibration frequency on the system’s response 242 8.4.4 The effect of initial amplitude on decay profile 253
8.5 Conclusion 256
CHAPTER 9
Conclusions 257
List o f contents
NOMENCLATURE 262
REFERENCES 272
APPENDICES 280
APPENDIX A 280
APPENDIX B 282
APPENDIX C 289
CHAPTER 1
Introduction
Approximately one third of chemicals produced in the world are in form of powder (Shamlou 1988) and nearly all aspects of the technology relating to their handling , processing or application require at some stage a knowledge of the particle size. Particle size measurement is to powder technology as thermometry is to the study of heat (Allen 1990). In recent years, many devices of high sensitivity with different degrees of sophistication have therefore been developed. Unfortunately, the majority are either expensive, capable of handling small samples only or require special sample preparation prior to size analysis.
Approximately four years ago, in response to a need for a robust and cheap transducer, Mahgerefteh and Al-Khoory (1991) reported the preliminary design and development of a novel technique for particle size analysis.
The principle of operation of the device is simple and relies on the fact that when a container partially filled with a powder is driven into resonance in the vertical direction with a maximum acceleration greater than that due to gravity, the particles inside the container become effectively fluidised. The degree of damping experienced by the vibrating system is a direct function of the average particle size; larger particles give rise to a higher degree of damping. The average particle size of the vibrofluidized powder may therefore be easily obtained from a measurement of the resonance amplitude of vibration. The above forms the basis for the use of the device as a particle sizer.
Chapter 1 Introduction
The relative insensitivity of the instrument at large size ranges(> 400 jam) together with its inability to produce data on particle size distribution were recognised as two of the major drawback of the device.
To explain the basic mechanism governing the response of the system, Mahgerefteh and Al-Khoory (1991) attributed the observed damping of oscillations to particle/wall friction and hence modelled the response of the system accordingly.
This thesis describes the results of a series of experimental studies which elucidate the basic mechanism governing the system's response and its engineering design optimization. It also describes the results of some preliminary experiments relating to the use of the device for particle size distribution analysis.
The work is divided into nine chapters; each where appropriate, begins with a literature survey followed by a discussion of the main findings.
Chapter 2 is a brief discussion of particulate characteristics and fundamental definitions of particle size as reported in the open literature.
Chapter 3 is a review of the technical features together with the relative merits and disadvantages of the existing methods for particle size analysis. This is then followed by a brief review of work reported on particulate bed behaviour during vibrofluidization.
Chapter 4 first describes the basic design features of the proposed device for particle size analysis. It then deals with a systematic study and optimization of the system's response in terms of producing particle size data. The above involves conducting a large number of experiments in
which the effects of sample cell dimensions, surface roughness, elasticity, and shape as well as oscillation frequency, the vibrofluidized bed diameter/height ratio and the vibration force are investigated.
Chapter 5 describes the development of a semi-empirical model for predicting the system's response. As compared to a previous model proposed by Mahgerefteh et al. (1991), the present model incorporates a wider range of design and operating parameters. The validity of the model is tested by comparison with appropriate experimental data.
In chapter 6, it is shown, using direct experimental evidence that the primary mechanism responsible for the observed damping of oscillations of the system is a consequence of the phase lag between the vibrating cell and the test powder. The previously proposed particle/wall interaction model by Mahgerefteh et al. (1991) although applicable, is simply a direct manifestation of the observed phase lag phenomenon.
Chapter 7 deals with the utilisation of the vibrating reed system in order to produce data on particle size distribution. This involves size segregation of the test sample followed by determination of the average size and mass of each fraction using the vibrating reed technique.
Mahgerefteh and Al-Khoory (1991) also used free rather than forced vibration as an alternative method for particle size analysis using the same vibrating reed technique. In this case the decay profile was claimed to be a characteristic of the average particle size. Chapter 8 investigates the viability of this technique for producing data on average particle size.
Chapter 9 is a general conclusion of the main finding of the thesis.
Chapter 2 Particulate characteristics and fundamental definitions CHAPTER 2
Particulate characteristics and fundamental definitions
This chapter briefly reviews the fundamental definitions of the parameters used in this thesis to characterise powders in terms of size, density, shape and classification. Various methods of presenting particle size distribution data are also discussed.
2.1 Particle size
The best definition for a powder particle is a small size of solid material with considerable surface area to volume ratio (Hausner 1980).
The behaviour of particles is widely dictated by the expanded surface area. Particle size can be characterised by the "diameter" of the particle. For spherical homogeneous particles, only diameter is sufficient to properly define the size, and for a cube, the length along one edge is characteristic, whereas for other regular particles such as cuboid and cone, more than one dimension may be needed. For irregular particles however, it is impossible to identify its size by one or two dimensions. In order to specify particle size with only one dimension a size dependent property is always perferred and the size is then expressed in terms of equivalent spherical diameter. Size dependent properties like optical density, hydrodynamic behaviour and geometrical similarities are to name but a few. The estimated size by various properties can differ substantially (Allen 1990). Table 2.1 shows different definitions of particle size. In the present study, the particle size is expressed on the basis of the sieve diameter. The corresponding definition is given in Table 2.1 .
Symbol Name Definition Formula
dv Volume diameter Diameter of a sphere having the
same volume as the particle
ds Surface diameter Diameter o f a sphere having the
same surface as the particle S = ïïd^
dsv Surface volume Diameter of a sphere having the d^
diameter same external surface to volume ratio as a sphere
dd Drag diameter Diameter of a sphere having the
same resistance to motion as the particle in a fluid of the same viscosity and at the same velocity (d j approximates to
dg when R e is small)
Fd - 2 where Cj^A = /(d ^ )
F d = ^TTdfiVv
R e < 0 . 2 d f Free-falling Diameter o f a sphere having the
diameter same density and the same free-falling speed as the particle in a fluid o f the same density and viscosity
d s t k Stokes’ diameter The free-falling diameter of a par , d l
ticle in the laminar flow region
(Re < 0 . 2 )
d ^ =
---dd da Projected area Diameter o f a circle having the
diameter same area as the projected area of the particle resting in a stable position
tr ,2
A da
dp Projected area Diameter o f a circle having the Mean value for all
diameter same area as the projected area o f the particle in random orientation
possible orientat ions dp = dg for convex particles
dc Perimeter
diameter
Diameter of a circle having the same perimeter as the projected outline o f the particle
dA Sieve diameter The width o f the minimum square
aperture through which the particle will pass
d p Feret’s diameter The mean value of the distance
between pairs of parallel tan gents to the projected outline of the particle
dM Martin’s diameter The mean chord length of the
projected outline of the particle
f2ff ^ j dRdÔR dR Unrolled The mean chord length th rou ^
diameter the centre of gravity of the particle
Table 2.1 Definitions of particle size (Allen 1990).
Chapter 2 Particulate characteristics and fundamental definitions 2.2 Particle shape
Particle shape which is mainly a size dependent parameter, influences many properties relevant to powder handling such as flowability, bulk density and packing behaviour (Allen 1990 , Svarovsky 1987) .
There are two ways in which particle shape may be defined (Allen 1990). One is in terms of a number, mainly used for the purpose of comparison and hence, actual particle size is not important. The other is based on data which allows the regeneration of the original particle shape from the obtained data. One way or another, different sizes of a particle can be related to each other by reference to particle shape by using dimensionless parameters such as shape factors. The relationship between volume or surface area of a particle to its already estimated sizes are defined by shape coefficients.
2.3 Particle density
The ratio of the total mass of particle to the total volume is called particle density, which in itself depends on how the particle volume is measured (Svarovsky 1987). If the volume of the solid particle, free from open and closed pores, is considered, then the true particle density may be assigned. For porous particles with open pores on the other hand, apparent particle density may be computed. The effective particle density on the other hand, takes into account the volumes of both open and closed pores.
The bulk density, however, includes the voidages in between the particles. In the present study, particle density is taken as the apparent density.
2.4 Powder classification
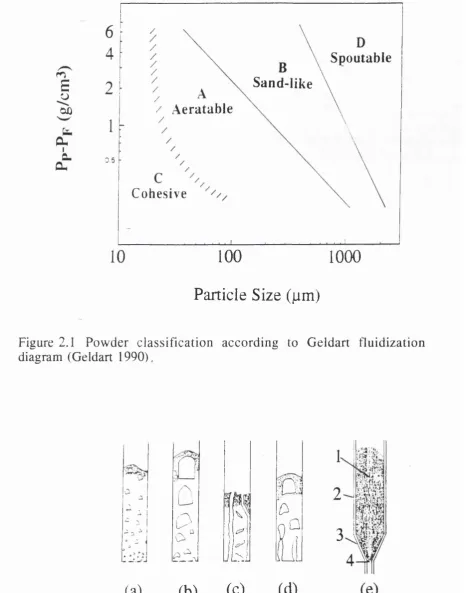
The particulate behaviour in a fluidised bed is mainly dependent on particle size and effective density. According to Geldart fluidization chart, any powder can be classified into one of four groups A,B,C,or D as shown in figures 2.1 and 2.2 (Svarovsky 1987 , Geldart 1986). Powders in group C, due to high ratio of inter-particle forces to hydrodynamic force, are very cohesive and hardly fluidised. Powders in group A, are most easily fluidised since the ratio of interparticle to hydrodynamic forces is less than unity. There are no interparticle forces in groups B and D and the bed expansion in group B is small. A transition group between groups A and C has recently been recognized as semi-cohesive.
2.5 Segregation and perculation
During powder handling i.e. mixing or fluidising operations, segregation phenomena to some extent demix the process by means of various mechanisms (Beddow 1980). The filtration of fine particles down through the moving larger ones is called percolation. The top layers of particles behave as a screen through which all but coarser particles are able reach to a stable position below.
2.6 Methods of presenting particle size distribution data
Particle size distribution data may be expressed in terms of Gaussian distribution in which the average particle size is measured. Allen and Khan (1970) have defined the following parameters to describe the average particle size.
Chapter 2 Particulate charactenstics and fundamental definitions
E
u "5b ffUI Û. CL
Spoutable Sand-like
Aeratable
0 . 5
Cohesive
100
1000
Particle Size (pm)
Figure 2.1 Powder classification according to Geldart fluidization diagram (Geldart 1990),
/A u
D
o '
(a) (b)
^1 b i
(c)
I
Q
20 0 ^
îi!
3(d)
Figure 2.2 Different types of fluidization showing; (a) bubbling, (b) slugging, (c) channeling, (d) jetting, and (e) spouting. The spout (1), occurs through the central part of the fluidization column. The column itself comprises the shell (2), the cone (3) and the screen (4). (Geldart 1990)
2.6.1 Average particle size : mean, median and mode
Arithmetic mean size (dj) refers to the particle size of the adjacent sieves between which the powder is retained after sieving process
di 2 (2.1)
where; d\ and dh are aperture sizes for lower and upper sieves respectively. The powder mean size dp , is then defined :
I f
i (2.2)
and mass fraction, xj corresponding to the arithmetic mean size, dj having the mass, mj is given by;
m,
X . = ^
' (2.3)
where; Emj is the total mass sieved (x is often expressed in 'percentage').
Mass median size (MS) is the value of particle size in a probability size distribution graph at which x is 50% .
Mode is the value of particle size in the same graph, at which x is a maximum.
The above average values are not necessarily the same.
Chapter 2 Particulate characteristics and fiindamental definitions
2.6,2 Presentation and analysis of data from sieve tests
Mullin (1993) discusses the two common presentations of particle size distribution; "frequency polygon" and "frequency histogram". Figures 2.3a and 2.3b show examples of representing the variation of fractional weight per cent retained between any two sieves with sieve aperture width for the same analytical data plotted on arithmetic graph paper in two different forms; frequency polygon and frequency histogram respectively. Figures 2.4a and 2.4b show alternative representations of the same data on semi-log graph papers in the two forms of frequency polygon and frequency histogram respectively These data are then converted to " cumulative undersize (or oversize) " and normally presented as weight percentage (wt%) versus sieve aperture size.
The cumulative wt% undersize fraction (0) is the total fraction smaller than size di :
d; dj
e = l x or e = ^ x . d ( d . ) (2.4)
The cumulative wt% oversize fraction (0) is the total fraction larger than size di ;
0 = l x or 0 = j x . d ( d )
d. 1 d.1
Figures 2.5a - 2.5c show consequentely three different ways by which the cumulative data can be shown : the arithmetic, the semi-log and the log-log plots on graph papers. To avoid bunching at the lower end (due to /2 expansion) the latter two forms of presentation are preferred.
30
c 2f
G.
J
5 : 0 1000 500 2 0 0: 2500 0 500 lOOC 1500 2000 2500
Sieve a p ertu re widtf'.,/^rr.
(a)
S i e v e a p ertu re wiaîr.,^m
(b)
Figure 2.3 Particle size distribution data in terms of the variation of fractional weight per cent retained with sieve aperture width plotted on arithmetic graph paper: (a) the frequency polygon, (b) the frequency histogram (Mullin 1993).
Corresponding 3 . S. m esh numbers Corresponding B.S. m e s h n u m b e rs
30
■o c
o c
c 20
a) a cn c c V 3 a
2000 3 0 0 0
00 2 0 0 300 500 lOQi
S ie v e a p ertu re width,
'1 0 0 2 0 0 3 0 0 500 10 0 0 2300 3000
S ie v e aperture width,/^m
(a) (b)
Figure 2.4 Particle size distribution data in terms of the variation of fractional weight per cent retained with sieve aperture width plotted on semi-log graph paper; (a) the frequency polygon, (b) the frequency histogram (Mullin 1993).
Chapter 2 Particulate charactenstics and tiindanientai defm itum s
100
a
Undersize
° Oversize >
0 1000 2000 3 0 0 0
Sieve aperture width (pm)
(a) 100
• Undersize O Oversize
too 1000 10000
100
Undersize O Oversize o.
cc 10
1 *—
too 1000 10000
Sieve aperture width (jjm)
(b)
Sieve aperture width (pm)
(c)
Figure 2.5 Particle size distribution data in terms of the variation of cumulative weight per cent (undersize and oversize) with sieve aperture width plotted on; (a) arithmetic graph paper, (b) semi-log graph paper, (c) log-log graph paper (Mullin 1993).
The frequency percentage or frequency distribution versus size can be used to present the polygons and histograms for optical methods of determining particle size.
Chapter 3 Literature survey on particle size measurement
CHAPTER 3
Literature survey on particle size measurement
3.1 Introduction
This chapter is divided into two main parts. A review of the technical features together with the relative merits and disadvantages of some of the main commercially available instruments for particle size analysis is given first. Various methods include sieving, optical and gravitational methods, electrical sensing zone, élutriation, sonic and pulse sensing, gas adsorption, cascade impactor, field flow fractionation, gas cyclones and X-ray techniques. The review also covers some of the important particle sizing instruments reported in the open literature which are at the research and development stage.
As the main principle of the technique for particle sizing adapted in this thesis relies on vibration induced fluidization, the second part of this chapter briefly reviews the important literature relating to particulate bed behaviour during vibrofluidization.
3.2 Review of existing methods for particle size distribution
analysis
3.2.1 Sieving
Sieving which is the easiest, cheapest and probably the oldest method for powder sizing, is applicable to liquid suspensions (wet analysis) as well as for analysis of dry powders. In this technique, a number of sieves with
different standard meshes are nested one on top of another in a descending order with the largest aperture size sieve on the top. The stack forms a cylinder which normally sits on a pan called receiver. Agitation results in an increase in sieving efficiency (Jelinek 1974 , Allen 1990).
According to Jelinek (1974), the sieve apertures are classified as coarse (4 to 100 mm), medium (0.2 to 4 mm) and fine (less than 0.2 mm), which are mainly woven wire or punched plate sieves. Fine sieves below 0.04 mm or micromesh sieves, however, are manufactured electrolytically from perforated metal foils. The weight of the sample depends on the density of test particles; a powder mass of 20 to 60 g of fine particles and 60 to 150 g of coarse ones are recommended for a sieve of 20 cm diameter. Sieve size is based on the median average of the particle sizes on the central sieve. The successive sieve size on the top, (a^) is defined in terms of immediate sieve size below (a^-i) in an array given by (Jelinek
1974) :
(3.1)
The appropriate sieving time, however, is on the basis of different recommendations. BS 1796: Part 1: (1989) suggests that the sieving classification should be continued until less than 0.1% of the mass of the charge passes through in any 1 minute of the sieving process. In general 20 minutes sieve classification time is sufficient for a successful dry analysis. According to Allen (1990) air jets have been employed to speed up the process. This in particular, is suitable for an on-line size analysis when there is inevitably a risk of blinding the apertures. The air drawn upwards and a negative pressure from the bottom of the sieves gently removes fine particles from the device. Fine particles are likely to be
Chapter 3 Literature survey on particle size measurement
aggregated during the process and the effect of this problem can be reduced by vibration and if necessary by adding 1% dispersant such as fine silica or stearic acid.
According to Allen (1990) wet sieving is recommended for particles size classification of less than 15 pm . It is also an alternative solution to aggregation problems. The sieve set is normally filled up with a suitable liquid phase in which the fine particles are suspended. The process is completed with aid of rinsing, vibration vacuum, ultrasonics or a combination.
The main problems associated with sieving are blinding and damage to the apertures due to vibration. Also, different particle shapes and surface patterns may result in analytical errors due to specific geometries or cohesive forces respectively. Prolonged test runs is also a disadvantage specifically as an on-line particle size analyzer.
3.2.2 Optical methods
3.2.2.1 Microscopy
Microscopy relies on statistical estimations following direct observation of a part of the field of view . The resolution of a microscope, d* is defined by (Jelinek 1974 , Allen 1990) :
* d =
2n.sin(i) (3.2)
where, A is the wavelength of the light used (pm), n is the refractive index of the immersion medium, and (f) is the angular aperture. The term
nsin<l) is called the numerical aperture and has a maximum value of 0.95 . The optical microscope is applicable from 0.8 - 150 pm particle size range. With electron microscopes however, particle size observation and counting down to 0.001 pm is possible (Silverman et al. 1971).
Figure 3.1 shows the main features of a microscope and lamp which consists of microscope, microscope lamp and filters, objectives, eyepiece, substage condenser, graticule and stage micrometer (BS 3406: part 4: 1963). Figure 3.2 represents a grid that is used for particle size measurement. The grid may be employed either during testing by locating at the rear focal plane of the eyepiece or afterwards using a microphotographie procedure (Jelinek 1974).
According to Snowsill (1985) particle size distribution data are obtained by counting the number of particles in each individual size class of all the fields. In an automatic microscope size analyser however, particle size distribution data are generated by scanning the object field. These data are then analysed using a computer.
According to Allen (1990) and Jelinek (1974) microscopy is considered to be the most illustrative and sensitive method of size analysis which is not only used as an absolute particle size analyser, but also for the study of the shape , surface structure and colour of particles. There are three main limitations associated with microscopy. These include 'the resolution of image', 'the size of the field of view' and 'the height of the object under observation'. The latter is a function of the depth of focus. In addition, proper sample preparation requires skilled operators (Snowsill 1985).
Chapter 3 Literature s u n e y on particle size measurement
-, \ P n m a rv im aqe o( o b ie c t \ \ a n o laTio m s at field
f 4 sto B c t e y e p ie c e
Im ag e of suo s ta g e a n o lamo l i i a m e ~ . ^ a t e y e o o m r
a i s q / a t a s e r t u r e / oD iec iiv e /
Image of lamo a IS/
obiea
m ag e of \ fila m e n t o n s u e s t a g e in s
M i rro r
E Y E P IE C E S P O S I T IV E N EG A TIV E Eye le n s
F ield le n s E y e p o m i E y ep ie ce o ra tic u ie Field s to p E y e p i e c e
F ield s t o p ano e y e p ie c e D raw tu o e g ra tic u ie B o d y t u b e
C o a r s e f o c u s a d ju s tm e n t
E y e le n s S e y e p ie c e a r a tic u ie -rie id s t o p F ield lens
Lam p filam en t f o c u s a d ju s tm e n t | B a c k fo c a i p la n e of o b j e c t i v e ' O b je c tiv e L am p c o n d e n s e r i S p ecim en L a r re i n s I ' C % e n s e - ^laporagm , S u p s t a g e c e n trin g m o u n t \ •Sub s t a g e c o o o e m e r diaphragnv S u b s t a g e fo c u s a d ju s tm e n t I
:5 0 m m
filam ent c e n t r i n g
Fig. S. MicnHcapc and lamp
Figure 3.1 Microscope and lamp (BS 3406: part 4: 1963).
O s 0 4 O3 O2 0|
C lasses counted:
7 - 6
6 - 5
5 - 4
Classes not counted:
smaller than 4 1 1
Figure 3.2 Microscopic method: Field of counting for particle size analysis (BS 3406: part 4: 1963).
3.2.2.2 Light interaction
Light interaction techniques are based on suspending test particles in a transparent fluid with a refractive index different from that of the particles, and relating the reflection, diffraction and (or) refraction of a light beam passing through a defined volume of the fluid to the particle size. Light extinction and light scattering are the two techniques based on this principle. In the former technique, the reduction of light caused by interruption is detected (BS 3406: Part 7: 1988).
Particle size analysis using light scattering is based on Rayleigh's work in the nineteenth century. The size, s of mono-dispersed particles following light scattered at a very small angle, 0 is given by (Jelinek 1974) :
KC
m' N 1 +
lÔTT^S^ s i n ^ ( y )
0 0 3X (3.3)
where, K is defined as :
27T^n ^ dn
K = V
(3.4)
m ' = ^
(0) (3.5)
where, C is particle concentration in g /ml, Rq the reduced intensity of
scattering for incident unpolarized light at a scattering angle, 0 . N is the Avogadro constant, X is the wavelength of the applied light in the medium, n represents the refractive index of the medium, n* is the
Chapter 3 Literature survey on particle size measurement
refractive index of the system, m is the particle mass and P(0) , particle scattering factor.
The above equations show that particle size is a complex function of its shape, light source, refractive index of the particles and the dispersion fluid. A proper response from the system therefore, requires calibration of the apparatus before any size analysis.
According to Jelinek (1974), when the direction of the light is perpendicular to the axis passing through the particles, the scattered light will not be symmetrical. The technique based on this principle is known as dissymmetry and is applicable for determination of particle sizes in the range of wavelength of the incident light (0.1 - 0.6X).
Light scattering methods can also be employed for suspended particles in a gas for example aerosols and airborne particulate contamination in atmosphere (Allen 1990). In practice, the lower particle size limit for detection when using white light and a laser beam are 0.3 pm and 0.1 pm respectively. The upper size is limited by the sensitivity of the optical device (BS 3406: Part 7: 1988). In addition, the diffraction pattern is not affected by the position of particles relative to the axis of the lens. In this way, particle size analysis is independent of the motion of particles and their velocities (Snowsill 1985)
According to BS 3406: Part 7: (1988) there are three basic versions of light scattering method. These are near forward scatter, right angle scatter and wide angle scatter. Figure 3.3 is a schematic representation of a wide angle scattering technique. Right angle scatter in comparison with the other two methods is very sensitive to the minute changes in particle
Fluid
flow Particles
Aperture Light Aperture
source \ i
Light trap
V
o oLens Lens
Photo-detector
Figure 3.3 A schematic representation of wide angle scattering technique with optical configuration (BS 3406: part 7: 1988).
Chapter 3 Literature survey on particle size measurement
size. However, it is strongly affected by the particle's refractive index and is therefore unsuitable for mixed aerosols tests. Near forward light scattering on the other hand can produce similar responses from more than one particle size.
Naqwi et al. (1991) developed a method for simultaneous measurements of particle size, velocity and refractive index based on phase-Doppler technique. In a mobile phase with particles moving along the main direction of flow, there are two scattered waves indicated by the detector. One wave has a higher Doppler-shifted frequency compared with another one. This effect can be used to characterize particles in the flow. By means of using an additional detector in a phase Doppler system it is possible to distinguish between the reflecting particles from refracting ones.
An incorrect measurement of refractive index using light scattering techniques can give rise to as much as a 10% error in the measurement of particle size distribution (Zhang and Xu 1992).
Light scattering techniques using laser beams to characterize particles have Gaussian intensity distribution. That is to say, signals scattered from a small particle passing through the field centre can be considered identical to that of a large particle passing through a low intensity region in the field. Xie et al. (1991) developed a novel overlapping optical field technique that transforms an optical field with typical Gaussian intensity into one with uniform intensity distribution.
Light scattering is very accurate, fast and there is no risk of aggregation during the test. Besides, the sample required for each test is very small.
However, the suspension medium in which the particles are tested should be selected carefully so as to avoid any likely effects on testing particles. Saturation of fluid view by particles results in an experimental error. Light interaction methods require sample preparation prior to size analysis. In addition, all particle counters are affected by electrical noise (BS 3406: part 7: 1988).
3.2.3 Gravitational methods
3.2.3.1 Sedimentation
Sedimentation techniques are based on determining the size of particles from their rate of sedimentation at terminal velocity in a known fluid. BS 3406: part 2: (1984) recommends that the sample may be introduced as a thin layer on top of a column of clear fluid or uniformly dispersed in the fluid. Sedimentation methods are classified as either ’cumulative' or 'incremental'.
Cumulative methods for size analysis are used in conjunction with sedimentation balances. Particle size and its distribution can be found from the rate at which the particles settle out of suspension. This method is suitable for direct mass distribution analysis with only small amounts of sample. The size determination range is 1 - 75 pm.(BS 3406: part 2: 1984) Incremental sedimentation is based on changes in concentration or density of the suspension at a given depth as time varies. Particle size distribution is then determined by measuring concentration at different depths (Allen 1990). According to Bunville (1984).micromeritics sedigraphs are probably the most widely used instruments in
Chapter 3 Literature survey on particle size measurement
sedimentation. Using soft X-ray or white light, particles in the 0.1 - 100 pm size range may be analysed.
Simons and Williams (1992) reported a non-invasive dielectric sensors for particle size measurement in solid/liquid systems. The technique relies on the changes in population of particles between a pair of capacitance sensing electrodes. As a result, the effective dielectric constant or permittivity of the suspension varies. The changes in the measured capacitance therefore, can be related to solid concentration at a given time. The methodology of the capacitance measurement technique is similar to that of.X-ray sedigraph. They both operate in dilute suspensions (ie. <1% v/v). The settling rate of particles at their stokes velocity can be related to the particle size distribution.
The capacitance method is however limited to low conductivity media and requires calibration. Since the particle size is based on Stokes diameter and by definition is related to particle and fluid physical properties, particle size analysis using sedimentation is not straightforward (Hostomsky et al. 1986). Also, the sedimentation process suffers from various effects such as interference between the particles themselves. In addition, the sedimentation rate for high concentration of solids is unacceptably slow. (Jelinek 1974).
3.2.3.2 Centrifugal method
Centrifugal techniques for particle size analysis are suitable for particles below 5 pm (Allen 1990). According to Stokes' law, particle size can be calculated from the settling velocity given by (BS 3406: part 6: 1985) :
i8n dD
---
X---( c y - p ) t o ^ D
(3.6)
where, dst is the Stokes diameter, r| is the absolute viscosity of fluid, o is the immersed density of particle, p is the density of fluid, D is the distance of the particle from the axis of rotation of the centrifuge bowl, t is time, dD/dt is the settling velocity of the particle, (O is the speed of rotation of the centrifuge in rad/s .
Allen (1990) reports that size distribution analysis by centrifugal method is more difficult as compared to those using gravitational techniques. This is due to the fact that the velocity of a particle depends not only on its size, but also on its position in the sedimenting suspension. One solution to this problem is to use a long-arm centrifuge so as to make the centrifugal force uniform on all particles. Another solution is to use the line start technique by which all the particles of the same size can be located at the same rotational radius, and hence have the same velocity.
BS 3406: part 6: (1985) recommends that the upper size limit using this method depends on the reliability of analysis in the first minute of measurement. In general, the upper size varies between 2 - 5 pm. The lower limit however, is controlled by experimental conditions such as the absence of vibration and constant temperature. Under controlled conditions, 0.075 pm is given as the lower size limit.
Recent work on the development of a centrifugal technique reported by Devon et al. (1991) includes the analysis of particle size distribution using a disk centrifuge equipped with an optical detector. This instrument operates over a the range 0.01 - 50 pm based on Stokes law. Ortlepp and Panke (1991) on the other hand, used a multiplexer and video system to
Chapter 3 Literature survey on particle size measurement
determine particle size and molecular mass distributions by an analytical ultracentrifugation. Hoffman (1991) developed an improved technique for particle size measurement using the line start technique. The machine is designed to measure particle size by sedimenting granules from a uniform dispersion in a small cuvette cell. Particle sizes in the range 0.1 - 40 pm may be reported using this technique.
BS 3406: part 6: (1985) recommends that particle size distribution analysis using centrifugal techniques should be expressed in terms of frequency distribution which in turn depends on the technique of operation. There are two main techniques available for calculation of such data. These include incremental technique using a line start and incremental technique with homogeneous suspension.
In summary, centrifugal method overcome problems such as prolonged settling time or the effect of convection and Brownian motion that would otherwise occur during gravitational sedimentation analysis of fine particles. In addition, there is no risk of disturbing the suspension in centrifugal sedimentation. However, like gravitational sedimentation, this method is subjected to different effects such as : ’concentration of the suspended phase’, ’salvation', 'particle shape' and 'the electroviscosity' (Jelinek 1974).
3.2,4 The electrical sensing zone method
The electrical sensing zone method is mainly used in biological research and for the size analysis of environmental pollutants (BS 3406: part 5: 1983). Figure 3.4 represents a schematic diagram of the device. The technique is based on size analysis of suspended particles at low
numiiii
Figure 3.4 Schematic diagram of electrical sensing zone method showing; manometer contacts (1), mercury manometer (2), aperture (3), stirred suspension (4), which is isolated by tap (5). The signals detected by the electrodes (6) are amplified by a main amplifier (7) and then fed into threshold circuit (8), pulse amplifier (9), and counter driver (10). The analytical results are obtained by digital register (11). The electrical signals are also displayed on scope (12) which is connected to a horizontal sweep (13). The suspension discharged by vacuum (14). The counter driver is connected to the manometer by counter start/stop (15).(BS 3406: part 5: 1983)
Chapter 3 Literature survey on particle size measurement
concentration in an electrolyte solution. A precisely controlled volume of the well agitated electrolyte is passed through an orifice with an electrode on either side. The amplitude of the voltage pulse changes as particles pass through the orifice which is in turn proportional to the volume of particle. The electrical signal is then amplified and expressed in terms of particle size (Allen 1990).
Size analysis using the electrical sensing zone technique is independent of particle density, shape and conductivity. Particles in the range 0.6 - 250 jum may be analysed. Particles smaller than 0.6 pm may be lost in the electrical noise of the system. Also, the maximum particle size that may be analyzed is limited by the size of the orifice; the orifice diameter must be at least twice the size of the largest particle. In addition, particles have to be dispersed in an electrolyte and the dispersion must be maintained uniform. Also, dilute suspensions must be used (BS 3406: part 5: 1983). In order to reduce coincident particle passage through the orifice and samples containing wide range of size distribution must be wet sieved prior to analysis. Bubble formations is also a serious drawback as it may lead to a false signal (Snowsill 1985 , Silverman et al. 1971).
3.2.5 Elutriation method
Elutriation is based on the analysis of proportion of particles carried off by a carrier gas at the particle's terminal velocity from a vertical column (BS 3406: part 3: 1963). Unless there is a chemical interaction between the carrier gas and particles or column, air as a supply gas is always perferred. Also the viscosity and density of the carrier gas should be appropriate to the operating temperature and pressure. The gas should be clean and dry with an inlet pressure in the range 0.3 -1 .0 kg/cm^ . The
largest size of elutriated particle is calculated from Stokes's law as given by (BS 3406: part 3: 1963) :
(3.7)
where, dst is Stokes diameter of the particle (pm), r\ is absolute viscosity of gas in (poises), p is gas density (g7cm^), a is apparent density of particle (g /cm^), g is acceleration due to gravity (cm/s^), and v is free falling velocity of particle (cm/s). The above equation is valid for Reynolds number less than 2000. The minimum value of the linear gas velocity for a successful size measurement of a particle should be equal to its free falling velocity, v .
Two of the main air elutriators are down-blast and circulating types. Figure 3.5 shows schematically, a down-blast elutriator. The unit comprises multi-stage élutriation through columns of different diameters arranged in a descending order. Air flow passing through columns in sequence causes fine particles to be shifted and accumulated from a previous column on to the top of the next one. Stage by stage increase of the gas flow rate produces data on size distribution analysis.
The circulating type elutriator on the other hand is a single stage elutriator applicable for powders in the range of 5 - 75 pm which can not be processed in down-blast elutriators. In this case, the test powder is placed in a U-tube located at the bottom of the apparatus and air is blown into the system through the U-tube. The use of different thimble filters at the top of the device allows the collection of various size particles.
Chapter 3 Literature su n ey on particle size measurement
B
y
ÏFigure 3.5 Schematic diagram of a down-blast air elutriator with three tubes : A , B and C (the diameters varies in a descending order) The air is blown by a blower (1) into a gas cleaning system (2) and its pressure is monitored by a rotameter (3). The air enters into the smaller tube (4) and leaves fine dust inside a glass bell-jar (5). The air stream is then discharged by top attachment (6) and is blown to the next tube from the bottom. Powders are collected in a powder container (7) which is connected to a conical adaptor (8). (Allen 1990)
Water and air elutriators are both available. For powders in the range of 10 - 200 pm size range and with densities greater than 2.0 g Icrr? water elutriators are recommended (Allen 1990). The major problem associated with air elutriators is the adherence of fine particles to the walls and the breaking up of aggregated particles. Also, the technique is in general very time consuming.
3.2.6 Sonic method
When particles suspended in air are exposed to an intensive sound wave, they tend to vibrate. Cadle (1955) showed that the amplitude of vibration decreases with increasing particle size. The frequency of vibration varies from 65 to 1500 Hz. The sound source is a 7 W permanent magnet loud speaker. The ratio of the amplitude, x of vibration of particles to that due to the sound wave, x^ is presented in terms of the particle size derived from Stokes' equation corrected for slip, i.e;
X 1
1
r
47t aNj A /LV
9n 1 + + 1
(3.8)
where, Ni is the frequency of the sound, r is particle radius, L is the mean free path of the air molecules, q is the air viscosity, a the is density of particle and Ai is Cunninggham constant (Cadle 1955). The particles, illuminated by a carbon arc lamp, are photographed through a low-power microscope using a 35 mm camera. This method is applicable for particles larger than 5 pm. The interaction of particles can affect vibration and result in random changes of vibrational amplitude.
Chapter 3 Literature survey on particle size measurement
Hidaka et al. (1990) studied the effect of impact of sound between particles and a circular plate. The authors related such data for prediction of instantaneous particle size and flow rate measurement. The sound pressure is a function of the number of particles colliding with the plate and the particle diameter is proportional to the characteristic frequency of the sound. The intensity of the characteristic frequency component on the other hand, is related to particle size distribution. However, bouncing of particles after impaction produce secondary collision with the plate and hence result in size measurement error.
3.2.7 Pulse method
According to Jelinek (1974), particles when ignited or heated to glowing produce pulses that can be related to their size. More recent pulse-type devices are sensitive to any changes in pressure caused by particles on passing through an acoustic sensor. This in turn is converted into electrical signals the intensity of which may be related to particle size distribution.
Pulse methods are applicable for determination of drop size in immiscible two-phase liquid systems. This method is particularly suitable for continuous-flow size measurement when incorporating automated detecting devices. However, electrical noise in the detection system can produce analytical error.
3.2.8 Adsorption method
When a solid is exposed to a gas, a layer of gas molecules may be adsorbed onto its surface. This phenomenon is known as adsorption. The
amount of gas or adsorbate is in turn directly related to the particle surface area in two different ways; gravimetric method, by which the changes in the mass of the gas source is determined. Alternatively, the changes in the volume of the gas source can be estimated at constant temperature and pressure. This is known as the volumetric method. The most common adsorbate is liquid nitrogen (Allen 1990).
Adsorption methods are particularly useful when a knowledge of the surface area rather than the actual size of particles is required. Direct methods for particle size measurement can only give the equivalent size of the smoothed particles rather than the true surface area (Snowsill 1985).
As many substances are naturally covered by impurities or adsorbates, the adsorption technique requires the clean up or degassing of the solid surface prior to analysis. This step is one of the major limitations of the technique. Adsorption is also affected by ambient pressure and temperature. In addition, the presence of 'dead-spaces' where gas can not be adsorbed is a further drawback (Allen 1990).
3.2.9 Cascade impactor
Snowsill (1985), reports that the cascade impactor operates on the basis of the fact that a flow of air carrying fine particles accelerates on passing through an orifice or a nozzle. The jet faces a flat plate which is placed further down the nozzle. The air stream diverges sharply to the sides whilst fine particles impact on the plate. The design characteristics of the nozzle and its distance to the plate in addition to the air velocity can be related to the size range of particles accumulated on the plate. By using a
Chapter 3 Literature survey on particle size measurement
series of impactors with decreasing nozzle size, a cascade impactor can be set up. Size distribution data in the range of 0.4 pm to 15 pm can be obtained using this method.
Impaction surfaces have to be layered with an adhesive frequently to avoid re-entrainment from one stage to the next (Snowsill 1985 , Silverman et al. 1971). This is a serious disadvantage of this method.
3.2.10 Field flow fractionation
Field Flow Fractionation is based on the effect of a force field perpendicular to a particle stream flowing through a thin open channel. Electric cross-field and hydrodynamic lift forces are two of the most common fields employed in conjunction with this technique. Field flow fractionation is defined as one-phase chromatography with an interacted cross-field (Caldwell 1984 , Barth and Sun 1993).
The test stream carries particles either in the form of suspension or solution. The force due to velocity profile results in fractionation of particles among the streamlines and hence causes particle size elution. Stream velocity is maximum at the centre and is almost zero close to the walls. Therefore, coarser particles closer to the walls are less mobile whereas finer particles which diffuse into higher velocity profiles far from the walls can move faster.
When a splitter device is fitted at the outlet of the stream channel in order to separate higher mobile components from the test powder, a fast analysis can be achieved. This technique is known as SPLITT fractionation
which may in turn be modified to run continuously and rapidly (<1
minute). Fuh et al. (1992) claim that measurement of oversized particles in the range of 5 - 75 pm may be obtained using this technique.
In general, fractionation method is a separation technique for characterization of particles and macromolecules which cover a wide range of size from 1 nm to 100 pm. While applicable for poly-dispersed samples, the technique is particularly suitable to near-monodisperse particles. The detection device is usually chosen as optical detector based on light extinction technique. Fractionation methods however, require a pure solvent or a liquid phase. It is also necessary to calibrate the system
(Benkreira 1990).
3.2.11 Gas cyclones
Cyclones have originally been designed to recover solid particles as a pre collector before a filter. However gas cyclones may also be employed to produce size distribution data. The two important factors in particle size separation and hence analysis are the cyclone diameter and gas flow rate. When more than one cyclone is used, the arrangements can be in the form of either parallel or series arrays (Svarovsky 1983).
Smith and Wilson (1979) have reported that their five-stage cyclone could successfully produce cut sizes in the range 0.32 - 5.4 pm for solids of 1 (g /cm^) density. The series array operated at 28.3 (lit/min) in reverse flow with selected cyclones diameters in the range of 1.5 - 4.47 cm. Yoshida et al. (1991) have recently studied size classification of sub micron powders by air cyclones. Large particles are collected on the upper wall whereas fine particles on the conical wall. Particles with less
Chapter 3 Literature survey on particle size measurement
inertia enter the dust box first and due to the upward velocity component they exit the cyclone.
In gas cyclones, the dust is first collected from each stage including the filter and then is weighed to produce particle size data (Benkreira
1990) . The problem with parallel arrays is that each cyclone is fed by the same sample and the cutting size operation relies on individual cyclones. This problem can be overcome using on-line gas cyclone in series arrangement which is also simpler. However, the associated filter and vacuum pump require routine maintenance. Atmospheric pollution especially in process line is an inevitable drawback of these systems.
3.2.12 X-ray method
In addition to the use of X-ray beams in sedimentation and centrifugal methods discussed earlier. X-ray absorption with two beams has been used as an on-line method for particle size analysis (Allen 1990). The method is based on the fact that only one of the two beams is sensitive to variation in particle size. A comparison between the two beams by a sensor can produce particle size data.
According to Allen (1990), an on-line stream X-ray fluorescence technique consists of two flow cells through which the slurry passes. The turbulent flow causes a mixing of slurry in cells. As a result of X-ray excitation, particles become fluorescent. The emission is measured and related to the particle size .
Materials that are opaque to X-ray are ideal for use in conjunction with this technique. However, such techniques are in general expensive and require special safety precautions due to radiation hazards.
3.3 Conclusion
In this chapter various methods of particle size analysis with different operating principles have been reviewed. Table 3.1 is a summary of the relative merits and disadvantages of the main techniques reviewed. Some of the techniques are not suitable for on-line size distribution measurement. Others are either expensive or require sample preparation prior to size analysis. The majority of particle counters are affected by electrical noise which is a general problem.
Sieving is a time consuming method and involves the risk of blinding and damaging of the apertures.
There are three limitations associated with microscopy; 'the resolution of image', 'the size of the field of view' and 'the height of the object under observation'. Light interaction methods on the other hand suffer from the saturation of fluid view by particles which in turn results in experimental error.
Sedimentation suffers from interference between the particles themselves. Gravitational sedimentation of fine particles less than 5 pm is subjected to convection and brownian motions and hence result in prolonged settling times.
Chapter 3 Literature survey on particle size measurement
Centrifugal methods overcome the above problem but suffer from other effects such as the 'concentration of the suspended phase, salvation, particle shape and electroviscosity.
The electrical sensing zone method is limited by bubble formation which in turn results in false signals. Also samples with wide range of size distribution must be wet sieved prior to test. This is another drawback of this method.
Elutriation is based on the analysis of proportion of particles carried off by a carrier gas at terminal velocity form a vertical column. Difficulties associated with preventing fine particles from adhering to the walls and the breaking up of the aggregated particles are the main limitations associated with this technique.
The impact sound generated following the collision of particles with a circular plate can be related to instantaneous particle size and flow rate. Data on particle size distribution on the other hand, may be obtained from the sound intensity and impact frequency. However, bouncing of particles and hence re-collision with the plate result in size measurement error.
The main drawback of adsorption methods is the necessity for cleaning up of the solid surface prior to particle size analysis. Also, there are some sites on solids known as dead-spaces where gas can not be adsorbed. This results in an error in surface estimation.
The main disadvantage of the cascade impactor is a consequence of the fact that impaction surfaces have to be layered with an adhesive frequently in order to avoid re-entrainment from one stage to the next.
Field flow fractionation is based on the effect of a field perpendicular to the stream of suspension flowing through a thin open channel. The force due to the resulting velocity profile results in fractionation of particles amongst the streamlines and hence causes particle size elution. However, any changes in fluid dynamic properties requires the re-calibration of the system.
Gas cyclones are capable of producing particle size distribution data. However, they are mainly used as dust pre-collectors before filters in solid particulate processes. The use of this method as on-line particle size analyzer is inevitably limited due to pollution problems.