GLIAL CELL LINEAGES
IN TH E DEVELOPING CENTRAL NERVOUS SYSTEM
Wei-Ping Yu
Thesis submitted to the University of London for the degree of Doctor of Philosophy in Neurobiology
MRC Laboratory for Molecular and Cell Biology, Department of Biology,
University College London.
ProQuest Number: 10044462
All rights reserved
INFORMATION TO ALL USERS
The quality of this reproduction is dependent upon the quality of the copy submitted.
In the unlikely event that the author did not send a complete manuscript and there are missing pages, these will be noted. Also, if material had to be removed,
a note will indicate the deletion.
uest.
ProQuest 10044462
Published by ProQuest LLC(2016). Copyright of the Dissertation is held by the Author.
All rights reserved.
This work is protected against unauthorized copying under Title 17, United States Code. Microform Edition © ProQuest LLC.
ProQuest LLC
789 East Eisenhower Parkway P.O. Box 1346
Abstract
Glial cells far outnumber neurons in the central nervous system (CNS), yet relatively little is known about where they originate during development or how they subsequently distribute themselves throughout the CNS. In this Thesis I report the results of in situ hybridization experiments with a probe tor mRNA transcripts encoding the "myelin" protein 2’,3’-cyclic nucleotide 3’-phosphodiesterase (CNP); these experiments strongly suggest that the precursors of oligodendrocytes, the myelinating cells of the CNS, originate at a discrete locus in the ventral ventricular zone of the embryonic day 14 (E l4) rat spinal cord. Similar experiments with a probe to proteolipid protein (PLP) mRNA, another myelin gene product, indicate that this gene is expressed by a different group of neuroepithelial precursors, not necessarily related to the ohgodendrocyte lineage, in the ventral-most ventricular zone abutting the floor plate.
of the oligodendrocyte lineage in Danforth’s Short Tail (Sd) mutant mice, which lack a notochord and floor plate in caudal regions of the spinal cord. I found that, in these mice, oligodendrocyte precursors never appeared at the ventricular surface, supporting the view that the role of the floor plate is to commit proliferating neuroepithelial cells to particular future cell fates.
ACKNOWLEDGMENTS
I would like to thank my supervisor Prof Bill Richardson for his teaching, advice and encouragement during my Ph.D programme, for his patience to criticize and correct this Thesis and for his many kindly personal helps during my stay in England.
I would like to thank all the previous and present members in the lab, Nigel, Ellen, Andy, Caroline, Anita, Hardeep, Georgina and Winfried for their helps in the experiments. In particular, I thank Nigel to teach me the in situ hybridization technique. His suggestions and criticisms on my experiments were very helpful. I thank Ellen to provide me a figure (Fig 3.1) for this Thesis, to read and correct Chapter 2 and figure legends. I also thank Dr. Alan Peterson at Royal Victoria Hospital, McGill University, Montreal, to provide me the opportunity to carry out the Danforth’s explant-culturing experiment in his lab and supplying all the mouse mutant embryos. I would like to thank Rocki for his friendship.
Contents
Abstract 2
Acknowledgements 4
Contents 5
Figure List 11
Abbreviations 14
Chapter One: General Introduction: The Generation of Cell Lineages
in the Central Nervous System of Vertebrates. 17 1.1 A Brief Introduction to Vertebrate Development. 19 1.2 Cell Diversity in the Vertebrate Central Nei*vous System. 22 1.3 Experimental Approaches to Establishing Cell Lineage
Relationships. 23
1.4 Glial Cell Lineages in the Optic Nerve. 27
1.5 Cell Lineages in the Retina. 34
1.6 Cell Lineages in the Cerebral Cortex. 37
1.7 Conclusions. 41
Chapter Two: Materials and Methods 42
2.1 Bacteriology. 44
2.1.1 Bacterial strains. 44
2.1.2 Growth media and agar plates. 44
2.1.3 Storage of bacteria. 45
2.1.4 Preparation of competent bacteria. 45
2.1.4.2 TFB method for fresh competent bacteria. 45 2.1.4.3 Preparation of frozen competent bacteria by
FSB method. 46
2.1.5 Transformation of recombinant plasmids. 46
2.1.5.1 Transformation. 46
2.1.5.2 Preparation of X-gal plates and spreading of
transformed bacteria. 47
2.1.5.3 Spreading the transformed cells on the LB
plates. 47
2.2 Molecular Biology. 47
2.2.1 General methods of DNA/RNA manipulation. 47 2.2.1.1 DNA/RNA participation with ethanol. 47 2.2.1.2 DNA/RNA phenol/chloroform extraction. 48
2.2.1.3 Plasmid mini-prep. 49
2.2.1.4 Plasmid maxi-prep. 49
2.2.1.5 RNA extraction. 50
2.2.1.6 Restriction digestion of DNA. 51
2.2.1.7 Ligation of DNA. 51
2.2.1.8 GeneClean purification of DNA. 52
2.2.1.9 DNA labelling by random priming with
""P-dATP. 52
2.2.1.10 Southern/Northern hybridization of
DNA/RNA. 53
2.2.1.11 Electrophoresis of DNA/RNA. 54
2.2.2 Polymerase chain reaction. 54
2.2.22 First cDNA strand synthesis from RNA by
reverse transcription. 57
2.2.2.3 PCR reaction. 57
2.2.2.4 PCR products purification and cloning. 58 2.2.3 cDNA library amplification and screening. 58 2.2.3.1 cDNA library amplification and storage. 58
2.2.3.2 cDNA library screening. 59
2.2.3.3 Excision of pBlueScript SK(-) plasmid from
lambda ZAPII clones. 60
2.3 Mammalian Cell Culture. 60
2.3.1 Cell culture. 60
2.3.2 Dissociating embryonic rat spinal cord cells. 61
2.3.3 Culture of spinal cord explants. 61
2.4 Cell Biology Methods. 62
2.4.1 In situ hybridization with RNA probes. 62 2.4.1.1 Preparation of glass slides and devices. 62 2.4.1.2 Radioactive RNA probe labelling with
^^S-UTP by in vitro transcription. 62
2.4.1.3 Preparation and sectioning of tissue. 64 2.4.1.4 Hybridization with radioactive probes and
subsequent washes. 64
2.4.1.5 Coating slides with autoradiographic
emulsion. 66
2.4.1.6 Developing and photography of the
autoradiographic slides. 66
2.4.2 Immunostaining of dissociated spinal cord cells with
2.4.3 Double immunofluorescence staining of cultured cells. 67 2.4.4 ACTH staining of frozen tissue sections. 68 2.4.5 The immunofluorescence staining of cultured explants
of spinal cord. 68
2.4.6 Cos cell transfection. 69
2.4.7 The detection of 6-galactosidase. 69
2.5 Image processing. 70
Chapter Three: Embryonic Expression of Myelin Genes: Evidence for a Focal Source of Oligodendrocyte
Precursors in the Ventricular Zone of the Neural Tube. 71
Introduction 72
Results 74
1. Spatially Restricted Expression of CNP mRNA in the
Embryonic Rat Spinal Cord. 74
2. Embryonic Expression Pattern of PLP/DM-20 Transcripts
in the Spinal Cord. 76
Discussion 7 8
1. Oligodendrocyte Precursors First Arise in the Ventral
Half of the Spinal Cord. 78
2. A Focal Source of Oligodendrocyte Progenitors in the
Ventral Ventricular Zone of the Embryonic Spinal Cord. 79 3. PLP/DM-20 Is Expressed by Unidentified Precursor Cells
in the Ventricular Zone Adjoining the Floor plate in Rat. 81 4. Differences in PLP/DM-20 expression in embryonic rats
and mice. 82
Chapter Four: Specification of the Oligodendrocyte Lineage in the Ventricular 2^ne of the Neural Tube Requires
Signals from the Floor Plate. 91
Introduction 92
Results 94
1. Conservation of PDGFRa expression in the mouse and
rat spinal cords. 94
2. Oligodendrocyte precursors do not appear in regions of
the Sd mouse spinal cord that lack a floor plate. 95 3. Oligodendrocytes are generated in vitro from explants of
the normal spinal cord but not from explants without
an associated floor plate. 97
Discussion 98
1. The emergence of the oligodendrocyte lineage requires
signals from the floor plate. 98
2. Glial cells and neurons are specified by fundamentally
similar mechanisms. 100
Chapter Five: Expression of Fibroblast Growth Factor
Receptor-3 in Putative Astrocyte Precursors in the Late
Embryonic Rat Spinal Cord. 109
Introduction 110
Results 114
1. Cloning of rat FGFR-3 cDNA by RT-PCR. 114
2. The expression pattern of FGFR-3 in the developing
3. FGFR-3-expressing cells in the embryonic spinal cord might be astrocyte precursors and/or newly-differentiated
astrocytes. 117
4. FGFR-3 expression outside the CNS. 118
Discussion 119
1. FGFR-3^ cells in the later embryonic rat spinal cord and brain stem might be the astrocyte progenitors or
newly-differentiated astrocytes. 119
2. FGFR-3 expression outside the CNS. 121
Conclusion 123
Chapter Six: Discussion 131
1. The ventricular zone of the developing spinal cord is
a mosaic of different precursor cells. 132
2. Putative signalling molecules involved in neural tube
patterning. 134
Appendix I. Which subtype(s) of fibroblast growth factor
receptors are expressed by 0-2A progenitor cells? 138 Appendix II. Partial cDNA cloning of zebrafish PDGFRa. 143 Appendix III. Does FGFR-3 play a role in focal adhesion of cells
to the suhstratum? 156
FIGURE LIST
Fig. 3.1 Expression of CNP transcripts in oligodendrocyte
precursor cells. 84
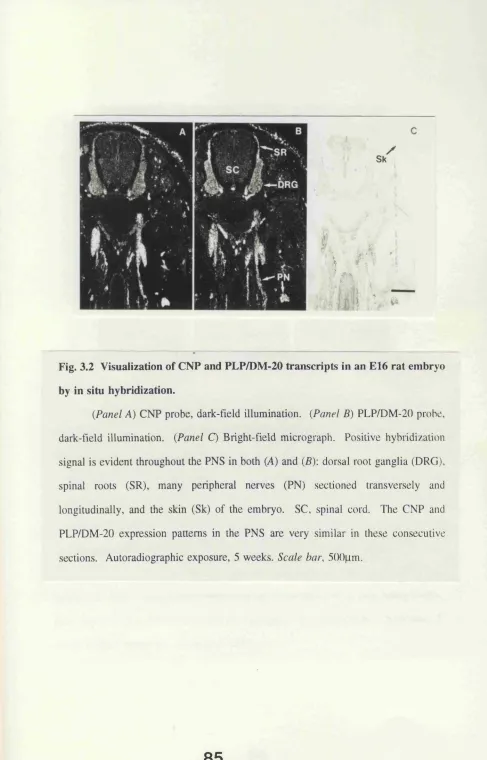
Fig. 3.2 Visualization of CNP and PLP/DM-20 transcripts in
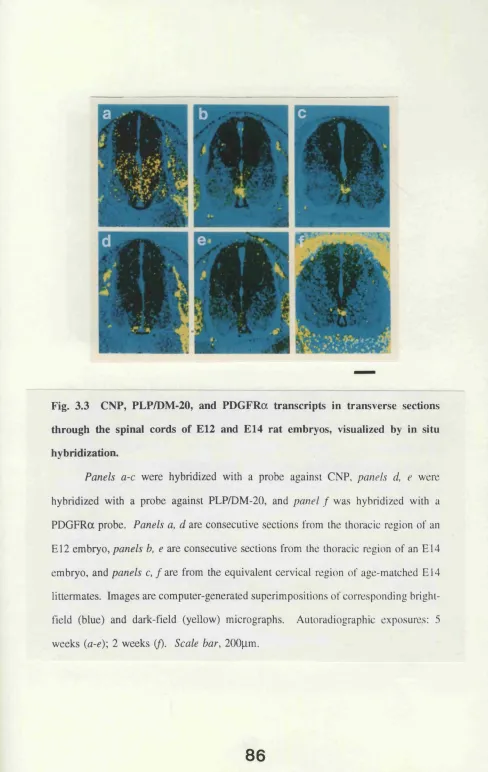
an B16 rat embryo by in situ hybridization. 85 Fig. 3.3 CNP, PLP/DM-20, and PDGFRa transcripts in transverse
sections through the spinal cords of E l2 and E 14 rat
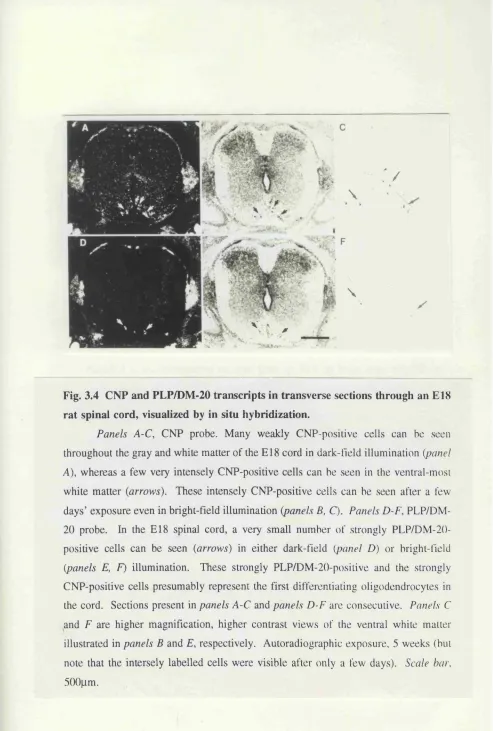
embryos, visualized by in situ hybridization. 86 Fig. 3.4 CNP and PLP/DM-20 transcripts in transverse sections
through an E l 8 rat spinal cord, visualized by in situ
hybridization. 87
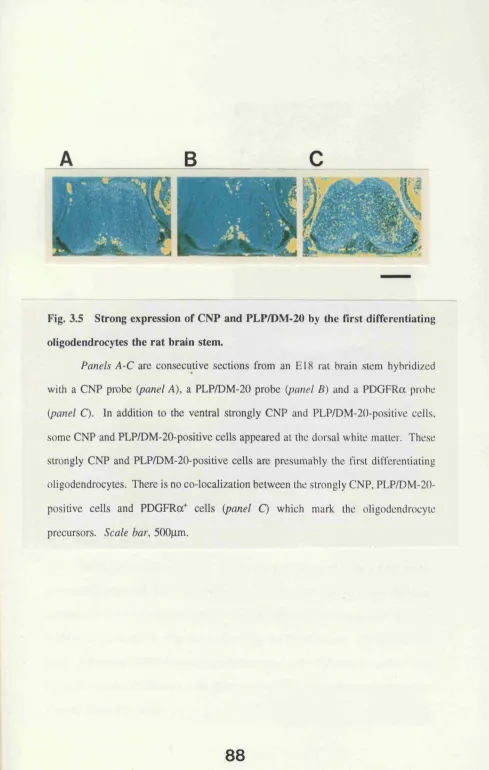
Fig. 3.5 Strong expression of CNP and PLP/DM-20 by the first
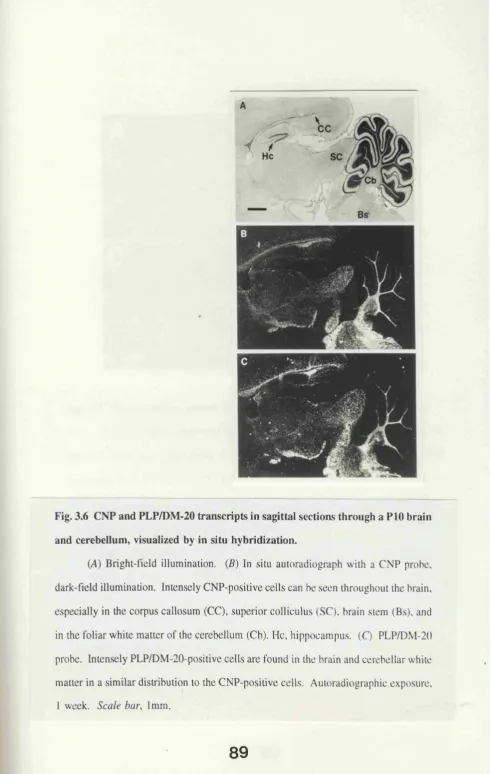
differentiating oligodendrocytes the rat brain stem. 88 Fig. 3.6 CNP and PLP/DM-20 transcripts in sagittal sections
through a PIO brain and cerebellum, visualized by
in situ hybridization. 89
Fig. 3.7 The expression pattern of CNP is different between
mouse and rat. 90
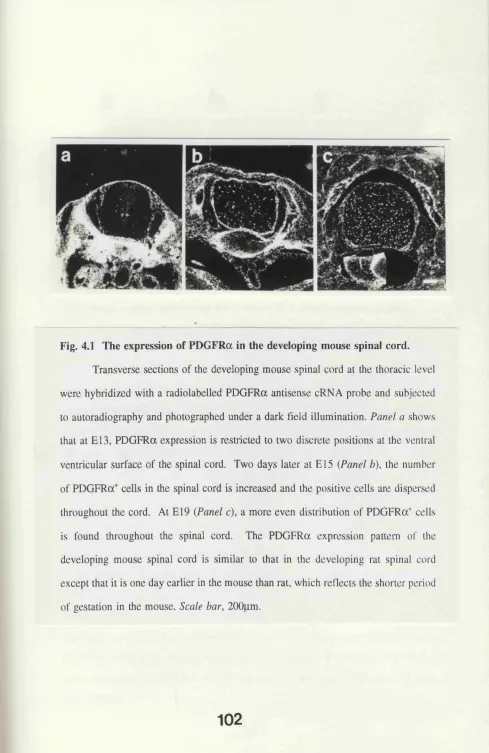
Fig. 4.1 The expression of PDGFRa in the developing mouse
spinal cord. 102
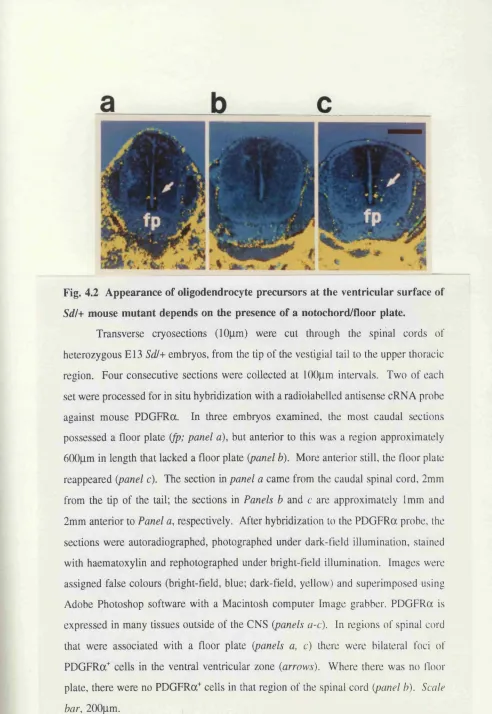
Fig. 4.2 Appearance of oligodendrocyte precursors at the ventricular surface of Sdl+ mouse mutant depends
on the presence of a notochord/floor plate. 103 Fig. 4.3 Acetylcholinestase assay for floor plate cells and
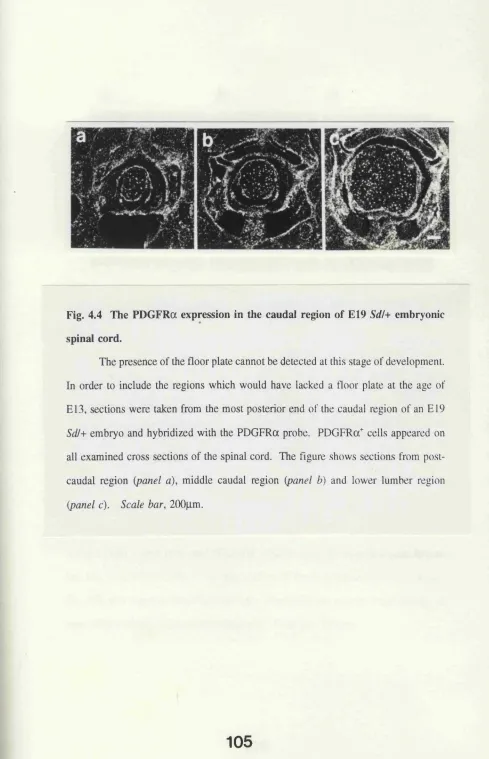
Fig. 4.4 The PDGFRa expression in the caudal region of
E19 Sd!+ embryonic spinal cord. 105
Fig. 4.5 Oligodendrocyte progenitor cells invade floor plate-less regions of Sd!+ spinal cord by longitudinal migration
from neighbouring regions of normal spinal cord. 106 Fig. 4.6 Dissection of mouse spinal cord for explant culture. 107 Fig. 4.7 Oligodendrocytes do not develop in explant cultures
of Sdl-\- spinal cord in the absence of a floor plate. 108 Fig. 5.1 The PCR amplification of rat FGFR-3 intracellular
domain combined with a restriction endonuclease
digestion with BstXI. 124
Fig. 5.2 Expression of FGFR-3 in the E14 and E16 rat embryo. 125 Fig. 5.3 The FGFR-3^ cells in developing rat spinal cord
(transverse sections). 126
Fig. 5.4 Expression of FGFR-3 in the developing cerebellum. 127 Fig. 5.5 Expression of FGFR-1 and FGFR-2 in the developing
rat spinal cord. 128
Fig. 5.6 Co-locahzation of FGFR-3 singals with GFAP antibody
staining on dissociated embryonic rat spinal cord cells. 129
Fig. 5.7 Expression of FGFR-3 outside the CNS. 130
Fig. A l l Expressions of FGFR-1 and FGFR-2 in the rat
developing optic nerve. 141
Fig. AI-2 PCR amphfication of FGFRs in CG4 cells. 142 Fig. A n i-1 Anti-FGFR-3 antibody staining of dissociated rat
spinal cord astrocytes. 159
Fig. AIII-2 Anti-FGFR-3 antibody staining of Cos cells transfected
Fig. A ni-3 Anti-FGFR-3 antibody stains different cell types. 161 Fig. A ni-4 FGFR-3 expression of different cell types examined
ABBREVIATIONS
aFGF acidic fibroblast growth factor
Amp amplicillin
bFGF basic fibroblast growth factor ESA bovine serum albumin
cDNA complementary DNA
CNP 2’,3’-cyclic nucleotide 3’-phosphodiesterase CNS central nervous system
cyc-1 Cyclops mutant (zebrafish)
DAB 3,3’-diaminobenzidine
DEPC diethylpyrocarbonate
DMEM dulbecco’s modified Eagles medium
DMSG dimethylsulphoxide
DNA deoxyribonucleic acid DRG dorsal root ganglia
DTT dithiothreitol
EDTA ethylenediaminetetraacetic acid disodium salt
E embryonic
PCS fetal calf serum
FGF fibroblast growth factor
FGFR fibroblast growth factor receptor
Fig. figure
FITC fluorescein-iso-thio-cyanate
g gravity (or gram)
GFAP glial fibrillary acidic protein
hum human
1 litre
LB luria broth
MB? myelin basic protein MEM minimal essential medium
mg milligram
min minute
ml millilitre
MOPS 3(N-Morpholino) propanesulphonic acid monosodium salt
mRNA messenger RNA
mus mouse
ntl no tail mutant (zebrafish)
0-2A oligodendrocyte-type 2 astrocyte
P postnatal
PB SA phosphate buffered saline PCR polymerase chain reaction PDGF platelet-derived growth factor
PDGFRa platelet-derived growth factor receptor alpha PDGFR8 platelet-derived growth factor receptor beta PLP proteolipid protein
PNS peripheral nervous system RNA ribonucleic acid
Sd Danforth’s short tail mutant (mouse)
sec second
vz
ventricular zonexps Xenopus
zfh zebrafish
^E> microgram
Chapter One
General Introduction
The Generation of Cell lineages
1.1 A Brief Introduction to Vertebrate Development.
1.2 Cell Diversity in the Vertebrate Central Nervous System.
1.3 Experimental Approaches to Establishing Cell Lineage Relationships. 1.4 Glial Cell Lineages in the Optic Nerve.
1.5 Cell Lineages in the Retina.
1.1 A brief Introduction to Vertebrate Development
The body of an adult multicellular organism contains trillions of cells which, in nearly all cases, are generated from a single cell-the fertilized egg, or zygote-which divides mitotically to produce all the diverse types of cells of the body. The process by which the fertilized egg grows and changes to generate first an embryo, then a neonate and eventually a mature animal is called development. Although a variety of types of animal development exist, almost all of them involve the following four stages.
First there is a series of divisions of the zygote just after fertilization, which are not accompanied by cell growth and consequently give rise to numerous relatively small cells. This process is called cleavage. At the end of cleavage, the small cells form a sphere, called a blastula.
The second stage of animal development is called gastrulation. During this process a variety of dramatic cell movements happen within the blastula. As a result of these cell rearrangements three cell layers are generated. The outer layer, called ectoderm will produce the cells of the epidermis and the nervous system during later development; the inner-most layer, called endoderm., will produce the lining of the digestive tube and its associated organs, e.g. pancreas, liver; the middle layer, called mesoderm, will give rise to several organs (heart, kidney), connective tissues (bone, muscles), the blood cells and some special structures, such as the notochord, which appears transiently during embryonic life.
rearrange themselves to produce the organs. This process is called organogenesis. Organogenesis in vertebrates is initiated when a series of cellular interactions causes the mid-dorsal ectoderm cells to form the neural tube which will give rise to brain and spinal cord, together forming the central nervous system (CNS). Most organs contain cells derived from more than one germ layer.
The fourth stage of animal development is called gameto gene sis. During development, a proportion of cells give rise to germ cells which are the precursors of gametes. Gametes are sex cells which participate in fertilization to create a new individual. The development of gametes is usually not completed until the animal becomes physically mature. At maturity, the gametes may be released and undergo fertilization to begin a new life. Meanwhile, the adult organism undergoes senescence and eventually dies.
peripheral nervous system (PNS). This process, which creates the founders of both CNS and PNS, is called neurulation.
The formation of the neural tube does not occur simultaneously throughout the ectoderm along the anterior-posterior axis of the body. Neurulation in the anterior (head) region is more advanced than the posterior (tail) region. This temporal gradient of neural tube development from anterior-to-posterior persists throughout CNS development. During neurulation, a transient structure called the notochord, is formed from mesoderm underneath the neural tube. This longitudinal cord is believed to play a crucial role in the early definition of neural cell types within the developing neural tube.
1.2 Cell Diversity in the Vertebrate Central Nervous System.
The vertebrate nervous system consists of two parts, a main processing unit, the central nervous system (CNS) which comprises the brain and spinal cord, and the peripheral nervous system (PNS) which consists of nerves and their cell clusters called ganglia.
Differentiated cells in the CNS originate from undifferentiated precursor cells. These immature neuroepithelial precursors are initially located in the ventricular zones (VZs) surrounding the ventricles of the spinal cord and brain, where most mitotic activity is localized. Subsequently, in the brain though not in the spinal cord, the zone of mitotic activity moves away from the ventricular surface to form a deeper germinal region called the subventricular zone (SVZ). The neural precursors that reside within the VZ and SVZ stop dividing at predermined stages of development and give rise to postmitotic, migratory progenitor cells that may or may not be predetermined to differentiate into a particular type of neuron or glial cell. These progenitor cells migrate away from the VZ or SVZ along the processes of radial glia into the developing gray matter of the brain or spinal cord. If we wish to understand how neural precursors "decide" which type of differentiated neural cell to generate, we must first work out how the different mature cell types are related to each other by geneology, in order to know when and where specific developmental choices are made. The elucidation of cell geneologies is known as cell lineage analysis.
For cell lineage studies of vertebrate CNS, several parts of the CNS have advantages because of their structural simplicity and/or accessibility for manipulation. These include optic nerve, retina, olfactory bulb, cerebral cortex and spinal cord. In this review, I concentrate on optic nerve, retina and cerebral cortex. First, I shall introduce several general techniques used in the study of cell lineage.
1.3 Experimental Approaches to Establishing Cell Lineage Relationships.
to study the developmental potential of a precursor in vitro and the factors involved in their proliferation and differentiation, 3) microinjection of fluorescent tracers or infection with retroviral vectors to mark the descendants of a single neural precursor in vivo or in vitro.
Molecular markers for cell lineage.
anti-PDGFRa (Pringle et al 1992; Stallcup, personal communication; Hall and Richardson, unpublished data). These and other markers have been extremely useful for developmental studies of the oligodendrocyte lineage both in vitro (Raff et al 1983, Gard and Pfeiffer 1990) and in vivo (Reynolds and Wilkin 1988, Hardy and Reynolds 1991, Le Vine and Goldman 1988, Pringle et al 1992, Pringle and Richardson 1993).
Clonal analysis of single cells.
In this approach, single cells derived from developing neural tissue are plated in microwells and observed for extended periods of time to determine what cell types develop in the clonal progeny of the original cell. A simpler modification of this approach is to plate cells at very low density in a tissue culture dish, so that individual founder cells and their progeny can be easily distinguished from other cells in the same culture. The main difficulty with this approach is in providing the appropriate culture conditions—including factors required for proliferation, differentiation and survival of the starting cells and their progeny. Often, single cells are cultured in medium previously conditioned by other neural cells, or even on top of a monolayer of live "feeder" cells that have been made mitotically inactive by irradiation. The single cell culture approach is technically difficult and, while it has provided important information about cell lineage, especially in the hemopoietic system, suffers from the drawback that results obtained in vitro eventually need to be confirmed in vivo (Temple and Raff 1985).
Lineage tracing by dye microinjection or retroviral infection.
a cell lineage with an exogeneous marker, which might be a nontoxic high-molecular- weight fluorescent dye or a heritable genetic marker, such as a genetically modified retrovirus. A variety of dyes or enzymes that can generate coloured reaction products, for example, fluorescent dextran or horseradish peroxidase (HRP), have been directly microinjected into progenitor cells and the fate of injected progenitors followed by examining the labelled progeny (Holt et al 1988). This approach is conceptually straightforward, but there are several limitations: 1) The dye needs to be microinjected into individual cells, so the target cells must be easily accessible. Cells either too small in size or buried too deep to be reached by a microelectrode can not be studied by this method. Most frequently, the method has been applied to early development of fish and frogs, of which the fertilized eggs and early developing embryos are very easily accessible. 2) Cells can be damaged by the process of microinjection. 3) During cell proliferation, the injected dyes are gradually diluted and eventually become undetectable. Consequently, long term studies of cell lineage can not be studied by this method.
There are several advantages to the retroviral approach: 1) As they are infectious, the retroviruses need only to be implanted in the general position of the cells under study, avoiding the difficulty of intracellular injection. 2) As the integrated retroviral genome is heritable the gene remains stable and undiluted in daughter cells, which enables a long term studies of cell lineage development in vivo. There are unfortunately, also several disadvantages to this method: 1) The identification of a clone is based on the assumption that clustered cells that express the lacZ gene are clonally related. This assumption has been supported by two observations: First, the number of lacZ-expressing clusters are decreased with the dilution of the injected virus, whereas the number of lacZ-expressing cells in each cluster is not. Second, by injecting a mixture of viruses that containing different reporter genes, it was found that cells in most individual clusters only express one of the reporter genes. 2) Although all the progeny of an infected progenitor presumably carry the retroviral genome, only cells that express lacZ are detected. Since levels of lacZ expression might vary with cell type and site of integration, "false negatives" could always be a problem. 3) As with other retrospective methods, cells that die cannot be visualized and therefore are omitted from the analysis.
1.4 Glial Cell Lineages in the Optic Nerve.
The first glial cells to appear in the nerve during development are astrocytes, which first appear around embryonic day 16 (E l6), while oligodendrocytes first appear on the day of birth (Miller et al 1985).
Optic nerve astrocytes and oligodendrocytes are generated from two separate cell
lineages.
In cultures of dissociated rat optic nerve cells. Raff et al (1983) identified a glial progenitor cell that could give rise to either oligodendrocytes or astrocytes (type-2), according to the composition of the culture medium. In defined medium containing less than 0.5% fetal calf serum (PCS) these bipotential glial progenitors differentiated into GC-positive oligodendrocytes, whereas in 10% PCS they generated type-2 astrocytes. The progenitors were therefore named 0-2A progenitors, a name that has been preserved even though subsequent attempts to identify type-2 astrocytes in the optic nerve in vivo have not been successful (Pulton et al 1992). The other identified class of glial cells in optic nerve cultures are so-called type-1 astrocytes, which develop from their own dedicated progenitor cells and which presumably correspond to those astrocytes that populate the optic nerve in vivo. These various glial cells and their progenitors can be distinguished by reactivity with antibodies; 0-2A progenitors are A2B5‘^/PDGPRa7GPAP-/GC-, oligodendrocytes are GC^, type-2 astrocytes are A2B57GPAP'^ and type-1 astrocytes are A2B57GPAP^.
is the default pathway for 0-2A progenitors when they are deprived of signals from other cells. 0 -2 A progenitors first appear in the rat optic neiwe at E16 (Small et al 1987), but differentiated oligodendrocytes do not appear in the nerve until the day of birth, about 5 days later (Miller et al 1987). The difference in the timing of oligodendrocyte development in vitro and in vivo suggests that the embryonic optic nerve contains a factor(s) that can keep 0-2A progenitor cells dividing and inhibit their differentiation.
We now know that one factor that promotes 0-2A progenitor cell proliferation and inhibits oligodendrocyte differentiation in vivo is PDGF. The evidence can be summarised as follows: First, pure PDGF is a potent mitogen for 0 -2 A progenitors in vitro (Richardson et al 1988, Raff et al 1988, Noble et al 1988) and 0-2A progenitors possess high affinity receptors for PDGF (Hart et al 1989, McKinnon et al 1990, Pringle et al 1992). Second, PDGF, in the presence of IGF-1 or insulin, can reconstitute the normal timing of oligodendrocyte development in embryonic optic nerve cell cultures (Raff et al 1985, Raff et al 1988). Third, PDGF mRNA (Pringle et al 1989, Mudhar et al 1993) and protein (Mudhar et al 1993) can be detected in the perinatal optic nerve at the time 0-2A progenitors are actively proliferating, and protein extracts of optic nerve contain mitogenic activity for 0-2A progenitors, most of which can be neutralized by anti-PDGF antibodies (Raff et al 1988). Fourth, transgenic "knockout" mice that lack a functional PDGF-A gene are severely compromised in the number of oligodendrocytes and oligodendrocyte progenitors that develop in the spinal cord (unpublished results from this laboratory).
1988). 2) PDGF can be detected in astrocyte cell bodies and processes in the optic nerve by immunohistocheraistry (Mudhar et al 1993). Taken together, the evidence strongly suggests that proliferation of 0-2A progenitors and their timely differentiation into oligodendrocytes in the developing optic nerve is controlled by astrocyte-derived PDGF. However, there is also evidence that the axons of retinal ganglion neurons (RGCs) that pass along the nerve are also required for proliferation of 0-2A progenitors (Barres and Raff 1993). Moreover, electrical activity in these axons seems to be necessary for proliferation (Barres and Raff 1993). Retinal ganglion neurons also make PDGF (Mudhar et al 1993), and could conceivably supply PDGF to the optic nerve. However, although PDGF immunoreactivity can be detected in and around the cell bodies of RGCs in the retina, PDGF can not be detected in their distal axons in the optic nerve. One possibility is that electrical activity in RGC axons controls the synthesis or release of PDGF from astrocytes in the nerve (Barres and Raff 1993).
is still not clear.
Neurotrophin-3 by itself can stimulate a small percentage of 0-2A progenitor cells to incorporate BrdU in vitro. However, in combination with PDGF, neurotrophin-3 can both significantly expand the size of 0-2A progenitor cell clones and drive the intrinsic clock that controls oligodendrocyte development in vitro (Barres et al 1994). There is evidence that neurotrophin-3 might be released by type-1 astrocytes in the optic nerve and that 0-2A progenitors possess the neurotrophin-3 receptor, Trk C (Barres et al 1994). Thus, neurotrophin-3 might participate in regulating the normal process of 0-2A progenitor development in vivo. In addition, insulin-like growth factors have been shown to serve as survival factors but not mitogens for 0 -2 A lineage cells (Barres et al 1992).
After 0-2A progenitors have differentiated into oligodendrocytes, they lose their PDGF receptors and become reliant on other factors for their long-term survival. These survival factors include representatives of the CNTF/LIF family, the neurotrophin family, and IGF-1 (Barres et al 1992).
0-2A progenitors are migratory cells during development.
Second, oligodendrocytes or their progenitors, 0-2A cells, have been shown to migrate substantial distances into normal CNS tissue from both CNS transplants in vivo (Lachapelle et al 1984, Gansmuller et al 1986, Baulac et al 1987) and CNS expiants in vitro (Wolf et al 1986). Third, when a segment of quail spinal cord is transplanted into a chick spinal cord at open neural plate stage of development, the graft can be seamlessly incorporated into the host to form a chimeric spinal cord and the bird can develop to hatching; when the area of the graft is examined subsequently, quail oligodendrocytes are found up to 2mm from the graft, demonstrating long-range
migration during "normal" spinal cord development (unpublished results from this laboratory).
Unlike the 0-2A cell lineage, evidence suggests that type-1 astrocytes are generated, directly from the non-migratory neuroepithelial cells of the optic stalk (Temple and Raff 1986, Small et al 1987).
Oligodendrocyte precursors in adult optic nerve.
Unlike neurons, glial cells can be stimulated to proliferate in the adult CNS. For example, astrocytes proliferate in areas subjected to mechanical injury, and new oligodendrocytes can be generated to remyelinate demyelinated axons. Are these newly generated oligodendrocytes generated from the same 0 -2A progenitor cells that
Indeed, slowly dividing oligodendrocyte precursor cells can be isolated from adult optic nerves (Wolswijk and Noble 1989). Comparative studies of 0-2A progenitors from adult and perinatal rat optic nerve reveal that these cells differ from one another in several ways (Wolswijk and Noble 1989), and to reflect this fact the two types of precursorss have been named and 0 -2AP®™'^*“' progenitors,
respectively. The two types of progenitor differ as follows: 1) In culture, 0 -2 A""*"'* progenitors have an unipolar morphology (Wolswijk and Noble 1989), whereas
0 _2ap®™»^‘ progenitors are often bipolar (Temple and Raff 1986). 2) 0 -2
progenitors have a long average cell cycle time of 65 hours in vitro (Wolswijk and Noble 1989) than 0-2AP®"““*^ progenitors for which the average cell cycle time is 18 hours (Raff et al 1983, Noble et al 1988). 3) 0-2A^^"'^ progenitors migrate more slowly in vitro and take longer to differentiate into oligodendrocytes than 0 -2A'’®™'®"''
progenitors do (Wolswijk and Noble 1989, Temple and Raff 1986). 4) 0-2A'*'^“'' progenitors can be labelled with antibodies against vimentin, whereas 0 -2A'^™'^"‘‘
progenitors can not.
0 -2A*“*“‘* progenitors first appear in the optic nerve in small numbers during
the second postnatal week and gradually replace the 0 -2A’’®™'^‘“‘ progenitors as the
dominant progenitor population during the first postnatal month (Wolswijk et al 1990). In culture, single 0-2A*’®"““^ progenitor cells grown in the presence of type-1 astrocytes divide a limited number of times and all of their daughter cells differentiate into oligodendrocytes almost simultaneously (Temple and Raff 1986). However,
0 -2A"‘‘‘“‘^ progenitor cells divide asymmetrically and give rise to both oligodendrocytes
1.5 Cell Lineages in the Retina.
The mature retina is a layered structure containing six major classes of neurons and two types of glial cells, Müller cells and retinal astrocytes. The six major classes of retinal neurons are photoreceptor cells, horizontal cells, bipolar cells, amacrine cells, interplexiform cells and ganglion cells. Some of these can also be classified into different subtypes; for example, photoreceptor neurons can be subdivided into rod and cone photoreceptors according to their different morphologies. All the retinal cells are located in different layers and work together to process and transduce visible signals into the brain via the optic nerve. Apart from retinal astrocytes, which appear to migrate into the retina from the optic nerve head (Watanabe and Raff 1987), all the other types of cell are generated locally from pluripotent retinal precursor cells that reside near the outer surface of the retina (see below).
During early development of the CNS, a ventrolateral portion of diencephalic wall of each side of the brain extends, grows out and finally contacts the inner surface of the ectoderm to form a bilayered structure called optic cup. The cells of the outer layer produce pigment and ultimately become the pigmented retina, while the cells of the inner layer proliferate rapidly and generate the cells of the neural retina (Young 1985, Carter Dawson and La Vail 1979, Blanks and Bok 1977). How are these different populations of cells in the neural retina generated from the proliferating neuroepithelium, the ventricular zone of the developing retina?
significant proportion of cell clones contained two or even three different types of retinal cells (Turner and Cepko 1987). Two-cell-clones were frequent (3%-18% of total) and included clones consisting of a rod photoreceptor cell and a bipolar cell, a rod photoreceptor and an amacrine cell, or a rod photoreceptor and a Müller glial cell. Three-cell-clones appeared less-frequently (0.2%-0.6% of all clones); they included clones containing a rod photoreceptor, a bipolar cell and an amacrine cell, or a rod photoreceptor, a bipolar cell and a Müller glial cell. These results suggest that the postnatal rat retina possesses a common precursor that can give rise to several retinal cell types. Unlike precursors in other parts of the CNS, for example the cerebral cortex (see below), in which it seems that the precursors diversify at an early stage of development (E l6) before they leave the ventricular zone, retinal precursors appear
to be largely uncommitted even after birth.
When a recombinant retroviral vector is injected into an embryonic, rather than postnatal, mouse retina, labelled clones are usually larger and contain more cell types, sometimes even all six major types of cells in the retina (Turner et al 1990). Similar results have been obtained by microinjecting individual developing Xenopus retinal precursors with fluorescent dextran or horseradish peroxidase (Wetts and Fraser 1988, Wetts et al 1989, Holt et al 1988). These investigations have also demonstrated that single progenitor cells can give rise to all major cell types in the frog retina.
number of cell cycles, suggesting that retinal progenitor cells undergo symmetrical divisions and at least some of the resulting daughter cells are mitotic and are themselves able to generate new cells.
differentiate before leaving the retinal ventricular zone. Some in vitro studies also support the idea that cell type determination can occur in postmitotic chicken retinal progenitor cells (Adler and Hatlee 1989). Although some models of retinal precursor differentiation have been proposed (Reh and Tully 1986, Reh 1987, Wetts and Fraser 1988, Wetts et al 1989, Turner et al 1990), whether the future cell fate of retinal precursors is specified before the precursors leave the ventricular zone or is determined by the microenvironment where they begin to differentiate is still uncertain and needs further investigation.
Another feature of retinal cell development is that the progeny of a single retinal precursor cell are always arranged radially in the retina and rarely migrate away from the sector in which they were generated. This might result from the cells leaving the ventricular zone by migrating along the radially-oriented process of Müller glia.
1.6 Cell Lineages in the Cerebral cortex.
undergo such a six-layered stage and are therefore referred to collectively as heterogenetic cortex or allocortex. The hippocampal formation is a component of the limbic system, and the paleocortex, which develops in conjunction with the olfactory system, is closely interconnected with limbic structures.
As mentioned above, most portions of the neocortex have six-layered structures as viewed by several different methods of staining during development. From outside in, the six layers are referred as the molecular layer, the external granular layer, the external pyramidal layer, the internal granular layer, the internal pyramidal layer and the multiform layer. Both vertically and horizontally, the neocortex can be divided into anatomically and functionally distinct areas.
There are two principal neuronal cell types in the neocortex, stellate (or granule) neurons and pyramidal neurons. In addition to neurons, there are also a large number of oligodendrocytes and astrocytes. All the cortical neurons and glial cells are originally derived from the embryonic ventricular zone. A lot of attention has focussed on the genesis of these cortical cell types during development. For example, how many types of precursors are there in the ventricular zone? i.e. is there, as in the retina, a single pluripotent precursor cell that is able to generate all the cortical cell types, or is each type of mature cortical cell generated by its own dedicated class of precursor?
injecting the recombinant retrovirus into E12-E14 mouse brain ventricles to mark telencephalic precursor cells, Luskin et al (1988) found that nearly all individual clones contained either neurons or glial cells, but not both. This result indicated that separate populations of neuroblasts and glioblasts are present in the ventricular zone in E l 2-El 4 mouse, and implies that neuronal and glial lineages have diverged by this time. This result was also confirmed by in vitro studies in which clones consisting solely of either neurons or glial cells were derived from distinct retrovirus-infected precursor cells (Luskin et al 1988).
that these undifferentiated white matter cells differentiate either into oligodendrocytes or astrocytes by P28/29. However, there has been no evidence that both oligodendrocytes and astrocytes can appear in the same cluster. Since 0-2A progenitor cells in the optic nerve and elsewhere can generate both oligodendrocytes and astrocytes, it was suggested that the undifferentiated white matter cells referred to above could the cortical counterparts of optic nerve 0-2A progenitor cells. In addition, a fourth type of clone has been identified. The progenitor that gave rise to these clones are capable of giving rise to both neurons and white matter cells. A later in vitro investigation has suggested that the white matter cells in this group are oligodendrocytes (Grove et al 1993) and the progenitors cell have therefore been called N -0 cells.
Most of these studies suggest that the precursors for distinct cell types in the cerebral cortex have diversified before giving rise to postmitotic progeny that migrate away the ventricular zone, and thus imply that the ventricular and subventricular zones of the brain at this stage of development (E l2/14 in mice and E16 in rat) actually comprise a variety of distinct neural precursors. However, the presence of N-O clones implies the existence of a small population of precursors that still remain bipotential or multipotential at this age. A similar type of bipotential precursor has also been reported in the embryonic telencephalon (Williams et al 1991) and in the hippocampal formation (Grove et al 1992). During neurogenesis, the developmental potential of cells in the ventricular zone undergoes a transition from more general to more restricted. The presence of a small percentage of bipotential precursors at E l6 and
the absence of these cells at the E l8 suggests that the final stages of cell lineage
A further detailed study has demonstrated that neuronal clones can be subdivided into clones containing exclusively pyramidal neurons or nonpyramidal neurons, but not both (Pamavelas et al 1991). Taken together, it seems that the cells that make up the cerebral cortex are generated from precursors in the ventricular zone that, by the onset of neurogenesis, have already diversified and become dedicated to the production of particular subpopulations of neurons, oligodendrocytes or astrocytes. This result implies that, in the cortex, cell lineage rather than the microenvironment where progenitors begin to differentiate might be the crucial factor in determining the fate of cells.
1.7 Conclusions.
Chapter Two
Unless otherwise stated all chemicals and reagents were purchased from BDH Chemicals Ltd., which are Analar grade, or Sigma Chemical Company, which are Molecular Biology Reagent grade.
All restriction endonucleases and other enzymes were purchased from New England Biolabs, Inc., or Promega Ltd.
All radio-chemicals were purchased from Amersham International.
All specialised bacterial media components were purchased from Difco Laboratories Ltd.
All tissue culture media components were obtained from GIBCO BRL Life Technologies Company.
2.1 Bacteriology.
All methods used in this section were taken from Sambrook et al (1989).
2.1.1 Bacterial strains.
For general cloning of PCR products and sub-cloning of recombinant plasmids, the following Escherichia coli (E. coli) strains were used.
JMlOl: (supE thiA (lac-proAB) F ’[traD36 proAB^ lac E lacZAM15]) DH5a: (supE44AlacU169 ((^80 lacZAMlS) hsdT17 recAl endAl
gyrA96 thi-1 relAl)
XL 1-Blue: (supE44 hsdR17 recAl endAl gyrA46 thi relAI lac, F'[proAB^ lacE lacZAMl 5 TnlO(tef)]
2.1.2 Growth media and agar plates.
2.1.3 Storage of bacteria.
For short-term storage bacteria were stored on LB agar plates at 4°C for about two weeks. For long-term storage (over one month) bacteria were cultured to ODj^cun to 0.4-0.8 in LB media. 75% sterile glycerol was added to a final concentration of
15%. This mixture can be stored at -20°C for a few years.
2.1.4 Preparation of competent bacteria. 2.1.4.1 Calcium chloride method.
A single colony from an LB agar plate or 10|il of bacteria in glycerol stored at -20°C were cultured in 5ml of LB media without ampicillin at 37°C overnight. 1 ml of this overnight culture was added to 50ml of LB media without ampicillin in a 500ml of flask. It was shaken vigorously at 37°C until the OD26o,im reached between
0.2-0.4 (it takes about 2-4 hours.) and cooled down on ice for 30min. Bacteria were collected by spinning at 3500rpm, 4°C for lOmin, resuspended in 20ml of ice cold lOOmM CaCl2 (sterilised through a 0.22p.m filter), and left on ice for 30min. Bacteria
were spun again, the pellet was resuspended in 2ml of ice cold lOOmM CaCL and left at 4°C overnight.
2.1.4.2 TFB method for fresh competent bacteria.
TFB (lOmM MES (2-[N-morpholino]ethanesulfonic acid), 45mM MnCU, lOmM CaCl2, lOOmM KCl, and 3mM hexamminecobalt chloride, pH 6.0) was made
50ml of bacteria at OD260mn 0.2-0.4 were collected by spinning at 3500rpm, 4°C
for lOmin. The pellet was resuspended in 20ml of ice cold TFB. Cells were spun again and the pellet was resuspended in 1.6ml of ice cold TFB. 56|il of DMSO (dimethyl sulphoxide) was added. Cells were left on ice for 5min, then 56|l i1of 2.2M
DTT (dithiothreitol, in lOmM potassium acetate pH 7.5) was added. Cells were left on ice for lOmin and another 56)il of DMSO was added. The competent bacteria were left on ice until ready to use.
2.1.4.3 Preparation of frozen competent bacteria by FSB method.
FSB (lOmM potassium acetate, 45mM MnCU, lOmM CaCU, lOOmM KCl, 3mM hexamminecobalt chloride, and 10% glycerol, pH 6.1) was made by mixing IM potassium acetate pH 7.5 with the other chemicals. The final pH value should be between 6.1 and 6.2.
The procedure was the same as the previous one, except FSB was used instead of TFB. Instead of 1.6ml of TFB, 2ml of ice cold FSB was used to resuspend the pellet, and then 70|il of DMSO was added to the cells which were left on ice for 15min. Another 70|il of DMSO was added. Cells were quickly dispensed to chilled eppendorf tubes (50fil each) and immersed in liquid nitrogen. These frozen competent bacteria were stored at -70°C.
2.1.5 Transformation of recombinant plasmids. 2.1.5.1 Transformation.
were used, they are thawed between the fingers, then quickly put on ice. The competent cells were mixed with recombinant plasmid DNA and left on ice for 30min. After addition of 0.8ml of LB media without antibiotics, the cells were heat-shocked at 42°C for exactly 90sec, then incubated at 37°C in a shaker at 225rpm for 1 hour.
2.1.5.2 Preparation of X-gal plates and spreading of transformed bacteria.
To the freshly made LB plates of 82mm diameter with available antibiotics, 35)il of 50mg/ml X-gal in dimethylformamide and lOjil of lOOmM IPTG (isopropyl B-D-thiogalactopyranoside) were spread. Before use the dishes were left at room temperature for 30min to dry.
2.1.5.3 Spreading the transformed cells on the LB plates.
l(K)|il of transformed cells were transferred to an available plate. The cells were spread with a sterile glass rod. The plates were then left at room temperature for 30min. After the liquid had been absorbed, plates were inverted and incubated at 37°C incubator overnight.
2.2 Molecular Biology.
2.2.1 General methods of DNA/RNA manipulation. 2.2.1.1 DNA/RNA participation with ethanol.
15min. The supernatant was aspirated and the pellet was washed with 70% ethanol, air-dried for lOmin, and redissolved in suitable volume of water or TE.
2.2.1.2 DNA/RNA phenol/chloroform extraction. a) Preparation of phenol and chloroform.
Phenol from BDH or BRL was melted in a 6 8°C water bath. After melt, 8-hydroxyquinoline was added to a final concentration of 0.1%. The phenol was then
extracted with an equal volume of 0.5M Tris.Cl pH 8.0, left at room temperature until two phases were clearly separated and the upper water phase was aspirated. Then the phenol was extracted with an equal volume of O.IM Tris.Cl pH 8.0 several times until the pH of phenolic phase was > 7 .5 when checked with pH paper. The water phase was aspirated, 0.1 volume of O.IM Tris.Cl pH8.0 was added and dispensed to 40ml aliquots stored at -20°C. One aliquot was kept at 4°C for routine use.
Chloroform was made by mixing 24 parts of chloroform with 1 part of isoamyl alcohol, and kept in a dark bottle at room temperature.
Water-saturated phenol was made by adding 0.1% 8-hydroxyquinoline, then
extracting the phenol with DEPC-treated water several times, finally layered with 0.1 volume of DEPC-treated water, and kept at 4°C. The water-saturated phenol was used for RNA extraction.
b) Extraction of nucleic acids with phenol and chloroform.
formed, the centrifuged at 12,000g for 30sec. The upper aqueous phase was transferred to a new tube, and another extraction with phenol and chloroform was repeated if necessary. After the final extraction with phenol and chloroform, an equal volume of chloroform was added to the aqueous phase, mixed, and centrifuged at
12,000g for 30sec. The upper aqueous phase was transferred to a new tube.
2.2.1.3 Plasmid mini-prep.
Bacterial colonies were grown in 5ml of media containing 100 fig/ml ampicillin (Amp) at 37° overnight with continuous shaking. 1.5ml were centrifuged at 10,(KX)g for 15sec at room temperature. The pellets were washed with STE (O.IM NaCl, lOmM Tris.Cl pH 8.0 and ImM EDTA pHS.O) once, resuspended in lOOpl of Solution I (50mM glucose, 25mM Tris.Cl pHS.O and lOmM EDTA pHS.O) and left at room temperature for 5min. 200pl of Solution II (0.2N NaOH and 1% SOS, freshly made) were added and mixed by gentle inversion. The mixture was left on ice for a further lOmin to lyse the bacteria. 150|il Solution III (3M KOAc and 2M HOAc pH4.5) was added and mixed by gentle inversion. After incubation on ice for another I5min. The mixture was centrifuged at 10,0()0g, 4°C for 15min. The supernatant was extracted with phenol/chloroform twice, chloroform once, and then precipitated with ethanol. The pellet was washed once with 70% ethanol and dissolved in 30)11 of water. At this stage, the plasmid DNA was ready for subsequent restriction digestion and sequencing.
2.2.1.4 Plasmid maxi-prep.
centrifuge), 4®C for 20min. The pellet was suspended in 10ml of PI buffer (lOOpg/ml RNase A, 50mM Tris.Cl and lOmM EDTA, pH8.0). An equal volume of P2 buffer (0.2N NaOH and 1%SDS, freshly made) was added and mixed by gentle inversion, followed by an incubation at room temperature for 5min. Buffer P3 (3M KO Ac, pH5.5) was added, mixed by gentle inversion, incubated on ice for 20min, and centrifuged at 10,000g for 30min at 4°C. The supernatant was applied to a pre equilibrated (0.75M NaCl, 50 mM MOPS, 15% ethanol and 0.15% Triton X-100, pH7.0) QIAGEN resin column. The column was then washed with 30ml of buffer QC (l.OM NaCl, 50mM MOPS and 15% ethanol, pH7.0). DNA was eluted from the column with 15ml of buffer QF (1.25M NaCl, 50mM Tris.Cl and 15% ethanol, pH8.5). DNA was precipitated with 0.7 volumes of isopropanol and centrifuged at 15,000g for 30min at 4°C. The pellet was washed with 70% ethanol once and resuspended in 200|il water. At this stage, the plasmid DNA was ready for restriction digests, sequencing and transfection.
2.2.1.5 RNA extraction.
DEPC-treated water and extracted with water-saturated phenol/chloroform several times (until no interphase was seen). The aqueous phase was then extracted with chloroform alone and precipitated with ethanol. The RNA pellet was dissolved in DEPC-treated water and quantified by determination of OD260nm- The value of OD26o,un/C)D28o,un should be
1.8-2.0.
2.2.1.6 Restriction digestion of DNA.
Two or three units of appropriate restriction enzyme per microgram of DNA were used for digestion. Four different buffers, supplied by New England Biolabs Inc., were used for different enzymes. NEB buffer 1 contains lOmM Bis Tris Propane- HCl, lOmM MgClj, ImM DTT (pH 7.0 at 25°C). NEB buffer2 contains 10 mM Tris- HCl, lOmM MgClj, 50mM NaCl, ImM DTT (pH 7.9 at 25°C). NEB buffer] contains 50mM Tris-HCl, lOmM MgCl2, lOOmM NaCl, ImM DTT (pH 7.9 at 25°C). NEB
buffer4 contains 20mM Tris-acetate, lOmM magnesium acetate, 50mM potassium acetate, ImM DTT (pH 7.9 at 25°C). Most of restriction digests were carried out at 37°C for over 1 hour. Heating at 65°C for 5min or extraction with phenohchloroform were used for inactivating the enzyme after digestion if necessary.
2.2.1.7 Ligation of DNA.
DNA was ligated to an appropriate vector in Ix ligation buffer (50mM Tris- HCl (pH 7.8), lOmM MgCl2, lOmM dithiothreitol, ImM ATP, 25}ig/ml bovine serum
was stored at -20°C.
2.2.1.8 GeneClean purification of DNA.
To DNA in either aqueous solution or agarose gel, three volumes of 4M Nal solution were added. The tubes were incubated in 55"’C until all the agarose was dissolved. 5|il of "glass beads" from the manufacture Bio 101 per ml DNA solution were added and incubated on ice for 20min. The tubes were centrifuged for lOsec, the glass bead pellet was washed with "new wash" (O.IM NaCl, lOmM Tris.Cl pH 7.5 and ImM EDTA) three times (0.5ml each) and finally resuspended in lOpl of water. DNA was recovered by incubating at 55°C for 3min, then spinning and removing the supernatant. At this stage the DNA can be used for any subsequent treatment directly.
2.2.1.9 DNA labelling by random priming with ^^P-dATP.
Insert template was digested with appropriate restriction enzymes and purified by the GeneClean method. In a 50fil of reaction, the following reagents were added in order: lOpI 5x OLB buffer (250mM Tris.Cl pH8.0, 25mM MgClj, lOmM DTT, IM HEPES pH6.6 and 26 A260 units/ml random hexadeoxyribonucleotides), 2pl of
passes through the colume, while the free nucleotides are retained in the column. The labelled DNA was heated at 95°C for 5min before adding to the hybridization buffer.
2.2.1.10 Southern/Northern hybridization of DNA/RNA.
2.2.1.11 Electrophoresis of DNA/RNA.
DNA was electrophoresed in agarose in TAE (40mM Tris-acetate and ImM EDTA, pH 7.5-7.8). The concentrations of agarose ranged from 0.8 to 2.0% depending on the size of DNA being analysed. The gel was made in IxTAE, ethidium bromide was added to a final concentration of 0.5|ig/ml. lOX DNA loading buffer contained 0.25% w/v bromophenol blue, 0.25% w/v xylene cyanol FF and 25% w/v Ficoll-400. The maximum running voltage was 5V/cm. DNA bands were visualized with an ultra-violet (UV) transilluminator.
RNA was electrophoresed in a formaldehyde agarose gel in MOPS running buffer (20mM MOPS (3-[N-morpholino]propanesulfonic acid) pH 7.0, 8mM sodium acetate and ImM EDTA pH8.0). The appropriate amount of agarose was melted in 3.5 parts of DEPC-treated water, cooled down to 60°C, then 1.1 parts of MOPS running buffer and 1 part of 12.3M formaldehyde solution (37%) was added and the gel poured into a tray. The RNA samples were dissolved in RNA sample buffer (0.5X MOPS running buffer, 6.5% formaldehyde and 50% formamide) and denatured at 65-70°C for 5-lOmin. lOx RNA loading buffer contains 50% glycerol, ImM EDTA (pH 8.0), 0.25% bromophenol blue, and 0.25% xylene cyanol FF. The gel was run at maximum voltage of 3-4 V/cm for a few hours or at a low voltage of 0.5-1 V/cm overnight with the buffer recirculating in the opposite direaction to the RNA.
2.2.2 Polymerase chain reaction.
2.2.2.1 Strategy for designing the PCR primers.
bases and consist of a more or less balanced nucleotide composition. 2) The 3’-end nucleotide should ideally be G or C. 3) For the degeneracy primers, an array of amino acids containing most of the following if possible: W(trp), M(met), N(asn), D(asp), C(cys), Q(gln), E(glu), H(his), K(lys), F(phe), and Y(tyr); R(arg), L(leu) and S(ser) should be avoided. 4) If a restriction site is included at the 5’-end of a primer, an extra three unrelated nucleotides should be added upstream. 5) Sequence similarities between the two primers in a set or within a primer should be compared; no more than five nucleotides should cross-hybridize within them. The follows are primers used in the described work.
P “PpR-A : 5’ attctcgagtcgacCGA(T/C)AA(A/G)GGNAA(T/C)ACNTG 3’
AA sequence: DKGNYTC, underlined: restriction sites for Xhol and Sail
P “Pfr-b : 5’ attgagctctgcagCA(A/G)CCNCA(T/C)AT(T/C/A)CA(A/G)TGG 3’
AA sequence: QPHIQW, underlined: restriction sites for S ad and PstI
pdownpR_c . 5’ tgtgcggccgctctagaCAT(T/C)TTCATCAT(T/C)TCCAT(T/C)TC 3’
AA sequence: EMEMMKM, underlined: restriction sites for Notl and Xbal
p d o w n p R. D . 5’ GGNCC(A/G)(T/C)C(T/C)TGNGT(A/G)CANGC 3’
AA sequence: ACTQDGP
P"Pbek : 5’ttctctgcagGGN(A/C)GNGA(A/G)AA(A/G)GA(A/G)AT(T/C/A)ACNGC 3’ AA sequence: GREKEITA, underlined: restriction site for PstI
pdow„BEK : 5’ taattctagaCACGGTGACCGCCTCCTTGG 3’
P “P fr4-a : 5’ CAGGCCTTCCACGGGGAGAA 3’ AA sequence: QAFHGEN
P “Pf r4-b : 5’ AGCATTCGCTACAGCTATCT 3’
AA sequence: SIRYSYL
pdownFR4_c : 5’ GCTGGTTTGGTCTGGCCGGGAGG 3’ AA sequence: SSRPDQTS
pdownpR4.D . 5’ GGCCCATCAGGGCTGAGATC 3’ AA sequence: DLSPDGP
P “Pfr-INTR : 5’ GAGAAGGACCTGTCGGATCTG 3’
AA sequence: EKDLSDL
pdownpR.ij^TR : 5’ GTCGCGCATCATCATGTACAG 3’ AA sequence: LYMMMRD
pdownpRBLlNKER : 5’ CAGGCATCGAAGGAGTAATCC 3’ AA sequence: MDYSFDAC
P “P a r - c h i : 5’ CAATGAGGTGGTTGACCTGCAGTGGACTTACCC 3’
pdownAR.cHi : 5’ CTGTCTAGATCTTCCTTAGCCCGGATCAG 3’
P “P ar-Z F B : 5’ AATGG(T/C)GACTA(T/C)ATGGA(T/C)ATG 3’
pdowBAR.zFC : 5’ CATGATGTCTCTGGCCAG(A/G)CC(A/G)AA(A/G)TCACA 3’
pdownAR.zFD : 5’ ATGCTCTC(A/G)GG(A/T)GCCATCC 3’
2.2.2.2 First cDNA strand synthesis from RNA by reverse transcription.
10|.ig of total RNA was heated at 70°C with 2.5|ig of random hexadeoxyribonucleotides primers in a volume of 12|il for lOmin and cooled down quickly on ice water. The reaction was set by adding the following reagents in order: 4|il of 5xRT buffer (0.25M Tris.Cl pH8.3, 0.375M KCl and 15mM M gClJ, 2pl of O.IM DTT, l|il of dNTP(10mM each of dATP, dTTP, dGTP and dCTP) and l|il of Moloney murine leukemia virus reverse transcriptase (from BRL) (200 units). The reaction was allowed to proceed at 37°C for one hour and stopped by a subsequent heating at 95°C for 5min. 0.5|il-l|il of the synthesized cDNA were used for each PCR reaction (see below).
2.2.2.3 PCR reaction.
starting the PCR reaction cycles. A PCR cycle consists of 95°C for 30sec, 55°C for 2min and 12°C for 2min. Usually 30 cycles were used in a PCR reaction. After the last cycle was finished, elongation of the PCR products was achieved by incubation for lOmin at 72°C. PCR products were stored at -20°C.
2.2.2.4 PCR products purification and cloning.
An equal volume of chloroform was added to remove the paraffin oil. The aqueous phase (which contains the PCR products) was mixed with three volumes of Nal solution (GeneClean) and purified by the GeneClean method. Then the PCR products were cloned by direct ligation with a TA vector (a vector that has a T overhang at the 3’ end). 25-50ng of purified PCR products were added to 25ng of commercial TA vector with ligase at 16°C overnight. lOng of the ligated PCR products were used for transformation and other subsequent cloning procedures.
2.2.3 cDNA library amplification and screening.
The cDNA library used was a zebrafish cDNA library constmcted from total RNA of a post-somitigenesis (20-28 hours) embryo. The vector was lambda ZAP II. The 3’-end restriction site was Xhol, and the 5’-end restriction site was EcoRI. The primer used for the cDNA synthesis was poly d(A)i2_i8. The size of the library before
amplification was 1.0x10^ of independent plaques, and the mean size of inserts was 1.5kb (the range of inserts checked by PCR was 0.7-2.2kb).
2.2.3.1 cDNA library amplification and storage.
NaCl, 0.5% bacto-yeast extract, 0.1% casamino acids, 0.2% MgS0 ^.7H2 0 and 1.5%
agar) plates (15cm) with host bacterium XL 1-Blue. Each plate contained 1.6x10^ plaques. The infected cultures were incubated at 42°C overnight to prevent the formation of lysogens. The amplified phages were harvested into SM (O.IM NaCl, 50mM Tris.Cl pH7.5, 0.2% MgS0 4.7H2 0 and 0.01%; gelatin) and stored in SM
contained 7% dimethyl sulfoxide and 2-3% chloroform at -80°C.
2.2.3.1 cDNA library screening.
After the amplification, 100}il of the harvested phages in SM were boiled for lOmin and centrifuged for 30sec in a microcentrifuge. 2|il of the supernatant were amplified by PCR with the primers P \r.zfa P*°'^‘ar.zk (see 2.2.2.1). The plate which had the strongest expected PDGFaR band, presumably because it had more PDGFaR positive clones, was selected for the screening.
A total of 1.2x10^ phages (half of the total individual phages of the positive plate) were plated onto two 15cm petri dishes (60,000 phages on each dish). Two duplicate filters were made from each of the plates. The filters were subsequently hybridized with the zebrafish PDGFaR probe (the PCR product). A total of eight positive clones (four on each plate) were found. For each of these positive individual clones, a 2mm diameter agar spot (about 1 0 - 2 0 plaques) of the corresponding area on
2.2.3.3 Excision of pBlueScript SK(-) plasmid from lambda ZAPII clones.
1 0 0|il (about 2x1 0^ phages) of these individual positive recombinant clones
selected at the second round screening were mixed with approximate equal numbers of helper phages (R408, from Strategene) and 200|il of infectious XL 1-Blue. This mixture was incubated at 37°C for 20 min, then 5ml of 2xYT media (1.6% bacto- tryptone, 1% bacto-yeast extract and 0.5% NaCl) were added and incubated for 2.5 hours at the same temperature with continuous shaking. After heating at 70®C for 20 min, the mixture was centrifuged at 4,000g for 15min. 2\i\ of the supernatant, which contained the excised pBlueScript SK(-) plasmid, were used for the transformation. The positive clones were then analysized by restriction digestion and sequencing.
2.3 Mammalian Cell Culture. 2.3.1 Cell culture.
The following cell lines were used in the experiments: Swiss 3T3 (a mouse fibroblast cell line), CG4 (a rat cerebellar 0-2A progenitor cell line), B104 (a rat neuroblastoma cell line), cos (an African green monkey kidney cell, CV-1, transfected with SV40 large T antigen).
Confluent cells were washed with Hank’s solution (400mg/L KCl, 60mg/L KH2PO4, 8g/L NaCl, 47.88mg/L Na2HP0 4, Ig/L D-glucose, llm g/L Phenol Red.Na
and 350mg/L Na2C0 3) three times, then were treated with trypsin at a final