Classification of Vehicle Types in Car Parks using
Computer Vision Techniques
Chadly Marouane
Research & DevelopmentVIRALITY GmbH Rauchstraße 7 81679 Munich, Germany
[email protected]
Lorenz Schauer
Ludwig-Maximilians-Universität München Oettingenstraße 67 80538 München, Germany
[email protected]
Philipp Bauer
Ludwig-Maximilians-Universität München Oettingenstraße 67 80538 München, Germany
[email protected]
ABSTRACT
The growing population of big cities has led to certain issues, such as overloaded car parks. Ubiquitous systems can help to increase the capacity through an efficient usage of exist-ing parkexist-ing slots. In this case, cars are recognized durexist-ing the entrance phases in order to guide them automatically to a proper slot for space-saving reasons. Prior to this step, it is necessary to determine the size of vehicles. In this work, we analyze different methods for vehicle classification and size measurement using the existing hardware of car parks. Computer vision techniques are applied for extracting in-formation out of video streams of existing security cameras. For streams with lower resolution, a method is introduced figuring out width and height of a car with the help of refer-ence objects. For streams with a higher resolution, a second approach is applied using face recognition algorithms and a training database in order to classify car types. Our evalua-tion of a real-life scenario at a major German airport showed a small error deviation of just a few centimeters for the fist method. For the type classification approach, an applicable accuracy of over 80 percent with up to 100 percent in certain cases have been achieved. Given these results, the performed methods show high potentials for a suitable determination of vehicles based on installed security cameras.
Categories and Subject Descriptors
I.4 [Scene Analysis]: Object recognition; I.4 [General]: Image processing software
General Terms
Measurement
Keywords
Face recognition, Vehicle, Classification, Detection, Urban, Computer vision
1.
INTRODUCTION
Up to now, the existing slots in common parking decks are not used adequately. Big slots are occupied by small cars and vice versa. For this reason, the total space of parking decks is not operated efficiently at full capacity. In the near future, an individual allocation of optimal parking slots for each incoming vehicle should be considered. This would not only increase the capacity of the parking deck, but also raise the satisfaction of the customers. For instance, the airport of D¨usseldorf already manages a parking robot for measuring the size of a car and moving it to an adequate and individual slot [8].
In the last decade, various applications have been developed in the field of traffic supervision where objects, e.g. vehicles, are automatically identified on actual video recordings. Due to the following characteristics, they are not adequate for a reliable classification of vehicles at common entrances to parking decks: The used cameras are not perfectly located like in common traffic surveillance, where cameras are fixed straight over each lane, observing the traffic with an opti-mal flat angel. Instead, camera positions of parking decks vary in terms of distance, and perspective to the observed entrance. Obstacles, such as ticket counters, gates, bins, etc., can limit an optimal view over incoming cars. Video surveillance suffers in quality differences caused by using a numerous amount of different cameras mainly from older generation. This leads to variable lighting conditions, which tend to make the determination of vehicle types infeasible.
In order to solve these problems, we present two approaches for a feasible determination of vehicles based on common video recordings of a parking deck:
• The first approach determines the size of a vehicle, rather than its type. It does not require any train-ing phase, and thus, it is adaptable without further preparations.
• The second approach requires a training phase in which recorded cars are labeled according to their type and get stored in a database. Based on these data the types of cars driving into the parking deck are determined using face recognition techniques.
Both methods are implemented and evaluated on a real-life
MOBIQUITOUS 2015, July 22-24, Coimbra, Portugal Copyright © 2015 ICST
setup using video streams from car park entries of a major German airport.
The paper is structured as follows: Section 2 gives a brief overview of related work. In Section 3 the methodology is presented introducing the essential aspects of our approaches in detail. The evaluation of our methodology is described in Section 4, and finally, Section 5 concludes the paper and gives hints on future work.
2.
RELATED WORK
Computer vision algorithms and techniques are used in the field of traffic supervision for many years. Related investi-gations in the field of optical vehicle recognition frequently focus on the detection and tracking of cars, e.g. on mo-torways, such as [9], or [15]. Only a few works analyze inner-urban traffic situations, e.g., [12]. This information is often used for user statistics, traffic jam and crash predic-tions. Some of the used computer vision techniques are also used as basis for our approaches. Vceraraghavan et al. [17] and Hsieh et al.[10] usebackground substraction, in order to separate moving objects from a static background. Varia-tions of this method, e.g., contour tracking or blob track-ing, are commonly used for the detection of vehicles [19]. Furthermore, these methods are established in techniques for automatic license plate recognition, which are frequently applied in access control or road charge systems [6]. How-ever, these techniques only focus on the detection of image sections where the license plate is located. Reliable infor-mation about size or type of vehicles in traffic supervision is not extracted or analyzed, and thus, further investigations are still missing. In common related work, data from traffic supervision is normally used for vehicle counting, or coarse classification of moving objects into cars, trucks, and mo-torcycles. This classification is extended by [12, 5], using 3-D grid models and more categories, e.g., for small trucks, buses, and cars of lower, middle, and upper classes. Such an extended classification is more adequate for car parks lead-ing to a more precise sizlead-ing of incomlead-ing vehicles. However, this approach suffers from different camera perspectives and positions leading to false measurements. Hence, knowledge about the exact camera positions is essential for calibration purposes.
Other approaches using the SURF algorithm [5] are per-formed in order to detect objects on images considering unique feature points. Jank and Turk [11] introduce a method for the determination of vehicle types based on SURF using a training phase with model cars, which are photographed under optimal conditions. The authors reach a correct detec-tion rate of more than 90%. A similar approach is described by Varjas et al. [16], focusing only on image sectors above the license plate. In those sectors, square mapped gradi-ent features (SMG) are determined represgradi-enting clearly the characteristics of a vehicle. This method is extended by Pearce and Pears [14], where a Harris detector is used addi-tionally, in order to extract image features.
However, and to best of our knowledge, none of these works investigates an adequate sizing of vehicles based on video recordings using computer vision technologies. To fill in this gap, a methodology is presented in this work, measuring the size of vehicles driving into a car park. Furthermore, an
ap-proach for the determination of vehicle types on the same video data is presented using face recognition techniques to-gether with a training phase which has not been investigated so far.
3.
METHODOLOGY
In this section, we present two self-contained methods for the determination of a vehicle’s size and it’s type. With the first method, the width and the height of vehicles is measured based on video streams from security cameras. The second method determines the type of vehicles based on training data using the same video material.
3.1
Determination of Vehicle Size
The determination of a vehicle’ size is based on known di-mensions of clear identifiable reference objects, such as the width of the road, or the height of the barrier of a car park entrance. The advantage of this intuitive approach is the rapid deployment of the process, due to the fact that no ex-tensive training phase is needed. Only the size of reference objects must be determined once.
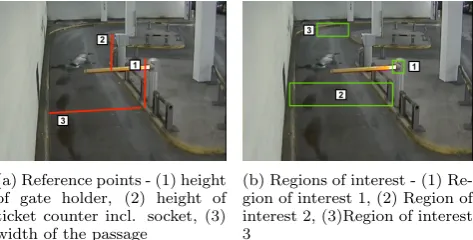
In the following, we focus on the width and the height sepa-rately. The measurement process consists of an initialization phase and an online phase. At initialization, the dimensions of the measured reference objects are registered and a re-gion of interest must be specified and marked on the video image. This is the area in which the barrier is located and the front side of the vehicle is completely visible (Fig. 1a & Fig. 1b). The online phase is the actual main process of the vehicle measurement. It is subdivided into three sub-processes. During the first sub-process the right time to measure the vehicle has to be found. Thereby, the opening of the barrier and the acceleration of the vehicle are impor-tant indicators. In the second part of the process the actual dimensions of the vehicle are determined. Known methods from computer vision such as background subtraction and contour detection are applied [4]. In the third part, a size conversion is performed, transforming the determined pixel width of the video image into real world dimensions. This is done on the basis of registered reference values from the initialization phase.
(a) Reference points - (1) height of gate holder, (2) height of ticket counter incl. socket, (3) width of the passage
(b) Regions of interest - (1) Re-gion of interest 1, (2) ReRe-gion of interest 2, (3)Region of interest 3
Figure 1: Initialization, setting of reference objects - car park entrance (P01 - Airport car park entrance)
Gate Trigger
Vehicles can be recognized by tracking the barrier hinge’s movement with a help of a background subtraction analysis. In the following, this mechanism is referred togate trigger. A region of interest (ROI 1) is defined as the hinge (Fig. 1b). Thereby agate trigger can be produced when a maximum pixel change in the region of interest has been detected over the period of consecutive frames. Subsequently, the estima-tion of the vehicle’s size can be started. In a next step, a further region of interest (ROI 2) is considered, which was previously defined. In this region of interest, a part of the contour of the vehicle is analyzed and used for further cal-culations of it’s width.
Measurement of Height and Width
The width is determined from the contour of the vehicle’s front. The previously defined region of interest (ROI 2) is a partial section of the car park entrance (Fig. 2a). For con-tour finding, this partial section (ROI 2) must be treated with the help of a preprocessing step. The vehicle front is achieved with a background subtraction and creates a grayscale image with a noisy contour (Fig. 2b). With a morphological image operation named closing [7], pixel re-gions are connected and unnecessary noise pixels, caused by flickering of the ceiling light or by mirror effects, are removed (Fig. 2c). To permanently remove large areas of noise from the region of interest (ROI 2), a threshold-based process is performed. Thereby, pixels up to a certain gray level value are completely removed from the image (Fig. 2d).
(a) Region of Interest (ROI 2) (b) Background Substraction
(c) Closing (morphology) (d) Thresholding
Figure 2: Preprocessing before using contour finding process
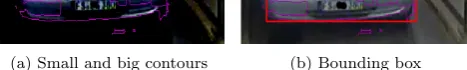
After the image section was sufficiently prepared, the actual contour finding algorithm can be applied. Several contours are found in the region of interest of which the bumper is the largest (Fig. 3a). The bumper generally represents the widest part of the vehicle. The largest contour is determined using a bounding box operation (Fig. 3b). The pixel width of the largest contour indicates the relative width of the vehicle and can be converted using the previously registered reference objects (Fig. 1a).
(a) Small and big contours (b) Bounding box
Figure 3: Contour finding process
Additionally to the width, the presented process also esti-mates the vehicle’s height. Thereby, the gate trigger can be used for starting the process of determining the vehicle’s height. However, another region of interest (ROI 3) must be defined (Fig. 1b). As a reference point, the height of the ticket counter is used to convert the actual height of the ve-hicle. Figure 1a shows that the relevant range now starts at
the height of the ticket counter and takes approximately up to 30-50 % of the road width. The height of the measuring range is sufficient to describe the vehicle’s size. In car park entrances with low camera angles, problems occur when cars drive into the measurement range of currently analyzed cars, as shown by ROI 3 in Fig. 4a. In such cases, it is advisable to move the region of interest to the other side (Fig. 4b).
(a) Region of interest on the right side.
(b) Region of interest on the left side.
Figure 4: The measurement process is disturbed by a car standing in the background. A new position for the region of interest fixes the problem.
The height can be used in combination with the width as an indicator for the accuracy of the vehicle measurement. In contrast, a vehicle’s length was hard to determine, due to the fact that an obstacle-free side view is required. However, such an optimal side views is never given with the used se-curity cameras. The image section is always hidden by the ticket counter and the barriers post, so a measurement of the overall length would only be possible after the vehicle passed all obstacles. Even though, the camera’s field of view never covers the entire vehicle. Due to this fact, a success-ful development of the length determination could not have been realized on the used security cameras.
3.2
Determination of Vehicle Type
Information about the vehicle’s size only does not suffice to determine it’s type. Even an additional recognition of the logo and therefore the determination of the vehicle manufac-turer does not lead to accurate results. Therefore, a method based on training data is rather suitable for determining a vehicle’s type. In the field of machine learning, there are sev-eral methods that can identify recurring patterns or objects. In particular, the field of computer vision offers methods for finding and tracking such object types. A more accurate method is the face detection [18]. It makes it possible to clearly distinguish between different faces, with the support of training data. Like faces, a vehicle has features and char-acteristics, that are present in all vehicle frontal areas (e.g., grille lights, license plate). These features and characteris-tics vary from each other, which makes a clear determination of the vehicle type possible. Through a reliable determina-tion of the vehicle type, specific data (e.g, width, height and length) can be determined from an existing database. So far, such methods were used for general detection of vehi-cles, but not to distinguish between vehicle types. In the following, a method of face recognition for vehicles will be presented, which based on the programmatic foundations of Baggio et al. [2].
the video must be preprocessed. The different phases are presented in the sequel.
Preprocessing
Preprocessing of image data is very important in case of face recognition algorithms. In order to prevent the application of the individual processing steps to the entire video, a re-gion of interest is defined previously. Training data for face recognition algorithms usually consists of portrait images, showing the same face from different angles, while the back-ground is homogeneous. Applied to car park entrances, the selected image region has to cover the vehicle’s front, in order to obtain comparable results. The vehicle’s region of inter-est is rinter-estricted, so that no interference from the back of the screen can be seen. Additionally, the position of the license plate is used, which further limits and reduces the previously selected region of interest. The recognition of the license plate was performed with the aid of a template matching method. The typical European countries blue mark on the left or right edge of the license plate is used as a template. It is the same for all vehicles and it is distinguished signifi-cantly by shape and color gradient from the rest of the vehi-cle. After the detection of the blue mark, the face region of the vehicle can be estimated based on the coordinates of the front license plate. Depending on the camera’s position and it’s angle, the values for estimating the distinct delineated border area must be determined before.
Figure 5 depicts the estimated face region of some vehicles of the same type based on the position of the license plate. There are four different Mercedes E-Class 212, all related to the ticket counter at different angles, and driving in with different speeds from the car park entrance. Despite the different conditions, the image segments are uniformly se-lected. The lack of a Mercedes star on the hood of some vehicles has no negative impact on generating models for template matching. In contrast, the absence of the panel next to the vehicle’s grille, as it is shown for example in Fig. 5c, can have negative impacts. Therefore great care must be taken, while selecting training data in order to exclude such images.
(a) (b)
(c) (d)
Figure 5: Face area of four identical Mercedes E-Class 212. The field of view was well confined and cut.
Training Phase
The training image’s data sets have been compiled from the video material of the car park entrance’s surveillance cam-eras. The passing vehicles were selected and pooled accord-ing to their vehicle types. Before the system can be trained
with data, it must be homogenized. This step is necessary in order to bring different images into a similar format. Strong differences in brightness must be compensated, which is re-alized in two steps. At first, the image is converted to a grayscale image leading to a loss of color information. How-ever, this step has no influence on the vehicle type recog-nition phase. As a second step, the image is subjected to a histogram equalization. The method distributes the gray areas of the image optimally. As a result, the contrast is increased and the gray values, which are very similar and of-ten represented by their gray scale, are projected on a wide range. In contrast, less frequent gray values are reduced to a lower range. Figure 6 shows the comparison between a grayscale image and the equalized version.
(a) Grayscale image (b) Histogram Equalization
Figure 6: Histogram equalization of a grayscale image.
After collecting and preprocessing all of the training images, the corresponding training data set can be created. For the calculation of the training data, we concentrate on of the following methods, which are well-known from the OpenCV library: Eigenfaces, Fischerfaces and local binary patterns histograms [1, 3, 13].
Recognition Phase
4.
EVALUATION
In this section, the proposed methods are evaluated on video recordings from certain entrances of various car parks at a major German airport. The recordings differ in terms of quality, duration, lighting conditions, and the camera posi-tions including the angel of observation. For the evaluation of the first approach, we only use recordings with an im-age resolution higher than 800 x 600, due to the fact, that a lower resolution is not suitable. This requirement is met by the video recordings of car park P01 and P82. They have a duration of about 23 minutes and show nine different vehicles of different classes, such as small cars, vans, SUV, and middle-sized vehicles. The video recordings of P4383 are used for the evaluation of the second approach, due to a longer duration of 240 minutes and the HD quality which is required for a suitable face recognition.
4.1
Determination of Vehicle Size
In the following the evaluation of the vehicle size determi-nation is presented.
Measurement of Width
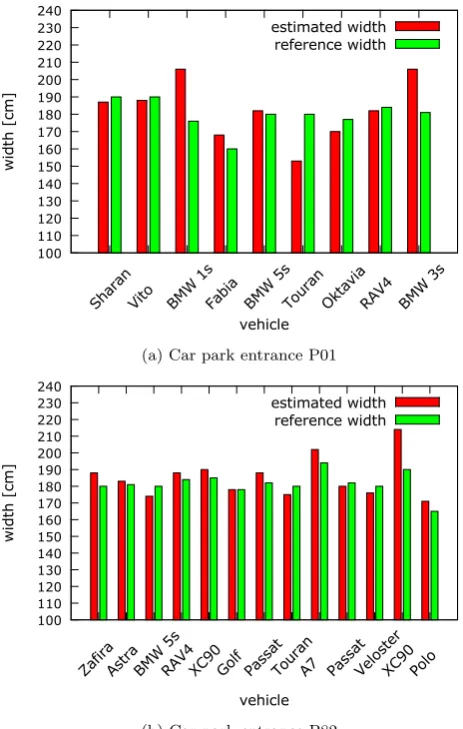
The results of the width measurements with fixed reference line at parking P01 and P82 are shown in Figure 7a and 7b. Each of the listed vehicles passed the parking entrance once. The obtained measurement error at parking P01 shows a mean value of 6.6% and a median of 4.5%, which is an ade-quate result. Removing the outliers from the result set, such as BMW 1s, and BMW 3s, the obtained errors are between 2 and 3 cm. A more precise result is observed at parking P82, with one outlier (Veloster XC90). The observed error has a mean deviation of about 3.2% and a median of 2.7%. The most errors are between 4 and 6 cm. Despite a major distance of the corresponding camera (from 7 till 10 meters) and a ordinary record quality, the width of most passing vehicles is measured correctly with a small deviation.
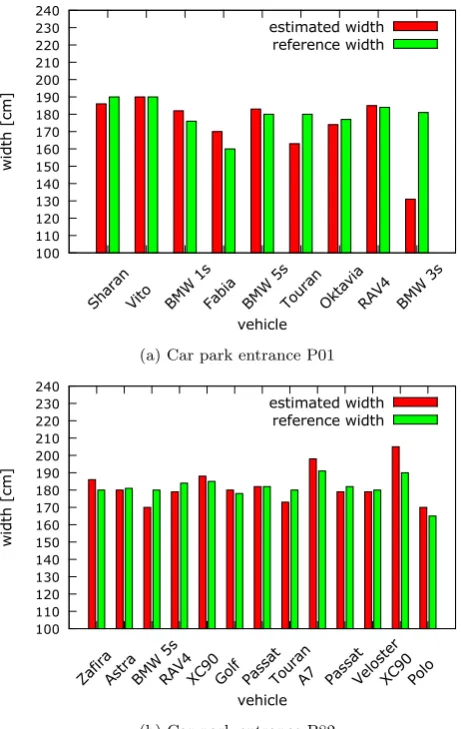
Our investigations have shown that the most errors occurred due to a inappropriate position of the reference line. There-fore, the evaluation is repeated with an extended approach. Beside a fixed reference line, depicted in Figure 1a, a dy-namic reference line is drawn after a vehicle has been recog-nized. Therefore two reference lines must be drawn in the initialization phase, highlighting the outer boundaries of the road course. By detecting the road course a dynamic refer-ence line can now be drawn. When a vehicle is detected, the dynamic reference line will be drawn directly below the bounding box (below the lowest corner point), which is set in the contour finding process (Subsection 3.1). Figure 8a shows clearly that the fixed reference line is too far back from the actual measurement. The error in this case is 17% of the actual vehicle width. The dynamic reference line of this error can be reduced to 3.4% (Fig. 8b).
The measurement error at parking P01 has mean deviation of 5.9% and a median of 2.1%, depicted in Figure 9a. An improvement of this approach is observed at parking P82. The mean deviation and the median is at 2.7%, shown in Figure 9b.
Table 1 shows the results for both methods, indicating that the second approach improves the method with a fixed ref-erence line.
100 110 120 130 140 150 160 170 180 190 200 210 220 230 240
Shar an
Vito BMW 1s
Fabi a
BMW 5s
Tour an
Okta via
RAV4 BMW 3s
w
id
th
[
cm
]
vehicle
estimated width reference width
(a) Car park entrance P01
100 110 120 130 140 150 160 170 180 190 200 210 220 230 240
Zafir a
AstraBMW 5s
RAV4XC90GolfPass at
Tour an
A7 Pass at
Velo ster
XC90Polo
w
id
th
[
cm
]
vehicle
estimated width reference width
(b) Car park entrance P82
Figure 7: Comparison of the measurement and reference values for the width measurement with fixed reference line.
Measurement of Height
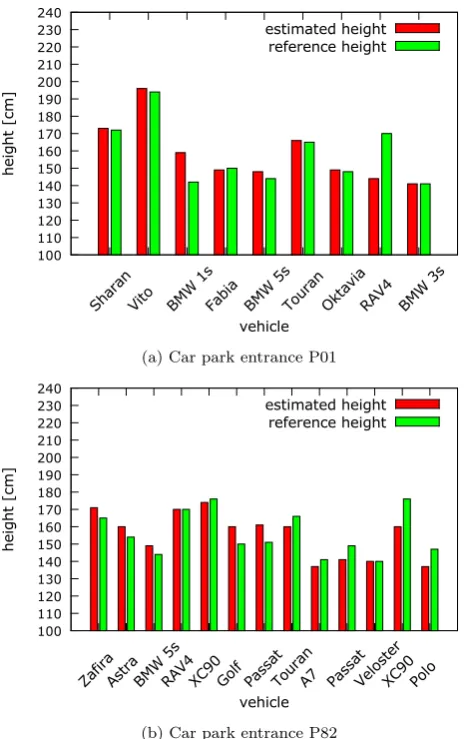
For the evaluation of the height measurement only a fixed reference line is used. The position of the static ticket counter is used as reference for a feasible conversion of the vehicle’s height. The results for the height measurement at parking P01 are depicted in Figure 10a showing a mean deviation of 3.7% and a median of 0.6%. For parking P82 the results show a higher deviation, depicted in Figure 10b. In sum-mary, the measurement results for the height show feasible values with a mean deviation of 4% and a median of 0.6%. Due to the angel of observation of the corresponding cam-eras observing the entrance from above, this high preciseness was not expected at the beginning.
Distribution of Results
(a) Fixed reference line (b) Dynamic reference line
Figure 8: Comparison of the fixed and dynamic reference line. (Red) fixed reference lines, (Green) bounding box from thecontour finding process, (Blue) dynamic reference line.
fixed reference line dynamic reference line
P01 mean 6,6 % 5,9 %
P82 mean 3,2 % 2,7 %
P01 median 4,5 % 2,1 %
P82 median 2,7 % 2,7 %
Table 1: Compare of fixed and dynamic reference line with the deviation in percent from the reference value.
approach. In comparison to these results, the height deter-mination shows the same mean measurement error of 5 cm. Especially in case of parking P01, a small error distribution can be observed, indicated by a flat box which is a good result.
4.2
Determination of Vehicle Type
The approach for the determination of vehicle’s type is eval-uated on video recordings corresponding to parking P4383. The entrance to this car park fits best, due to the fact, that it is particularly frequented by taxis which are usually of the same vehicle type, such as Mercedes Class-E, or BWM 7. Within a duration of 4 hours, 35 vehicle are recorded, driving into P4383. In the following section, the results of the vehicle type recognition are presented.
Detection Rate
The proposed approach was trained on 5 different vehicle types using 4 images per type. The training images were taken from another surveillance camera with a similar cam-era position. The evaluation focuses on the ability of the system for a correct recognition of vehicle types. Further-more, it is evaluated how errors occurring in the preprocess-ing step can be identified and eliminated. Three different face recognition techniques have been applied on the men-tioned dataset: Eigenface, Fisherface, and local binary pat-tern histograms (LBPH). The results of our investigations are depicted in Figure 12. Correct recognitions of vehicles are shown in green and false recognitions in red related to the applied face recognition technique. The blue parts demon-strate erroneous measurements occurred in the preprocess-ing step. In such case the preprocesspreprocess-ing process operates on the wrong image. As previously mentioned (Subsection 3.2), the typical European countries blue mark on the left or right edge of the license plate is used. This blue mark will not be correctly detected, so that for example, an area is compared to the side mirror.
100 110 120 130 140 150 160 170 180 190 200 210 220 230 240
Shar an
Vito BMW 1s
Fabi a
BMW 5s
Tour an
Okta via
RAV4 BMW 3s
w
id
th
[
cm
]
vehicle
estimated width reference width
(a) Car park entrance P01
100 110 120 130 140 150 160 170 180 190 200 210 220 230 240
Zafir a
AstraBMW 5s
RAV4XC90GolfPass at
Tour an
A7 Pass at
Velo ster
XC90Polo
w
id
th
[
cm
]
vehicle
estimated width reference width
(b) Car park entrance P82
Figure 9: Comparison of the measurement and reference values for the width measurement with dynamic reference line.
Due to the fact, that preprocessing is performed before face recognition techniques are applied, we observe the same num-ber of erroneous measurements for each of the three tech-niques. The fraction of these erroneous measurements is at 20% (7 vehicles) describing the major part of false recogni-tions.
Considering the other 28 vehicles, 23 of them are recognized correctly and 5 of them are mistaken using the Eigenface method. Similar results are obtained using the Fisherface method where one vehicle more is recognized correctly. How-ever, the best results can be observed using LBPH where all vehicles are recognized correctly leading to a detection rate of 100% beside erroneous measurements.
Accuracy
100 110 120 130 140 150 160 170 180 190 200 210 220 230 240
Shar an
Vito BMW 1s
Fabi a
BMW 5s
Tour an
Okta via
RAV4 BMW 3s
h
ei
g
h
t
[c
m
]
vehicle
estimated height reference height
(a) Car park entrance P01
100 110 120 130 140 150 160 170 180 190 200 210 220 230 240
Zafir a
AstraBMW 5s
RAV4XC90Golf Pass at
Tour an
A7 Pass at
Velo ster
XC90Polo
h
ei
g
h
t
[c
m
]
vehicle
estimated height reference height
(b) Car park entrance P82
Figure 10: Comparison of the measurement and reference values for the height measurement.
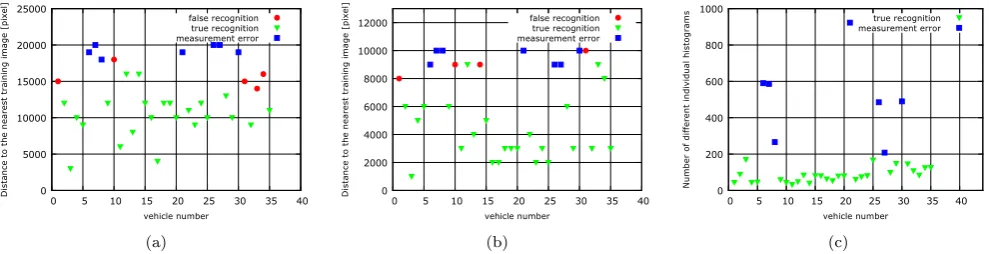
no matter the degree of conformity. Therefore, a quality metric is required in order to announce an erroneous detec-tion. The applied face recognition techniques already come with an adequate distance value which can be used as qual-ity metric. Figure 13 illustrate these distance values of each vehicle to the nearest training image. The Eigenface and Fisherface methods use vector subspace for distance compu-tation. LBPH use the amount of different single histograms. The higher the amount, the higher the differences between the images.
In summary, it is shown that the distances between the im-ages are suitable for an adequate quality metric for each of the approaches. Especially in case of LBPH, measurement errors can be clearly identified and eliminated by using the proposed quality metric. Vehicles with a higher amount of 200 single histograms are totally marked as measurement errors, as it is shown in Figure 13c.
In comparison to LBPH, the space between errors and cor-rect detections is not as clear when using Eigenface or Fish-erface. In this case, correct detections are close to the parts
(a) (b)
Figure 11: Distribution of results in the measurement of width (a) and height (b) - Car park entrance P01 and P82
0 10 20 30 40
Eigenfaces Fisherfaces LBPH
N
u
m
b
er
s
o
f
ve
h
ic
le
s
Face recognition algorithms false recognition
true recognition measurement error
Figure 12: Recognition rate of face recognition algorithms in car park entrance P4383. (LBPH -Local Binary Patterns Histograms)
of false recognitions, or on the same level with classified mea-surement errors, as shown in Figure 13a and Figure 13b.
5.
CONCLUSION
In this work, we have addressed the problem of measuring vehicles using computer vision techniques for a more efficient usage of parking slots in future car parks. For this purpose, two methods have been developed and evaluated on video recordings from certain entrances of various car parks at a major German airport.
The evaluation has shown that the first method returns ac-curate results in the measurement of width and height. Mea-surement errors between 2.1 and 2.7 percent for the width and between 0.9 and 3.5 percent for the height have been achieved. Despite the large distance between the camera and the low-resolution video material, these deviations are acceptable. We conclude, that the final results indicate a suitable deployment of such a measurement system in real scenarios. However, further investigations based on more data sets and other scenarios are required in future work to confirm our results. Due to missing side cameras, we were not able to determine the vehicle length based on the given video material. For future work we plan to use additional sensors or side cameras with an obstacle-free view.
0 5000 10000 15000 20000 25000
0 5 10 15 20 25 30 35 40
D is ta n ce t o t h e n ea re st t ra in in g i m a g e [p ix el ] vehicle number false recognition true recognition measurement error (a) 0 2000 4000 6000 8000 10000 12000
0 5 10 15 20 25 30 35 40
D is ta n ce t o t h e n ea re st t ra in in g i m a g e [p ix el ] vehicle number false recognition true recognition measurement error (b) 0 200 400 600 800 1000
0 5 10 15 20 25 30 35 40
N u m b er o f d if fe re n t in d iv id u a l h is to g ra m s vehicle number true recognition measurement error (c)
Figure 13: Distance between the query image and the next nearest training image - (a) Eigenfaces, (b) Fisherfaces and (c) local binary patterns histograms (LBPH)
faces, Fisherfaces and local binary pattern histograms). They showed that already a small number of training data (4 im-ages) can provide good results. Furthermore, the evaluation shows that a fewer the number of training images is not re-sponsible for an insufficient error detection. Rather more, a suitable image region (region of interest) must be selected in order to achieve good results.
In particular, the front area with radiator grille and head-lights of a vehicle provides a sufficiently good recognition score. The results have shown that an incorrect selection of the image region (duringPreprocessing) was responsible for an erroneous recognition in 20 percent of all cases. The recognition rate without measurement errors, which occurs during thePreprocessing, was 82 percent by Eigenfaces, 86 percent by Fisherfaces and 100 percent by LBPH. It has also been shown that measurement errors and incorrectly recog-nized vehicles can be identified with the appropriate metric. The quality of the process is enhanced by the significance of the metrics.
The two proposed methods are not sophisticated solutions for the classification of vehicles at car park entrances. Par-ticularly, a solution for determining the length of a vehicle is missing. The results in the recognition of vehicle types must be viewed with caution, because the number of vehicles was limited. The evaluation should be extended to a higher num-ber of transiting vehicles. Furthermore, confounding factors, such as poor lighting, low resolution of the camera or reflec-tions of puddles can affect the results. For this purpose, methods for reducing interferences and confounding factors have to be found in future.
6.
REFERENCES
[1] T. Ahonen, A. Hadid, and M. Pietikaeinen. Face description with local binary patterns: Application to face recognition.IEEE Trans. Pattern Analysis and Machine Intelligence, 12(28):2037–2041, 2006. [2] D. L. Baggio, S. Emami, D. M. Escriva, K. Ievgen,
N. Mahmood, J. Saragih, and R. Shilkrot.Mastering OpenCV with Practical Computer Vision Projects. Packt Publishing, Limited, 2012.
[3] K. W. Bowyer, K. Chang, and P. Flynn. A survey of approaches and challenges in 3d and multi-modal 3d+ 2d face recognition.Computer vision and image understanding, 101(1):1–15, 2006.
[4] G. Bradski and A. Kaehler.Learning OpenCV: Computer Vision with the OpenCV Library. O’Reilly Media, 2008.
[5] N. Buch, J. Orwell, and S. A. Velastin. Detection and classification of vehicles for urban traffic scenes. 2008. [6] A. Chaturvedi and N. Sethi. Automatic license plate
recognition system using surf features and rbf neural network.International Journal of Computer
Applications, 70(27):37–41, 2013.
[7] E. Dougherty.An introduction to morphological image processing. SPIE Optical Engineering Press,
Bellingham, Wash., USA, 1992.
[8] DPA. Das menschenleere parkhaus.Neue Osnabr¨ucker Zeitung, Juni 2014.
[9] S. Gupte, O. Masoud, R. Martin, and
N. Papanikolopoulos. Detection and classification of vehicles.Transactions on Intelligent Transportation Systems, 3(1), 2002.
[10] J.-W. Hsieh, S.-H. Yu, Y.-S. Chen, and W.-F. Hu. Automatic traffic surveillance system for vehicle tracking and classification.IEEE Transactions on Intelligent Transportation Systems, 7(2):175–187, 2006.
[11] D. M. Jang and M. Turk. Car-rec: A real time car recognition system. InApplications of Computer Vision (WACV), 2011 IEEE Workshop on, pages 599–605. IEEE, 2011.
[12] S. Messelodi, C. M. Modena, and M. Zanin. A computer vision system for the detection and classification of vehicles at urban road intersections.
Pattern analysis and applications, 8(1-2):17–31, 2005. [13] P. Negri, X. Clady, M. Milgram, and R. Poulenard.
An oriented-contour point based voting algorithm for vehicle type classification. InICPR (1), pages 574–577, 2006.
[14] G. Pearce and N. Pears. Automatic make and model recognition from frontal images of cars. InAdvanced Video and Signal-Based Surveillance (AVSS), 2011 8th IEEE International Conference on, pages 373–378. IEEE, 2011.
[15] N. Uke and R. Thool. Moving vehicle detection for measuring traffic count using opencv.Journal of Automation and Control Engineering, 1(4), 2013. [16] V. Varjas and A. Tan´acs. Car recognition from frontal
Processing and Analysis (ISPA), 8th International Symposium on, pages 819–823. IEEE, 2013. [17] H. Vceraraghavan, O. Masoud, and
N. Papanikolopoulos. Vision-based monitoring of intersections. InIntelligent Transportation Systems, 2002. Proceedings. The IEEE 5th International Conference on, pages 7–12. IEEE, 2002.
[18] P. Viola and M. Jones. Rapid object detection using a
boosted cascade of simple features.Conference on Comuter Vision and Pattern Recognition, 2001. [19] M. Yokoyama and T. Poggio. A contour-based moving