3622
Feature Selection Algorithms For Predicting
Students Academic Performance Using Data
Mining Techniques
Abeje Orsango Enaro, Dr. Sudeshna Chakraborty
Abstract: Educational Data Mining (EDM) is used by an educational organization to enhance the academic progress of students. For predicting the academic achievement of the student, EDM comes with many features selection and Machine Learning techniques. The purpose of using these features selection techniques is to remove the unwanted elements from the student academic datasets that have not required for performance prediction. By using feature selection techniques, the quality of students' datasets has improved, and with it, the predictive accuracy of various data mining techniques has also enhanced. Taking these facts into consideration analysis of four feature selection and six classification techniques are implemented on student datasets to check the predictive accuracy. After the implementation of FS and classification techniques only CfsSubsetEval, GainRatioAttributeEval feature selection gave improved efficiency up to 5%.
Index Terms: Educational Data Mining, Attribute Selection, Classification, Prediction, Accuracy
————————————————————
1 INTRODUCTION
Data Mining (DM) technique is used to find concealed information from more essential data. Its use in education has become prevalent lately, and most researchers work in this area. This broad field of EDM varies from predicting the student’s placement to academics. It is an evolving interdisciplinary area in which DM techniques are useful in academic data. Nowadays, educational systems store massive data that come from multiple sources and in diverse format. In a real-life scenario, every educational problem requires different mining techniques. The reason behind is that traditional DM techniques cannot be applied directly to all issues. So many software tools have developed, but all do not handle the educational problem, and an information officer is not able to use these tools without the understanding of DM. EDM is an essential application of data mining techniques to solve the research issues of the educational problem. In educational researcher’s community, main focused areas for research are Intelligent Tutoring System (ITS), Online Tutorial System (OTS) and e-learning to fabricate enhanced educational outcome. The university can determine the academic performance of a student by using the number of parameters. It could have based on academic or non-academic factors. Previously, students who excelled at the secondary education level can lose their interest due to social lifestyles and peer pressure. As compared to those who were struggling earlier with family distraction might be able to concentrate from home, excelling at the university. Feature Selection is a productive and dynamic research area in the field of Machine Learning and Data Mining.
The principal purpose of these FS algorithms is to select the most predictive features from the chosen dataset for analysis and ignore the rest of the attribute, which is non-predictive. It means that non-predictive elements are not affecting the actual result, but it reduces the complexity of the analysis results. The accuracy and effectiveness of the student's performance prediction model can have improved with the help of these feature selection algorithms. These feature selection algorithms can have further divided into three different groups, namely filter, wrapper and integrated methods. The filtering methods of feature selection algorithms is one of the primary techniques which depends on the general characteristics of the learning data and get performed during the pre-processing phase of the dataset. The Wrapper method is used to evaluate functions using learning algorithms. Embedded methods are executed during the classifier's learning process and be more specific to learning algorithms.
2 RELATED LITERATURE
The given section is a short review of work done in the area of feature selection algorithm by a different researcher. Many authors used feature selection (FS) algorithms in combination with classification algorithms to compare the prediction accuracy of varying student dataset. Some of the exciting work in this field of EDM has reviewed. Siva Kumar S, Venkataraman S, et al., "Predictive Modeling of Student Dropout Indicators in Educational Data Mining using Improved Decision Tree," proposed an improved version of decision tree algorithm which will predict the dropout students. The dataset of 240 students has been collected by the authors via survey and then applied the correlation-based feature selection algorithm for pre-processing of the dataset. The classification accuracy of this dataset is more than 90%. K. W. Stephen et al., in his study "Data Mining Model for Predicting Student Enrolment in STEM Courses in Higher Education Institutions," predict the fresh students’ enrolment in the course of STEM (Science, Technology, Engineering and Mathematics). They selected 18 different features and collected data from students through the questionnaire. For the pre-processing ____________________________
Abeje Orsangoy Enaro Research Scholar, Department of Computer Science and Engineering, Sharda University, Greater Noida, Uttar Pradesh 201310. Email Id: [email protected]
Dr. Sudeshna Chakraborty
of data, authors used Chi-Square and IG feature selection algorithm and found better prediction with CART decision tree algorithm. E. Osmanbegović, et al., in his study "Determining Dominant Factor for students Performance Prediction by using Data Mining Classification Algorithms," calculate the academic performance of the secondary school education student at Tuzla. For the pre-processing phase of the collected dataset, they used Gain Ratio (GR) feature selection algorithm. They found the best prediction accuracy with the Random Forest (RF) algorithm as compared to other classification algorithms. A. Figueira, et al., "Predicting Grades by Principal Component Analysis: A Data Mining Approach to Learning Analytics'," predict the students’ academic grade in Bachelor Degree program. For pre-processing phase, authors used Principal Component Analysis (PCA) feature selection algorithm. In this study, PCA feature selection algorithm has been used to build a decision tree. This tree is used to predict the grade of the student in academic. N. Rachburee and W. Punlumjeak et al., in his study "A comparison of feature selection approach between greedy, IG-ratio, Chi-square, and mRMR in educational mining, "compare different feature selection algorithm like IG-ration, Chi-Square, Greedy Forward selection and mRMR. This work has conducted on the first year's student's dataset (with 15 attributes) of the University of Technology, Thailand. In this research, authors found better prediction accuracy by using Greedy Forward (GF) selection with Artificial Neural Network (ANN) as compared
to other classification algorithms (Decision Tree, K-NN and Naive Bayes). M. Zaffar, M. A. Hashmani et al., in his study "Performance analysis of feature selection algorithm for educational data mining," implemented different filter feature selection algorithms on the selected dataset of a student. In this research, authors used the dataset of two different students with a different number of feature selection algorithm and analyzed the result for prediction accuracy.
3 RESEARCH METHODOLOGY
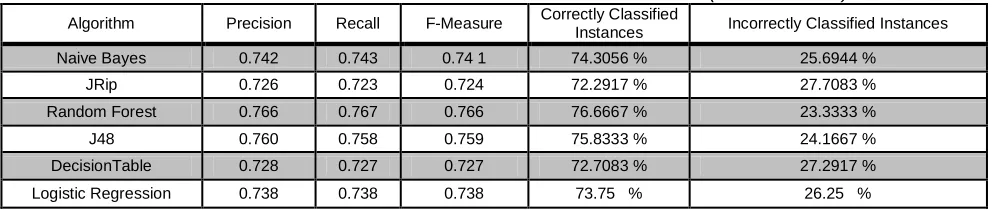
The considered dataset for this study has taken from Kalboard-360, which is a Multi-agent Learning Management System. In this technological era, such an online learning platform provides the user with unlimited access to educational resources from several places and on any device which uses an internet connection. The dataset consists of 16 features and 480 records of students, in which 305(Male) and 175 (Female) students. These features can have classified into three major categories, namely demographics, academic background, behavioural characteristics. In table 1, all the 16 attributes have considered for the analysis on the dataset mentioned above, and the following output has achieved where Naïve-Bayes is providing the most classified instances with accuracy up to 74.30%.
Table 1: Performance of Students' Academic Performance Dataset (xAPI-Edu-Data)
Algorithm Precision Recall F-Measure Correctly Classified
Instances Incorrectly Classified Instances
Naive Bayes 0.742 0.743 0.74 1 74.3056 % 25.6944 %
JRip 0.726 0.723 0.724 72.2917 % 27.7083 %
Random Forest 0.766 0.767 0.766 76.6667 % 23.3333 %
J48 0.760 0.758 0.759 75.8333 % 24.1667 %
DecisionTable 0.728 0.727 0.727 72.7083 % 27.2917 %
Logistic Regression 0.738 0.738 0.738 73.75 % 26.25 %
Different Feature Selection (FS) Algorithms:
Here, four FS algorithms such as CfsSubsetEval, GainRatioAttributeEval, InfoGainAttributeEval and ReliefAttributeEval are evaluated. Classifications algorithms Naive Bayes (NB), Logistic Regression (LR), DecisionTable (DT), JRip, J48 and Random Forest (RF) has evaluated through academic algorithms. cfsSubsetEval: Attributes subsets are evaluated based on both the predictive ability and the degree of redundancy of each feature. Low
intercorrelations have preferred for those features that have extremely related to the class. Attribute Subset Evaluator (cfsSubsetEval) + Search Method (Best first (forwards)) In table-2, best seven attributes (gender, Relation, raisedhands, VisITedResources, AnnouncementsView, ParentAnsweringSurvey, StudentAbsenceDays.) has selected based on the FS mentioned above algorithm. It providing most classified instances with accuracy up to 77.29% and least is JRip with accuracy up to 73.75%.
Table-2: CfsSubsetEval algorithm used for Academic Performance Evaluation
Algorithm Precision Recall F-Measure Correctly Classified Instances Incorrectly Classified Instances
Naive Bayes 0.744 0.746 0.743 74.5833 % 25.4167 %
JRip 0.738 0.738 0.738 73.75 % 26.25 %
Random Forest 0.773 0.773 0.773 77.2917 % 22.7083 %
J48 0.760 0.760 0.760 76.0417 % 23.9583 %
DecisionTable 0.729 0.729 0.729 72.9167 % 27.0833 %
Logistic Regression 0.763 0.763 0.763 76.25 % 23.75 %
3624 (GainRatioAttributeEval) + Search Method (Ranker) In
table2, best seven attributes (StudentAbsenceDays, raisedhands, VisITedResources, AnnouncementsView, ParentAnsweringSurvey, Discussion, Relation) has selected based on the FS mentioned above algorithm. And
RF and J48 providing most classified instances with accuracy up to 76.45% and least is decision table with accuracy up to 71.66%.
Table-3: GainRatioAttributeEval algorithm used for Academic Performance Evaluation
Algorithm Precision Recall F-Measure Correctly Classified Instances Incorrectly Classified Instances
Naive Bayes 0.750 0.752 0.749 75.2083 % 24.7917 %
JRip 0.736 0.735 0.735 73.5417 % 26.4583 %
Random Forest 0.764 0.765 0.764 76.4583 % 23.5417 %
J48 0.764 0.765 0.764 76.4583 % 23.5417 %
DecisionTable 0.719 0.717 0.717 71.6667 % 28.3333 %
Logistic Regression 0.754 0.754 0.754 75.4167 % 24.5833 %
InfoGainAttributeEval: Estimates the value of an attribute by calculating the information gain concerning the class attribute. InfoGain (Class, Attribute) = H (Class) - H (Class |
Attribute). Attribute Subset Evaluator
(InfoGainAttributeEval) + Search Method (Ranker) In table3, best seven attributes (StudentAbsenceDays,
raisedhands, VisITedResources, AnnouncementsView, ParentAnsweringSurvey, Discussion, and Relation) has selected based on the FS as mentioned above algorithm. It was providing most classified instances with accuracy up to 75.62%, and least is decision table with accuracy up to 69.32%.
Table-4: InfoGainAttributeEval algorithm used for Academic Performance Evaluation
Algorithm Precision Recall F-Measure Correctly Classified Instances Incorrectly Classified Instances
Naive Bayes 0.721 0.722 0.721 72.2222 % 27.7778 %
JRip 0.702 0.702 0.701 70.2083 % 29.7917 %
Random Forest 0.756 0.756 0.756 75.625 % 24.375 %
J48 0.715 0.713 0.714 71.25 % 28.75 %
DecisionTable 0.695 0.693 0.693 69.3252 % 30.6748 %
Logistic Regression 0.707 0.708 0.708 70.8333 % 29.1667 %
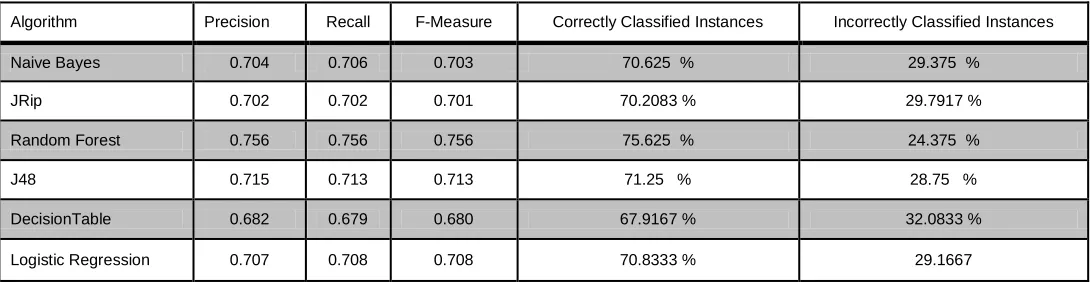
ReliefAttributeEval: It operates on commonly on continuous and discrete data class. It estimates the value by constantly sampling an instance and worth of the given attribute for nearby example of a similar and diverse course. Attribute Subset Evaluator (ReliefFAttributeEvall) + Search Method (Ranker) In table 4, the best seven attributes (NationaliTy,
PlaceofBirth, raisedhands, VisITedResources,
AnnouncementsView, ParentAnsweringSurvey,
StudentAbsenceDays) has selected based on FS. As mentioned above, algorithm and RF is providing the most classified instances with accuracy up to 75.62% and least is the decision table with accuracy up to 67.91%.
Table 5: ReliefAttributeEval used for Academic Performance Evaluation
Algorithm Precision Recall F-Measure Correctly Classified Instances Incorrectly Classified Instances
Naive Bayes 0.704 0.706 0.703 70.625 % 29.375 %
JRip 0.702 0.702 0.701 70.2083 % 29.7917 %
Random Forest 0.756 0.756 0.756 75.625 % 24.375 %
J48 0.715 0.713 0.713 71.25 % 28.75 %
DecisionTable 0.682 0.679 0.680 67.9167 % 32.0833 %
4 RESULTS AND DISCUSSIONS
In given work, our primary focus is on evaluating the performance of four FS algorithms on academic performance on student dataset. FS algorithm’s performance can have measured through various parameters like recall, precision, F-measurement and predictive accuracy. The F-measurement has defined as
the precise and harmonic means of memory. The results of four FS algorithms has reported by applying six classifiers to Tables-2 to Table-5. These tables represent the results obtained by each FS algorithm with their evaluation parameters.
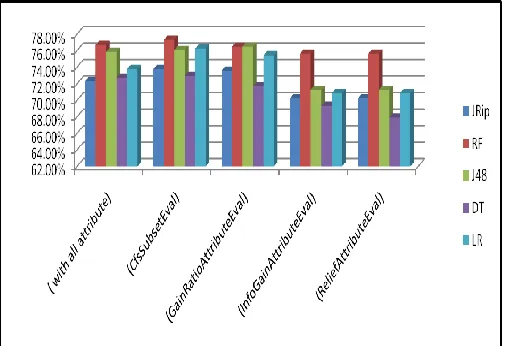
Table 5: Correctly Classified Instances (CCI) by all attribute selection algorithms
In the below table 5, six algorithms have used out of which Naïve Bayes, J48 is giving maximum output with GainRatioAttributeEval attribute of 75.20% and 76.45% correctly classified instances. JRip, RF, DT, and LR, on the other hand, has a maximum output with CfsSubsetEval of 73.75%, 77.29%, 72.91% and 76.25% correctly classified instances, respectively. The graphical representation of table-5 has represented in figure-1.
Figure 1: Graphical representation of Correctly Classified Instances
5
CONCLUSION
In this work, different FS algorithms are evaluated and analyzed with different classification algorithms (like Random Forest, JRip, J48, Decision Tree, Linear Regression). The implementation result of these FS algorithms doesn’t show any significant change range from 67.9167% to 77.2917% using WEKA toolkit. The cfsSubsetEval algorithm with Random Forest algorithm gave the highest accuracy up to 77.2917%, and ReliefAttributeEval algorithm with Decision Tree gave the lowest accuracy up to 67.9167%. From Figure 1, it is very
selection algorithms, shows better accuracy than other algorithms in combination. In future, more feature selection algorithms are analyzed with different classification algorithms to get better efficiency. The same work can also have done on different student academic dataset. Apart from this, we can't overlook the benefits of feature selection techniques in Data Mining
6 REFERENCES:
[1]. S. Sivakumar, S. Venkataraman, and R. Selvaraj, "Predictive Modeling of Student Dropout Indicators in Educational Data Mining using Improved Decision Tree," Indian Journal of Science and Technology, vol. 9, 2016.
[2]. K. W. Stephen, "Data Mining Model for Predicting Student Enrolment in STEM Courses in Higher Education Institutions," 2016.
[3]. E. Osmanbegović, M. Suljić, and H. Agić, "Determining Dominant Factor for students Performance Prediction by using Data Mining Classification Algorithms," Tranzicija, vol. 16, pp. 147-158, 2015.
[4]. A. Figueira, "Predicting Grades by Principal Component Analysis: A Data Mining Approach to Learning Analyics," in Advanced Learning Technologies (ICALT), 2016 IEEE 16th International Conference on, 2016, pp. 465-467. [5]. N. Rachburee and W. Punlumjeak, "A comparison
of feature selection approach between greedy, IG-ratio, Chi-square, and mRMR in educational mining," in Information Technology and Electrical Engineering (ICITEE), 2015 7th International Conference on, 2015, pp. 420-424.
[6]. M. Zaffar, M. A. Hashmani, and K. Savita, "Performance analysis of feature selection algorithm for educational data mining," in Big Data and Analytics (ICBDA), 2017 IEEE Conference on, 2017, pp. 7-12.
ML Algorithm
CCI with ( all attribute)
CCI with (CfsSubsetEval)
CCI with (GainRatioAttributeEval)
CCI with (InfoGainAttributeEval)
CCI with (ReliefAttributeEval)
NB 74.3056 % 74.5833 % 75.2083 % 72.2222 % 70.625 %
JRip 72.2917 % 73.75 % 73.5417 % 70.2083 % 70.2083 %
RF 76.6667 % 77.2917 % 76.4583 % 75.625 % 75.625 %
J48 75.8333 % 76.0417 % 76.4583 % 71.25 % 71.25 %
DT 72.7083 % 72.9167 % 71.6667 % 69.3252 % 67.9167 %
3626 [7]. A. Mueen, B. Zafar, and U. Manzoor, "Modeling
and Predicting Students' Academic Performance Using Data Mining Techniques," International Journal of Modern Education and Computer Science, vol. 8, p. 36, 2016.
[8]. Amrieh, E. A., Hamtini, T., & Aljarah, I. (2015, November). Pre-processing and analyzing educational data set using X-API for improving student's performance. In Applied Electrical Engineering and Computing Technologies (AEECT), 2015 IEEE Jordan Conference on (pp. 1-5). IEEE.
[9]. N. Rachburee and W. Punlumjeak, "A comparison of feature selection approach between greedy, IG-ratio, Chi-square, and mRMR in educational mining," in Information Technology and Electrical Engineering (ICITEE), 2015 7th International Conference on, 2015, pp. 420-424.
[10]. J. Novaković, "Toward optimal feature selection using ranking methods and classification algorithms," Yugoslav Journal of Operations Research, vol. 21, 2016.
[11]. C. Anuradha and T. Velmurugan, "Feature Selection Techniques to Analyse Student Academic Performance using Naïve Bayes Classifier," in The 3rd International Conference on Small & Medium Business, 2016, pp. 345-350. [12]. K. W. Stephen, "Data Mining Model for Predicting
Student Enrolment in STEM Courses in Higher Education Institutions," 2016.
[13]. A. Figueira, "Predicting Grades by Principal Component Analysis: A Data Mining Approach to Learning Analytics’," in Advanced Learning Technologies (ICALT), 2016 IEEE 16th International Conference on, 2016, pp. 465-467. [14]. Amrieh, E. A., Hamtini, T., & Aljarah, I. (2016).