MATRIX ISOLATION STUDY OF
OZONE WITH
HALOGEN-CONTAINING ALKANES
A thesis submitted in partial fulfilment of the requirements of the
degree of Doctor of Philosophy
by
Jonathan Roger Dann
Christopher Ingold Laboratories
University College London
ProQuest Number: 10017225
All rights reserved
INFORMATION TO ALL USERS
The quality of this reproduction is dependent upon the quality of the copy submitted.
In the unlikely event that the author did not send a complete manuscript and there are missing pages, these will be noted. Also, if material had to be removed,
a note will indicate the deletion.
uest.
ProQuest 10017225
Published by ProQuest LLC(2016). Copyright of the Dissertation is held by the Author.
All rights reserved.
This work is protected against unauthorized copying under Title 17, United States Code. Microform Edition © ProQuest LLC.
ProQuest LLC
789 East Eisenhower Parkway P.O. Box 1346
ABSTRACT
The main aim of this research is to study, using Fourier-transform infrared
spectroscopy, the photochemical reaction of ozone with some halogen-containing
alkanes in low temperature matrices. The reactions between halogenated alkanes and
ozone, studied in this thesis, can be applied to gas phase atmospheric research with
regard to ozone depletion. One example, not expanded on in this thesis, is the search for
ozone-friendly species (refrigerants, propellants etc.), especially since one of the
provisions of the Montreal protocol is to phase-out such species.
Matrix reactions are carried out at low temperatures and, this means that the
reactants are often effectively unable to react and, thus many ’reactive’ or otherwise
’difficult to study’ compounds can be stabilized and studied spectroscopically. In
these experiments, the matrices must be photolysed in order to initiate a reaction; and
we have used infrared, visible and ultraviolet irradiation to initiate reactions. By
careful selection of the photolysis wavelength range used to irradiate the matrix it is
possible to form different products and, thus reveal the photochemical reaction path.
The matrix environment also enables us to detect reactions that would not
occur in the gas phase; in a matrix the species are held in close proximity to one
another, allowing a variety of secondary reactions to occur, whilst, in the gas phase
the primary products usually separate rapidly. This facet of a matrix reaction - by
which the products are held closely together - has enabled us to study a range of
nearest-neighbour complexes that were generated in situ by careful selection of the precursors.
Using matrix techniques, the reaction of ozone with halogen-containing
compounds leads to the observations below.
In the cases of the single iodine-containing precursors ozone binds weakly with
the iodine atom, and this modifies the photochemistry of ozone, allowing the effective
dissociation of ozone. The transfer of an oxygen atom to the precursor leads to the
possible to determine wavelength-dependent photolysis pathways for these reactions.
The reaction of ozone with the halogen-containing precursors, studied in this
thesis, leads invariably to the production of carbonyl complexes. The rigid nature of
the matrix means that the spectra of these perturbed carbonyl complexes can be
recorded, and the wavenumbers of specific bands compared between similar species.
Similar comparisons are made between the carbon monoxide...Lewis acid complexes
which tend to be produced after further photolysis of the carbonyl complexes. Trends
are observed for these complexes in which the bands of the complex are shifted from
those of the isolated species; this shift can be related to the Lewis acid strength of the
perturber.
Finally, the carbonyl (COBrF), formed in the reaction of
tribromofluoromethane with ozone, dissociates via an alternative mechanism to
produce the radical-atom pair FCO and Br. The study of the subsequent reactions of
these two might possibly have important implications with regard to processes
ACKNOWLEDGMENTS
I must first thank Dr. Rob Withnall without whom the original impetus and apparatus
for matrix experiments at U.C.L would not exist. Any mention of thanks, with regard
equipment, would not be complete without thanking John Hill, Dave Knapp and the
members of the workshop. Thanks also to my friends throughout the department, the
Clark group, ULSAC and Prof. R.J.H. Clark who made the last few years an
education. My special thanks go to Ian, for reading these chapters and for listening
to my various research ideas, career aspirations etc.
And finally, to Vicky, my Mum, Nan, Tony and Pepper without whom the last
seven years would have been a lot harder.
I gratefully acknowledge the financial support of the E.P.S.R.C. and UCL, and
CONTENTS
A B S T R A C T ... ii
LIST OF F IG U R E S ... viii
LIST OF T A B L E S ... x
1. INTRODUCTION ... 1
LI MATRIX ISOLATION ... 1
1.2 IDEA FOR THIS S T U D Y ... 2
1.3 THESIS O U T L IN E ... 3
2. EXPERIMENTAL ... 5
2.1 INTRODUCTION... 5
2.2 PROPERTIES OF M A TR IC ES... 5
2.3 INFRARED SPECTROSCOPY... 7
2.4 EXPERIMENTAL EQUIPMENT ... 14
2.4.1 Cryogenic & Gas handling e q u ip m en t... 14
2.4.2 Spectroscopic equipment ... 18
2.4.3 Photolysis equipm ent... 18
2.5 EXPERIMENTAL TECHNIQUE ... 19
2.5.1 Preparation of p re c u rso rs... 19
2.5.2 Experiments performed on a m atrix ... 20
2.5.3 Methodology of a typical experim ent... 23
3. REACTION OF ALKYL HALIDES WITH OZONE ... 25
3.1 INTRODUCTION... 25
3.2 lODOETHANE, C^H^I... 26
3.2.1 R esu lts... 27
3.2.2 D isc u ssio n ... 31
3.3 BROMOETHANE, C^H^Br ... 40
3.4 2-IODOPROPANE, (CH3)2C H I ... 44
3.4.1 R esults... 44
3.4.2 D iscu ssio n ... 46
3.5 CONCLUDING REM A RK S... 52
4. REACTION OF POLYFLUOROIODOETHANES WITH OZONE ... 72
4.1 INTRODUCTION... 72
4.2 PENTAFLUOROIODOETHANE, C^F^I... 73
4.2.1 R esults... 74
4.2.2 D isc u ssio n ... 78
4.3 1,1,1-TRIFLUOROIODOETHANE, CF^CH^I... 82
4.3.1 R esults... 83
4.3.2 D iscu ssio n ... 8 6 4.4 1,1,2,2-TETRAFLUOROIODOETHANE, CF^HCF^I ... 90
4.4.1 R esults... 90
4.4.2 D isc u ssio n ... 92
4.5 1,1,1,2-TETRAFLUOROIODOETHANE, CF3CFHI ... 95
4.5.1 R esu lts... 95
4.5.2 D isc u ssio n ... 98
4.6 POLYFLUOROETHANAL...XI COMPLEXES ... 99
4.7 PHOTOCHEMICAL INTERCONVERSION ... 101
4.8 CONCLUDING REM A RK S... 104
5. REACTION OF CHLOROIODOMETHANE AND DIIODOMETHANE . . 131
5.1 INTRODUCTION... 131
5.2 CHLOROIODOMETHANE, C H ^C II... 132
5.2.1 R esu lts... 133
5.2.2 D isc u ssio n ... 136
5.3 DIIODOMETHANE, CH^I^ ... 143
5.3.1 R esu lts... 143
5.3.2 D isc u ssio n ... 144
5.5 CONCLUDING REM A RK S... 147
6 . OXYGEN ATOMS WITH BROMOCHLOROMETHANES ... 161
6.1 INTRODUCTION... 161
6.2 BROMOCHLOROMETHANE, C H ^B rC l... 162
6.2.1 R esu lts... 162
6.2.3 D isc u ssio n ... 165
6.3 DIBROMOCHLOROMETHANE, C H B r^C l... 172
6.3.1 R esults... 172
6.3.2 D isc u ssio n ... 175
6.4 CONCLUDING REM A RK S... 180
7. TRIBROMOFLUOROMETHANE WITH OXYGEN ATOMS ... 193
7.1 INTRODUCTION... 193
7.2 RESULTS ... 194
7.3 DISCUSSION... 197
7.4 CONCLUDING REM A RK S... 200
8 . CONCLUSIONS AND SUGGESTIONS FOR FUTURE W O R K ... 208
8.1 CONCLUSION... 208
8.2 SUGGESTIONS FOR FURTHER W O R K ... 210
APPENDIX A ... 216
LIST OF FIGURES
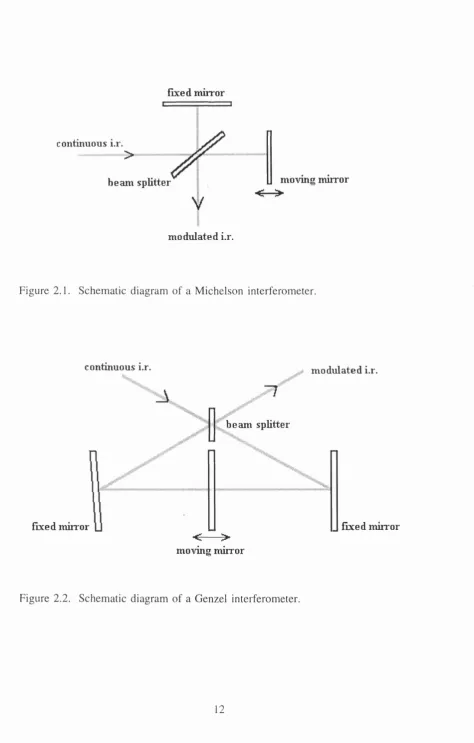
2.1. Schematic diagram of a Michelson interferom eter... 12
2.2. Schematic diagram of a Genzel interferometer ... 12
2.3. Diagram of the cryogenic cold window and s h ro u d ... 15
2.4. Schematic diagram of the gas handling m a n ifo ld s... 17
3.1. Infrared spectra showing bands of the C2H5I—O3 complex... 64
3.2. Infrared spectra showing bands of iodosoethane, C2H5IO ... 65
3.3. Infrared spectra showing bands of iodylethane, C2H5IO2 ... 6 6 3.4. FTIR spectra of C2H5OI, HOI and the CH3COH—HI complex ... 67
3.5. Infrared spectra showing bands of the ethanal—HBr c o m p lex ... 6 8 3.6. Infrared spectra showing bands of 2-iodosopropane, (CH3)2CHIO ... 69
3.7. Infrared spectra showing bands of 2-iodylpropane, (CH3)2CHI0 2 ... 70
3.8. Infrared spectra showing bands of the acetone—HI com plex ... 71
4.1. FTIR spectra showing bands of iodosopentafluoroiodoethane, C2F5IO . . . 122
4.2. The Vc=o region of the complex CF3COF—I F ... 123
4.3. FTIR spectra showing bands of CF3CH2IO and of CF3COH—H I ... 124
4.4. Infrared spectra of iodyl-1,1,1 -trifluoroethane, CF3CH2IO2 ... 125
4.5. Infrared spectra showing the Vc=o bands of CF3COH—H I ... 126
4.6. FTIR spectra of CF2HCF2IO and CF2HCOF—I F ... 127
4.7. Infrared spectra showing the Vc=o bands of CF2HCOF—I F ... 128
4.8. FTIR spectra of CF3CFHIO, of CF3CFHIO2, and of CF3COF—H I 129 4.9. FTIR spectra of the complexes CF3COF—HI and CF3COH—IF... 130
5.1. Infrared spectra showing bands of iodosochloromethane, CH2C1I' ^ 0 . . . . 156
5.2. Infrared spectra of the band attributed to H O I ... 157
5.3. FTIR spectra showing the Vc=o bands of the C0HC1...HX complexes . . 158
5.4. Infrared spectra showing the Vhci and bands of 0C(HC1)(HI) ... 159
5.5. Plot of energy v. C-I-O angle between CH2CIIO and CH2C I O I ... 160
6.1. FTIR spectra showing the Vc=o bands assigned to COHCl and COHBr . . . 187
6.4. The Vc=o bands of COHCl, COHBr and C O B rC l... 190
6.5. Plot of optical density v. time for the reaction of CHBr2Cl with O3 191
6 .6 . Infrared spectra of various carbon monoxide com plexes... 192
7.1. Infrared spectra of CBr^F, COBrF and F C O ... 205
7.2. Infrared spectra showing the conversion between COBrF and FCO . Br . . 206
LIST OF TABLES
3.1. Infrared bands of the molecular complex C2H5I—O3 ... 53
3.2. Infrared bands of the molecular complex C2H5I—O3 ... 54
3.3. Infrared bands of iodosoethane, C2H5IO... 55
3.4. Infrared bands of iodylethane, C2H5IO2 ... 55
3.5. Infrared bands of HOI and CH3CH2OI ... 56
3.6. Infrared bands of ethanal, and ethanal—HI co m p lex es... 57
3.7. Infrared bands of bromoethane ... 58
3.8. Infrared bands of the ethanal—HBr complex... 59
3.9. Infrared bands of ethanal and ethanal—HX com plexes... 60
3.10. Infrared bands of 2-iodopropane ... 61
3.11. Infrared bands of 2-iodosopropane, (CH3)2CHIO ... 62
3.12. Infrared bands of 2-iodylpropane, (CH3)2CHI0 2 ... 62
3.13. Infrared bands assigned to hydrogen hypoiodide, HOI ... 62
3.14. Infrared bands assigned to acetone co m p lex es... 63
4.1. Infrared bands of pentafluoroiodoethane, C2F5I ... 105
4.2. Infrared bands of ozone in the complex, C2F5I—O3 ... 106
4.3. Infrared bands of iodosopentafluoroiodoethane, C2F5IO ... 107
4.4. Infrared bands of iodylpentafluoroethane, C2F5IO2 ... 108
4.5. Infrared bands of hypoiodopentafluoroethane, C2F5OI ... 108
4.6. Infrared bands of the complex CF3CFO—I F ... 109
4.7. Infrared bands of 1,1,1 -trifluoroiodoethane, CF3CH2I ... 110
4.8. Infrared bands of ozone in the CF3CH2I—O3 c o m p le x ... I l l 4.9. Infrared bands of iodoso-1,1,1-trifluoroethane, CF3CH2I O ... 112
4.10. Infrared bands of iodyl-1,1,1-trifluoroethane, CF3CH2IO2 ... 1 1 2 4.11. Infrared bands of hypoiodo-1,1,1 -trifluorethane, CF3CH2O I ... 112
4.12. Infrared bands of the complex CF3CHO—HI ... 113
4.13. Infrared bands of 1,1,2,2-tetrafluoroiodoethane, CF2HCF2I ... 114
4.14. Infrared bands of ozone in the complex, CF2HCF2I—O3 ... 115
4.16. Infrared bands of the complex CF2HCFO—I F ... 116
4.17. Infrared bands of 1,1,1,2-tetrafluoroiodoethane, CF3C F H I ... 117
4.18. Infrared bands of ozone in the complex, CF3CHFI—O3 ... 118
4.19. Infrared bands of iodoso-1,1,1,2-tetrafluoroethane, CF3CFHIO ... 119
4.20. Infrared bands of iodyl-1,1,1,2 -tetrafluoroethane, CF3CFHIO2 ... 119
4.21. Infrared bands of CF3COF—HI and CF3COH—I F ... 120
4.22. Carbonyl bands of the complexes, CF3COX—XI (X = H or F ) ... 121
5.1. The infrared bands of chloroiodomethane, CH2C I I ... 148
5.2. Infrared bands assigned to ozone in the CH2CII—O3 com plex ... 149
5.3. Infrared bands of iodosochloromethane, CH2CIIO ... 150
5.4. Infrared bands of hypoiodochloromethane, H2CICOI ... 150
5.5. Infrared bands of the COHCl—HI complex ... 151
5.6 Infrared bands of the complex, O C (H C l)(H I)... 151
5.7. Infrared bands of diiodomethane, CH2I2 ... 152
5.8. Infrared bands of the products of reaction of CH2I2 with O atoms ... 154
5.9.a. Z-Matrix of iodosochloromethane, H2CIC-I-O (C-I-O angle ~ 99°) . . . . 155
5.9.b. Z-Matrix of hypoiodochloromethane, CH2CI-O-I (C-I-O angle ~ 28°) . . 155
5.9.C. Interatomic distances of CH2CIIO and CH2C IO I... 155
6.1. Infrared bands of bromochloromethane, CH2BrCl ... 181
6.2. IR bands of COHCl—HBr, COHBr—HCl and C O B rC l... 182
6.3. Infrared bands of the (CO)(HCl)(HBr) complexes... 183
6.4. Infrared bands assigned to several COHCl—XY complexes... 183
6.5. Infrared bands of dibromochloromethane, CHBr2C l ... 184
6 .6 . IR bands of COHCl -Br2, COHBr -BrCl and COBrCl—H B r ... 185
6.7. Infrared bands of the complexes (OC)(HBr)(BrCl) and (0 C)(HCl)(Br2) . . 186
7.1. Infrared bands of tribromofluoromethane, CBr3F ... 202
7.2. Infrared bands of the products of the reaction of O atom with CBr3F. . . . 203
7.3. Comparison of bands of COF2 and COF2—X (X = Br2, IF, CI2) ... 204
8.1. The various species and complexes detected in this thesis ... 214
ABBREVIATIONS
 Angstroms
c. circa
c m ' wavenumber
Ô bending vibrational mode
ir infrared
nm nanometer
V stretching mode
P rocking mode
T torsion
uv
ultravioletvac vacuum
vis visible
Chapter 1
INTRODUCTION
1.1 MATRIX ISOLATION
Historical background
Pimentel* and Porter^ are credited with separately carrying out the first matrix isolation
experiments using inert gases as matrix media. Although, Lewis and Lipkin’s^
phosphorescence studies of aromatic molecules in low temperature glassy media pre
date these and can probably be viewed as the first use of the technique. Pimentel has
subsequently come to be regarded as the father of matrix isolation with his early
spectroscopic investigations of photolytically produced radicals such as HNO"* and
HCO^ paving the way for future experiments like this; in which species of interest are
generated photolytically in situ in the matrix. Since the early studies of unstable intermediates and radicals, the matrix technique has been applied to a wide range of
investigations including condensates from high temperature vapours, interstellar ices,
isomerism, metal complexes, molecular complexes and even as a detector for HPLC.
Whilst the early studies focused on the detection and generation of radicals and
unstable intermediates, later workers began to study reactions occurring in matrices,
typically between atoms and stable molecules. Various diatomic and triatomic species
have been used to generate these atoms (N, S, F, Cl, Br, O etc.),^ ozone becoming the
most common source - and that used in this study - of oxygen atoms. The results
from these and numerous other matrix experiments have been well documented in a
1.2 IDEA FOR THIS STUDY
The aim of this work is to study the reactions between ozone and halogen-containing
hydrocarbons, primarily to observe and characterise novel intermediates, and to
determine mechanisms for such processes. The reaction of halocarbons with ozone,
in matrices, also has relevance to processes that may occur in the gas phase, and
specifically in the atmosphere, since some of the precursors are currently used as
pesticides or are related closely to commonly used ones.
As an aside, there has been a long standing interest in the reaction of oxygen
atoms with iodine-containing alkanes, specifically iodomethane, with reports appearing
each decade since the I960’s. The study of di-iodomethane and chloroiodomethane,
here, has continued the interest in iodinated methanes into the 1990’s. The
investigation of the reaction of ozone with iodine m onochloridecan be viewed as the
precursor to this and to the studies with iodomethane^® and triOuoroiodomethane.^ '
Each experiment studied in this thesis has been motivated by and extends the research
of a number of previous authors and, for clarity and space these considerations are
mentioned within the relevant chapters.
Overview of the aims behind each precursor
The precursors and the way in which they react with ozone can be roughly
split into two groups: those that contain one iodine atom; and those that do not (either
containing more than one iodine atom or none at all). The first group (those
containing a single iodine atom), began with iodoethane (chapter 3) as an extension
to the previously studied iodomethane,^® with the added possibility of observing
differing reactions due to the increased carbon-chain length. The results from this
study, specifically the detection of HOI, prompted the study of the rest of the species
in chapters 3, 4 and 5. 2-Iodopropane (chapter 3) extended the carbon-chain length
by a further carbon atom, and had the possibility that some steric effect might alter
clarify the mechanism proposed for the reaction of iodoethane with ozone in chapter
3. They are also an extension to the ozone/trifluoroiodomethane^' study. The
investigations with chloroiodomethane and di-iodomethane extended the study of
iodinated methanes in a further direction by adding a second halogen atom (either Cl
or I). In chapters 3-5 the species having the backbone structure X-CH2I, where X =
Cl, I, CH3 and CF3, have now been studied.
The study of the second group, was motivated by two goals, the first being
an attempt to detect Br-0^ bonds. The second, is to detect and compare the spectra
of a number of carbonyl- and carbon monoxide-Lewis acid complexes. The first goal,
motivated the initial study with bromoethane, and comparisons between the reactions
of species having different halogen atoms were made. The second, was motivated by
the detection of the carbonyl and carbon monoxide complexes reported as products of
the reaction of ozone with iodinated methanes (chapterS). These suggested that a
number of interesting complexes might be formed with other halogenated methanes
and, thus bromochloromethane and dibromochloromethane (chapter 6 ) were treated
with oxygen atoms and the products reported. Tribromofluoromethane (chapter 7) was
a slight departure, in that knowledge of the way in which oxygen atoms react with
halogenated alkanes was used to select CBr3p as a precursor to form COBrF. The
photochemical and thermal reactions of this product were subsequently studied in low
temperature matrices. In chapters 3-7 the many carbonyl- and carbon monoxide-Lewis
acid complexes reported, enable comparisons to be made between the spectra of the
complexes having different Lewis acid groups but the same carbonyl, and vice versa.
1.3
THESIS OUTLINE
This thesis is divided into eight chapters with chapters 1 and 2 providing the reader
with an overview of this matrix study, its place in the larger body of matrix type
experiments and an understanding of the equipment and techniques involved. The
contents and aims of chapters 3-7 are mentioned in more depth below. The chapters
logical progression from one study to the next. Each of the chapters | is self-contained
in that all discussions, comparisons and conclusions pertaining to the study are given
in the relevant chapter.
Chapter 3 reports the results of the reaction of ozone with iodoethane,
bromoethane and 2-iodopropane. These reactions produce novel intermediates
containing I-O bonds and some carbonyl complexes for which the geometry of the
complex can be inferred from the wavenumber shifts of the detected bands. A
mechanism for these reactions is proposed, based on the species that were detected.
Chapter 4 continues the study of iodine-containing precursors with the study
of four polyfluoroiodoethanes, these precursors being chosen to provide a larger
range of intermediate and final products, and to further study the mechanism.
Chapter 5 investigates two more iodine-containing precursors, but based
around the one-carbon system. In this chapter the beginnings of a new thread are
reported with the detection of complexes having different halogen atoms, e.g.
COHX...HY and OC(HX)(HY), where X and Y are different halogen atoms.
Chapter 6 continues the work started in chapter 5 by examining the reaction
of bromine- and chlorine-containing methanes with ozone. The products reported
extend the number of known carbonyl- and carbon monoxide-complexes. The spectra
of the species detected are compared with the spectra of the products detected after
photolysis of the iodine-containing precursors.
Chapter 7 reports the products of the reaction of CBr^F with ozone and their
subsequent photochemical behaviour. The detected products confirm the proposed gas
phase mechanism, as well as, the detection of several additional products.
Chapter 8 summarises the work reported in chapters 3-7, makes some general
conclusions and provides some suggestions for modifications to the current study and
Chapter 2
EXPERIMENTAL
2.1 INTRODUCTION
The experimental methods and considerations undertaken to complete this research are
mentioned in this chapter. These range from the choice of matrix material, of
spectroscopic technique and, of experiments to be performed on the matrix. The
experimental apparatus required to complete these experiments is reported, as are the
technique and theory that are relevant to an understanding of their operation. The
apparatus and technique reported is that currently used in this laboratory. A final
section gives an outline of a typical experiment for the reference of future workers.
2.2 PROPERTIES OF MATRICES
An ideal matrix material will provide an inert, rigid support at the temperatures to be
studied, it will also be spectroscopically transparent over the required regions. It
should also be sufficiently volatile to enable it to be mixed with the precursors in the
gas phase at room temperature. Thus species held in a matrix, under these conditions,
are effectively 'trapped’ and can be studied spectroscopically at leisure, on the
timescale of conventional spectrometers. The ideal properties of matrix materials are
discussed in more detail below.
Inertness. When attempting to study the reaction of two species in a matrix
it is of particular importance that the matrix support material does not react with either
possible fluorocarbon or relatively inert materials, i.e. N2, might have reacted under
the photolysis conditions used in these experiments. The inertness of a matrix
material is also affected by its purity, since any nitrogen or halocarbon impurities
would be expected to react with either ozone or the other precursor. For this reason
all reagents and matrix materials were purchased at the highest purity possible, and
where appropriate degassed and decanted by freeze-thaw techniques. Note: in some
experiments oxygen was used as the matrix support with the intention that photolysis
would rupture the 0 - 0 bond and create O atoms which would react with the other
precursor in the matrix. It was hoped that the oxygen matrices would support the
formation of differing products to those formed in ozone/argon matrices.
Rigidity. The rigidity of the matrix is important for two reasons. The first is
that spectral collection is made more easy if a uniform rigid matrix is produced. The
second is that a rigid, low temperature matrix will prevent most reactions from
occurring. The rigidity prevents any bimolecular collisions from occurring, this
increases the lifetime of any reactive intermediates, whilst the low temperature
prevents any reactions that have any significant activation energy.
As a rough estimate matrix materials become sufficiently softened to allow
diffusion at approximately half the melting point (cf. Tammann’s rule used in solid- state studies), thus both argon and oxygen must be cooled to below 25 K, and ideally
to ~ 14 K to meet the rigidity requirements.
Spectroscopy. Infrared spectroscopy is the technique of choice in these studies
because of the ease of collection of spectra and the narrow band widths (~ 1 cm ')
exhibited, which make identification of species from their spectra easier. Argon meets
the matrix criteria of spectral transparency at the temperatures employed and over the
spectral region (note: the transparency of some noble gases i.e. Xe, varies with
temperature). The matrices were deposited slowly (~ 3 mmolh"') and at slightly
elevated temperatures (~ 17 K) to improve the transparency of the matrices and hence
the recorded spectra.
Volatility. For ease of preparation the matrices are best mixed in the gas
sufficiently volatile at room temperature. This poses an alternative problem since the
more volatile the matrix material, the lower the temperature required to ’freeze’ the
matrix on the cold window (see above - rigidity).
Thermal properties. The matrix material should be chosen, taking into
account the thermodynamic properties of the matrix (Latent heat of fusion, lattice
energy, and thermal conductivity) so as to minimise the heat produced in forming the
matrix and maximise the ability of the matrix material to transfer heat. The latter is
of particular importance since as the thickness of the matrix increases the excess
energy must be removed through the matrix; a matrix material with poor thermal
conductivity may experience localised warming and thus evaporation of the matrix.
The rates at which the matrices are deposited can have a significant effect on these
properties and, this is another reason for the slow deposition rate.
Other properties. The electrical properties and crystal structures of the matrix
materials at low temperatures can have an effect on the recorded spectra. These
phenomena are discussed in further detail elsewhere.® Of interest to these studies is
the possibility of multiple trapping sites that might give rise to additional bands in the
spectra. These are reported for the V3 bands of ozone isolated in argon (see chapter
3).
2.3
INFRARED SPECTROSCOPY
Infrared spectroscopy has been used to study these matrices for two reasons. The first
is that infrared provides vibrational information about the species in the matrix, and
thus the species can be identified from their spectra. The second, is that infrared
spectrometers are commercially available, and unlike other spectral techniques the
radiation incident on the matrix does not damage the matrix, for example, with Raman
spectroscopy the use of lasers can cause areas of the matrix to warm and thus
evaporate, destroying the matrix. The collection of spectra is experimentally straight
use of infrared and other spectroscopes is covered in a number of texts.^ '^’^^’^^
The infrared spectra of matrix isolated species usually have very narrow
linewidth and only exhibit bands attributed to vibrations; any rotational component
being removed because of the low temperature and rigidity of the matrix. The spectra
are, for the most part, in very good agreement with the gas phase spectra; the isolation
in the matrix approximates to that in the gas phase. The narrow linewidth of the
bands makes isotopic substitutions easy to distinguish, this is very useful as it enables
even small shifts between heavy isotopes to be observed. These advantages ease the
identification of product species from their spectra.
The rest of this section provides a basic understanding of the origins of
infrared spectra, and a description and discussion of the Fourier-transform
spectrometer used in this work.
Underlying theory
The infrared absorption spectra recorded in this study arise from the vibrational
motions of a molecule in its ground electronic state. The vibrating molecule absorbs
in the infrared region of the spectrum, typically between 4500 and 400 cm. * The case
of a diatomic molecule is used to illustrate the problem and to help to understand
these vibrations in terms of the observed spectra. Nuclei move in a potential arising
from electrostatic interactions between the particles (electrons and nuclei), this can be
seen from the adiabatic Born-Oppenheimer approximation.
Due to the vast mass difference between the nuclei and electrons we
can consider that the electron cloud adjusts adiabatically to any nuclear
motion so as to minimise the potential energy of the system at any
nuclear separation. The nuclei therefore effectively move in a potential
arising from electrostatic interactions between the particles.
mass) moving in the same potential. To a good approximation most internuclear
potentials can be considered to be harmonic for small displacements about the
equilibrium position. In this case the problem has the exact classical analogue of two
particles joined by a massless linear restoring spring. The frequency, v, at which the
system oscillates is found from the solution of the equation of motion.
|i d^r/dt^ = -k(r-ro)
which has the solution
V = 1/271 ( k /p )
where r^ is the equilibrium separation and k is the force constant.
Classically an oscillating system will emit and absorb radiation at this resonant
frequency. Classical mechanics can therefore go some way to explaining the general
features of infrared spectra. If we are interested in the intensities of radiation, or
specifically on selection rules then quantum mechanics is required.
Quantum mechanically a series of vibrational levels are predicted (equally
spaced in the case of harmonic potential). Radiation is then seen as being associated
with a transition between two levels. The Bohr frequency rule gives the frequency of
light, V, absorbed or emitted on the transition between two energy states, thus:
A E = E ' - E " = /zv
where AE is the change in energy between energy, E", of the ground state and E' of
Fourier-transform Infrared spectroscopy (FTIR)
A Fourier-transform infrared spectrometer can be said to consist of four main
components, the source, interferometer, sample compartment, and detector. In these
experiments, a Globar source was used to supply the infrared radiation over the range
4500 - 400 cm.'^ The sample chamber is located after the interferometer and before
the detector and can be evacuated - using a mechanical vacuum pump - to reduce the
absorptions of water and carbon dioxide which would otherwise interfere with the
spectrum. A liquid-nitrogen cooled mercury-cadmium-telluride (MCT) detector is
used, this being the most sensitive available in the mid-IR region. A deuterated-
triglyceride-sulphate (DTGS) detector is a common alternative to the MCT, however
these are not as sensitive as the MCT detector, but have the advantage that they can
be used at room temperature. The operation of the interferometer is discussed below.
The Fourier-transform technique is described in a number of texts^^’^^’^*’^^ in addition
to the description given below.
The interferometer. The basis of this device is to split the wavefront of the
incident light into two parts at the beamsplitter. A time-dependent path difference is
created between the two parts, which are then made to recombine at the beamsplitter.
For a white light source a series of pulses are created at the point of zero path
difference. The generation of these pulses of light, their subsequent detection and
conversion into spectral information is discussed below.
A typical Michelson interferometer (Fig. 2.1) operates in the following manner.
Light from the source is directed to the beamsplitter. At the beamsplitter 50% of the
incident light is reflected onto a fixed mirror, while the other 50% is transmitted to
a moving mirror. The two beams are reflected from the two mirrors and recombine
and interfere at the beamsplitter - and again each beam is reflected or transmitted at
the beamsplitter - with 50% of each beam combining and being transmitted to the
detector. Upon recombination at the beamsplitter the path length travelled by the
beams is altered by the moving mirror, and depending on this path difference between
interference occurs for path differences of {n + \I2)X. It can then be shown that the intensity of the transmitted beam I(X), is a function of the optical path difference, %
(cm), and this is given by the equation:
r(%) = 0.5 I(X) {1 + cos InxlX]
In the above equation, the modulated component 0.5 I(X) cos 2tc x/à, is called the
interferogram. The above equation can be rearranged in terms of wavenumbers, v,
(v = 1/X) to the following:
I(%) = 0.5 I(v) cos 271XV
Spectral information can obtained from this sinusoidal interferogram as the amplitude
is directly proportional to the intensity of the transmitted beam, I(v), and its
wavelength is directly proportional to the wavelength of the source. With the
continuous sources used (in the required spectral range) the interferogram is the
integral of the contributions from all the wavelengths emitted from the source.
The Bruker IPS 113v employs a Genzel interferometer (Fig. 2.2), this has a
different optical arrangement in which there are two stationary mirrors which are
coplanar with a moving mirror positioned between them. This has the advantage that
for a mirror displacement of x, the optical retardation changes by Ax, compared with 2% for a standard Michelson interferometer. This occurs because the light is reflected
from two sides of the moving mirror in a Genzel interferometer. Thus the light travels
fixed mirror
continuous i.r
beam splitter
modulated i.r.
movmg imrror
Figure 2.1. Schem atic diagram o f a M ichelson interferometer.
continuous i.r.
-modulated i.r.
fixed mirror
beam splitter
< > moving mirror
J fixed mirror
Advantages of FTIR over dispersive infrared
Fourier-transform infrared spectroscopy has a number of important advantages
over dispersive infrared spectroscopy. These being first Jaquinot’s advantage, a
measure of how much more throughput an interferometer gives due to an aperture
being larger than the slits of a dispersive spectrometer. With the result that the optical
throughput of an interferometer is greater than that of a dispersive spectrometer
operating at the same resolution.
The second and most important advantage is Fellgett’s (Multiplex) advantage.
Acquisition of a spectrum of equal signal-to-noise, resolution, efficiency and source
then it will take m times longer on a dispersive spectrometer. Where, m, the number
of resolution elements is equal to the spectral width divided by the resolution. This
advantage can be interpreted in another way - since we can see that the signal-to-noise
ratio increases with (where n is the number of interferograms to be coadded) - this is that for equal data acquisition times the signal-to-noise ratio of measurements
taken on a Fourier spectrometer will be {mŸ^ times better than on a dispersive spectrometer. This advantage, due to the lack of a spatial wavelength selector (exit
slit) in a Fourier spectrometer, is important for energy limited systems found with
matrix experiments.
A third advantage, known as Connes advantage, relates to the intrinsic ability
of the interferometer to record the frequency accurately, using a He-Ne laser which
accurately measures the displacement of the moving mirror. This advantage enables
the sample spectrum to be more accurately, and repeatably, referenced against a
background spectrum and an absorbance or transmittance spectrum to be calculated.
This is also important as it allows band wavenumbers to be known with confidence.
Another advantage occurs because the resolution of a FTIR spectrometer is
related to the optical path difference between the moving and fixed mirrors. Thus
higher resolutions are obtained by increasing the retardation of the moving mirror.
In comparison, higher resolutions with dispersive spectrometers are achieved by using
of the spectrometer. This advantage makes a Fourier-transform spectrometer more
suitable for high resolution infrared spectroscopy. Stray light has little effect upon the
spectra recorded with FTIR spectrometers, in comparison stray light can cause an
increase in the noise with dispersive spectrometers.
2.4 EXPERIMENTAL EQUIPMENT
The experimental equipment can be broken down into three component parts: (i)
cryogenic and gas handling equipment, (ii) spectroscopic apparatus and (iii) photolysis apparatus. That is the means of generating matrix isolated species, their subsequent
photolysis and the detection of the products of any reactions. Each of these three
topics is discussed below.
2.4.1 CRYOGENIC AND GAS HANDLING EQUIPMENT
The cryogenic and gas handling apparatus is the hardware in which samples are
initially 'matrix’ isolated and subsequently irradiated and studied spectroscopically.
The matrix deposition equipment and gas mixing apparatus will be discussed
separately below. Vacuum technology and the types of different apparatus are well
reported^® and, a number of manufacturer s provide very useful manuals^’ for anyone
contemplating the design and manufacture of an apparatus suitable for matrix
experiments.
Matrix deposition equipment
The centre piece of the matrix experiment is the 'cold window’, on which the
matrix is formed, photolysed and studied spectroscopically. A schematic diagram of
w in dow is housed within a vacuum shroud, w hich enables it to be co o led by means
o f an Air Products D isp lex DE 2 02 S clo sed -cy cle He refrigerator. T he cold w indow
itself is made from caesium iodide, due to the spectral transparency (U V to far-ir) and
thermal properties (good thermal conductivity and is resistant to thermal shock) o f C sl.
The cryostat and cold w indow are arranged vertically within the evacuable shroud, so
that by rotation it may be placed in the correct alignm ent for either deposition,
p hotolysis or spectral collection.
gas deposition lilies
1.1 .
rotatable C sl cold 'window at 14 K
vacuum shroud at 10 torr
A
photolysis radiation (UV, vis or near-ir)
F igu re 2 .3 S h o w s a sc h em a tic o f the c r y o g e n ic c o ld w in d o w and a sso c ia te d sp ectral and p h o to ly s is ligh t
paths, as w e ll as the gas d e p o sitio n lin es.
The vacuum shroud, that houses the cryostat and cold w in dow , has vacuum
con n ection s to an Edwards 63 mm D iffstak diffusion pump backed by an Edwards
m echanical pump. This allow s it to be evacuated to ~ 10'^ torr. The shroud has tw o
gland fittings through w hich steel capillary tubes are passed, these b eing directed so
with three windows: two KBr windows for spectroscopic analysis, and a third made
of quartz, for photolysis. The spectral windows (KBr), due to the design of the
vacuum shroud, are 50 mm in diameter and thus KBr provides the required
mechanical strength and transparency to infrared radiation that is required. It should
be noted that while Csl windows transmit infrared radiation over a wider range, they
are susceptible to 'creep’, which is significant at this larger diameter in addition Csl
windows of this diameter are significantly more expensive than KBr. However, Csl
is a better choice for the cold window than KBr, because KBr is more susceptible to
fracture due to temperature changes (thermal shock).
In addition to the requirements of the experiment mentioned above, the vacuum
shroud has been designed to be reasonably compact, a feature that was important since
it must fit into the sample chamber of the existing spectrometer. The shroud has been
designed also to enable 180° reflectance and Raman scattering to be collected,
although these spectra were not recorded in this work.
Gas handling apparatus
The apparatus includes two gas handling manifolds. These manifolds are used
to prepare the gas, that contains the precursor and argon, to be deposited on the cold
window and to meter the flow to the cold window. The manifolds are arranged as
shown in the schematic (Fig. 2.4), with valves and appropriate connectors to enable
evacuation of the manifolds, deposition of the gaseous mixes onto the cold window,
'Ozone' manifold
to vacuum system
Pyrex finger for making ozone
Substrate manifold
to vacuum system
precursor, e.g. io do ethane Ar
2 1. mixing I can
© - valve; - needle valve ; - Bourdon t)^ e vacuum gauge.
F igu re 2 .4 . S ch em a tic diagram o f the ga s h an d lin g m a n ifo ld s used to m ix the p recu rsors w ith argon
and control the rate o f d ep o sitio n ; o n e is u sed a lso to m ake o z o n e .
2.4.2 SPECTROSCOPIC EQUIPMENT
The deposited matrices are examined spectroscopically using an infrared spectrometer.
The shroud and cryostat, seen previously, are arranged in the sample chamber of a
Bruker model IPS 113v FT-IR spectrometer so that the radiation can be transmitted
through the shroud windows and the Csl cold window itself. The spectrometer
operates in the range 4000 - 560 cm^ with a resolution of 1 cm'^ (higher resolution
studies up to 0.25 cm ' have been used). The spectrometer is equipped with a
germanium-coated KBr beam splitter and liquid-nitrogen-cooled mercury-cadmium-
telluride (MCT) detector. A typical spectrum consists of between 500 and 1000 scans.
The interferograms recorded are coadded and converted to a single beam spectrum by
a fast Fourier-transform algorithm^^ using a zero filling factor of times 2 and Happ-
Genzel apodization.^^ The spectrum of a deposited sample was then ratioed with a
reference spectrum of the cold window before deposition to give a double-beam
absorbtion spectrum.
2.4.3 PHOTOLYSIS EQUIPMENT
Photolysis of the matrices was achieved using an Oriel medium pressure xenon arc
lamp, operating in the wavelength range 2 2 0 - 1 0 0 0 nm, a 1 0 cm water filter was
fitted to reduce the amount of infrared radiation incident on the matrix during
photolysis; otherwise the matrix would warm. The wavelength of radiation incident
on the matrix can be altered by the choice of a number of band pass and cut-off
filters. The pass ranges were checked by collecting UV-vis transmission spectra of
the filters using a Shimadzu UV-vis spectrometer over the range 200 - 1000 nm.
In these experiments photolysis is believed to excite the molecule causing
either rearrangement of the molecule or dissociation, these processes are discussed in
2.5 EXPERIMENTAL TECHNIQUE
The experimental technique discussed below ranges from those used to prepare the
precursors prior to deposition to the experiments actually performed on the matrix
isolated samples themselves. Finally, in this section, the methodology of a typical
experiment is given for the benefit of future workers within this laboratory
2.5.1 PREPARATION OF PRECURSORS
In this work two types of precursors are used; ozone and halogen-containing alkanes.
All of the halogenated hydrocarbons were used with as high a purity as possible (often
better than 99.9 % pure). Before use they were transferred directly into a suitable
Pyrex storage flask fitted with a Youngs tap and Quickfit B14 ground glass socket.
After this they were degassed by repeated freeze-thaw cycles at liquid nitrogen
temperatures with the purity being tested by infrared spectroscopy.
The ozone used in these experiments is made by passing the high voltage static
electric discharge from a Tesla coil through oxygen held in a Pyrex finger. The finger
being immersed in liquid nitrogen to trap any ozone formed. Once sufficient ozone
is formed it is subjected to freeze-thaw cycles to remove impurities as described
above. The oxygen (zero grade) and argon used are supplied by British Oxygen
Company. Isotopically substituted ozone is made in a similar fashion from 97.7 %
' ^ 0 2 (Enritech Enrichment Ltd.) and, mixed ozone ('^Og.^'^OJ is made from a 50:50
mixture of ' ^ 0 2 and ^*0 2
-In these experiments a typical matrix reaction will be occurring between two
substrates, with argon as the matrix material. In order that no thermal reactions occur
(i.e. at room temperature in the gas phase) the substrates are diluted separately with
argon in two different manifolds and deposited onto the Csl cold window where they
mix. The diluted substrates are deposited at a rate of 3 mmolh ' for 8 - 12 h. The
gas to be deposited to form the matrix contains the precursor substrate, S, which must
argon ratio S/Ar ranged between 1:200 to 1:1000, this dilution was carried out in the
gas handling manifolds using manometric techniques. The manifolds are evacuated
and isolated and, since they have a known volume ( - 1 0 cm^), a quantity of precursor
can be added (e.g. 2 cm^) to the manifold by opening the required valves and allowing
the pressure to rise to 2/10 atm. A further valve can be opened to increase the volume
of the manifold to 2 litres (i.e. 2 1 can attached to manifold). A known fraction (in
tenths atm) of argon is then added to achieve the desired S/Ar ratio. Note: the
sensitivity of the vacuum gauges and the desired concentrations require the use of
these manometric techniques. One alternative would be to use a single manifold (~
2 1) and more sensitive vacuum gauges (e.g. Barotron type gauges).
2.5.2 EXPERIMENTS PERFORMED ON THE MATRICES
The types and nature of experiments that have and can be carried out on a matrix are
discussed below. In these studies, wavelength-dependent photolysis and isotopic
substitution have provided the greatest input.
Photolysis studies
Photolysis was required to initiate a reaction between ozone and the halogen-
containing precursors in all the reactions reported below. Wavelength-dependent
photolysis studies provide information as to the actual threshold wavelength required
to initiate a reaction, and by irradiating the matrices with light of ever shortening
wavelength a series of reaction intermediates may be observed, as well as the
threshold at which they form. Studies have also been carried out in which the matrix
is photolysed at a fixed wavelength for ever increasing time periods. Both time- and
wavelength dependent studies have provided large amounts of information with regard
placing the bands into groups having similar photolytic behaviour and hence belonging
to the same species. The time-dependent photolysis studies can also be expanded to
Warming studies
The purpose of warming the matrix is to reduce the rigidity of the matrix
slightly, and allow some of the products in the matrix to diffuse and where possible
form more stable geometries, for example, the geometry of the complex between
ethanal and hydrogen iodide alters slightly after warming, to form a more thermally
stable arrangement. Warming the matrix is carried out simply by selection of the
required temperature using the temperature control unit, which semi-automatically
adjusts the potential applied to the resistive wire wrapped around the cold head of the
cryostat whilst monitoring the temperature. Both argon and oxygen matrices are
warmed to 25 K for up to 25 min in these studies, this temperature is the upper limit
for oxygen matrices, although with argon temperatures up to 35 K could be used
before evaporation of the matrix became significant.
Substrate to argon ratio (S/Ar)
Generally the stoichiometric ratios of reactants is an integral part of the
understanding of any reaction, however in low temperature matrices the deposition of
matrices containing higher or lower concentrations may also result in aggregation and
the detection of interesting spectra of such aggregate products.^ *^ Experiments
varying the S/Ar ratio are very simple to conduct, the precursors are simply diluted
with argon to some known ratio and deposited; subsequent experiments would vary
these ratios to produce matrices with increased or decreased ratios of one or both
precursors. In these studies, the S/Ar ratio was usually chosen so as to produce clear
spectra, with the precursors in reasonable concentrations so that reactions would occur.
Various experiments in which one of the precursors was doubled in relation to the
other showed no real difference in the products formed, however the spectra of the
precursors exhibited the expected increase or decrease in intensity as would be
expected by the associated change in concentration. The reason for this would appear
to be statistical, since at the molecular level two precursors must be near to each other
to react. The deposition creates a random array of precursors, and by increasing the
close enough to react.
Isotopic substitution
Isotopic substitution has been carried out on the precursors in this thesis.
Primarily substitution of to **0 with ozone was carried out, since so many of the
detected species contain an oxygen atom. To a lesser extent deuterated samples have
been used. At the simplest level, after substitution a band assignable to a
molecular vibration that contains an oxygen atom should shift to lower wavenumber
from its position for the isotopomer. Such a shift indicates that the band can be
assigned to a mode that contains some contribution from an oxygen atom. The actual
shift can provide more information as to the mode to which the band can be assigned.
The isotopic shifts use the basic understanding that when an atom in a bond is
substituted for one of different mass, the force constant of the bond in both
isotopomers is constant and thus the shift in vibrational frequency is due to the
difference in mass of the two isotopomers and the type of bond involved.
Wavenumber shifts for various species and their calculation are discussed elsewhere.^'^
Threshold energy calculation
The threshold energy required to cause a charge-transfer reaction to occur can
be calculated by assuming point charges and values for the distances between the
charges. The calculated energy can be subsequently converted into wavelengths which
can be compared with the experimental wavelength used to cause the reaction to
2.5.3 METHODOLOGY OF A TYPICAL EXPERIMENT
This section contains the methodology of a typical ozone-halocarbon reaction, as carried
out in this laboratory.
Equipment set up. This consists of evacuation of the gas handling manifolds,
and cleaning and evacuation of the cryogenic equipment. The latter process requires
that the vacuum shroud be removed and cleaned with solvents (usually methanol), and
when appropriate re-polishing of the Csl cold window. The entire vacuum system
(gas handling & cryogenic apparatus) takes approximately 2 h to evacuate to ~ 1 0 ^
torr.
Preparation of precursors. The precursors are degassed and mixed with
argon in the gas handling apparatus. The time required to manufacture sufficient
ozone (i.e. 2-4 cm^) - by the static discharge method - varies and is heavily dependent
upon the passivation of the stainless steel manifolds (see chapter 8 for discussion of
improvements).
Deposition. The matrices were deposited at ~ 3 mmolh, ’ and the nature of
the apparatus was such that as deposition proceeded the backing pressure would
reduce requiring the metering valves to be opened gradually during the deposition
process. It was found empirically that the 'best' spectra were obtained from matrices
in which the initial deposition rate was significantly less than 3 mmolh ’ and, thus the
following deposition regime was used in the majority of ozone/argon experiments.
Deposition was begun at - 1 mmolh, ' and over two hours the rate was gradually
increased by opening the metering valves (at intervals of ~ 20 min); the increase in
pressure in the vacuum chamber was used as one gauge of the speed of deposition,
the other being the rate at which the pressure in the manifolds reduces. Over the next
hour the metering valves were opened further at reduced intervals and finally, the
valves were opened giving a flow rate of ~ 5-6 mmolh, ' and the deposition was left
running for a further 6 - 8 h. This last flow rate would decrease over the course of the
Spectral collection. After collection of many spectra at resolutions exceeding
0.25 cm^ and with 1000 scans, it became apparent that the time taken to collect
spectra was an important parameter in these experiments, due to the desire to perform
many photolysis and warming cycles on one matrix. To this end reducing the number
of scans to between 500 and 750 and the resolution to 1 cm ' reduced the collection
time from ~ 1.5 h to ~ 25 min with no detrimental effect on the identification of
spectral features. In addition, the interferometer design of the Bruker 113v enabled
these spectra to be collected in approximately half the time of an FTIR instrument
with a Michelson interferometer.
Photolysis and warming cycles. In general the matrices were photolysed for
30 min periods and warmed to 25 K for 25 min. The photolysis period of 30 min was
found to be sufficient in the case of iodine-containing compounds to cause the reaction
of ~ 90 % of the precursors. The experiments in which the halogen atoms where
bromine or chlorine required significantly longer photolysis periods (up to several
hundred hours).
Overall experiment timings. The above constraints of preparation time,
deposition time, spectral collection, photolysis and warming cycles determined the
following typical experiment timing. At the beginning of a new experiment the
equipment is checked (this is usually cleaned and evacuated at the end of the previous
experiment) and the manufacture of ozone begun. During this time the other precursor
is diluted with argon and, the cryostat is switched on and a background spectrum is
recorded. After both precursors have been prepared, the deposition is begun, starting
slowly at first, as mentioned above. After the full deposition period, usually 10-12 h,
the first spectrum is collected. On the basis of earlier experiments (or experience)
various wavelength- or time-dependent photolysis cycles and warming cycles are
performed and, after each of these individual cycles an infrared spectrum is recorded.
During the photolysis or warming cycles the spectra are processed and studied.
Finally, at the end of the experiment the equipment (high vacuum pumps and cryostat)
are switched off, and the matrix material evaporates. Once the ’cold' window has
warmed to room temperature the window is cleaned and the equipment made ready
Chapter 3
REACTION OF ALKYL HALIDES WITH OZONE
3.1 INTRODUCTION
Three alkyl halides are studied in this chapter, iodoethane (section 3.2), bromoethane
(3.3) and 2-iodopropane (3.4), the idea being to detect any products that are formed
after photolysis of the matrices and, by studying the iodo- and bromo-analogues,
compare and contrast not only the photochemistry but the type and nature of the
products formed. Additionally, by studying the reaction of ozone with 2-iodopropane
a comparison of the one-, two-, and three-carbon alkyl iodides can be made.
Additionally, 2-iodopropane, with the iodine atom in the 2-position, may react
differently due to a steric effect.
The photolysis of ozone in low temperature (14-17 K) matrices is a well
known source of atomic oxygen for transfer to substrate molecules. The
photodissociation of ozone can occur by ultraviolet absorption in the intense Hartley
continuum (À < 310 nm) or by visible absorption in the weak Chappuis band (450 -
800 nm). In low temperature matrices, photolysis of ozone in the Chappuis band
results in the formation molecular oxygen and ground state atomic oxygen, 0(^P),
while shorter wavelength irradiation into the Hartley continuum produces molecular
oxygen and excited state atomic oxygen, 0(*D). For a number of ozone substrate
reactions, shorter wavelength radiation (X < 310 nm) was required to initiate any
reaction, e.g. ozone with diiodomethane and those haloalkanes studied in chapter 6 and
7. However, it has been reported that in the presence of certain substrates, photolysis
oxygen atom to the substrateT This is accounted for by the formation of a charge
transfer complex between ozone and the substrate. Molecular complexes of ozone of
this type are known with iodine monochloride/^ iodomethane/° trifluoroiodomethane/^
phosphine,^^ chlorine m onofluoride,arsenic and phosphorus triflu o rid e s,a s well as
sulphur trioxide.^^
Similar studies involving iodomethane and oxygen in an argon matrix"^® and
iodomethane in a solid oxygen'^^ matrix have been carried out, which have led to the
observation of radical species and to the formation of differing photoproducts from
those found in the reaction with ozone. It has been observed'^^ that photolysis of a
solid oxygen matrix with ultraviolet light leads to the formation of ozone via a process
in which molecular oxygen is dissociated to ground state atomic oxygen, 0(^P), which
can then combine with another oxygen molecule to form ozone. Thus photolysis
reactions in solid oxygen matrices can proceed via reaction between atomic oxygen,
0(^P), and the substrate, or via reaction of the subsequently produced ozone with the
substrate.
With species containing iodine^^'^* it has been possible to form previously
unknown inorganic monomeric iodoso- (ZIO), iodyl- (ZIO2) and hypoiodo- (ZOI)
compounds by photolysis of the substrate - ozone complex. Previous to the matrix
isolation experiments there were only a very few known inorganic, aliphatic and
aromatic compounds of these types.
3.2
lODOETHANE, C^Hg!
The study of the reaction of iodoethane and ozone was begun as an extension of the
study by Andrews^® et al. of iodomethane and ozone, the additional interest being that
because of the second carbon atom a number of different reactions might be possible.
As mentioned above, the reaction of ozone with the C-I bond might result in a number
of 1 0 ^ species. Also, since the iodine atom is attached to the a-carbon and one
the H atom is eliminated from the p-carbon producing ethene and HI, or from the a-
carbon producing CH3-CH and HI. Additionally, the C-C bond might rupture producing CH3 and CH2I which could subsequently react with ozone to form a variety
of products.
Whichever products were formed it was hoped to detect their characteristic
infrared spectra and, in so doing, establish mechanisms for the reactions and where
appropriate distinguish between them. The products were identified by employing
deuterated iodoethane, and scrambled ozone ('^0 3 .^'^Oj made from 50:50
3.2.1 RESULTS
The matrices containing iodoethane and ozone were diluted separately with argon at
species-to-argon (CjHgl/Ar) ratios of between 1:100 and 1:400. Iodoethane was also
deposited in a solid oxygen matrix (C2H5I/O2 ratio = 1:150) and with oxygen in an
argon matrix (C2HgI/0 2 /Ar = 1:2:400) in separate experiments. The deposition
conditions (time, rate, temperature, etc.), procedure for collection of spectra, and the
protocol for irradiation and warming the matrix are discussed in chapter 2 .
The spectrum of isolated ozone'^^ '^'^’'^^ deposited in an argon matrix was recorded
and found to be in good agreement with those previously published. The spectrum
of isolated iodoethane was also recorded (Table 3.1) and the bands assigned.
Iodoethane and ozone in argon
Deposition of the argon matrix containing ozone and iodoethane and its
subsequent photolysis created a number of different products. The wavelength ranges
chosen for the photolysis were selected so as to produce isolated photoproducts in a