4217
ANALYSIS OF ELECTRICITY POWER USAGE
PATTERN USING MACHINE LEARNING
ALGORITHMS
Saranya A, Renukadevi G
Abstract- In growing population it is essential to monitor the power consumption. Electrical power is used in various sectors like industries, manufacturing, organization, institution and household applications. Data samples which are used to track the high and low utilization of Electricity Bill EB) power. The proposed work is consisting of four steps; which purely depends on the analysis of collected data. First step is to select the best fitted attributes among the eight different attributes. Then, based on the selected attributes the classification is done with 12 machine learning algorithms. It is used to predict the power utilization in the particular area and also done with comparative result analysis. The above is done with accuracy parameters of True Positive (TP), False Positive (FP), Precision and Recall. The third step is to analyse the pattern among the data samples. Fourth step is to effectively distribute the price based on the usage called peak and non- peak hours. With this experimental analysis people can identify the usage pattern and also be effective price distribution comparing to conventional approaches.
Keywords - Machine Learning, Power Efficiency, Price Distribution, Attribute Selection, Classification and Clustering.
————————————————————
I.
INTRODUCTION
In the modern era, every equipment deals with energy consumption problem because utilization of energy is not met the consideration of energy production [1]. The major factors of energy utilization are deeply analyzed with an efficient improvement which addresses the contradictions of production, supply, and demand of energy in the future [2]. Generally electrical energy cannot be stored for longer time; hence the supply and the demand of the energy must be balanced consistently, which helps for the proficient usage of electrical energy. According to the survey the energy utilization is increased corresponding to the population of factories, household appliances, technology advancements. Optimization is necessary to carry over the efficient energy utilization to resolve the current supply demand problems.[3] Also, the price of the energy affects lifestyle of both normal people and business trends. These determine the further cost of basic needs such as heater in a house or cooler in a factory. In future, there are going to be a situation where without electricity there will not be any vital things on which the life relies. There are two categories through which energy is produced. Renewable, the sources of the energy can be replenished. Basic types are solar, geothermal, wind, biomass, and hydropower. It is said to be 21% of the total world’s electricity is generated from renewable and 12.5% of the total consumption of energy from renewable. Non-renewable, the sources of the energy cannot be replenished. Petroleum products, hydrocarbon gas liquids, natural gas, coal and nuclear energy are the five types of non-renewable resources. 90% of the world consumes energy which is obtained from non-renewable energy.
________________________
Saranya A, Renukadevi G, SRM Institute of Science and Technology,[email protected], [email protected]. Kattankulathur, india
There are few reasons for the increase in the energy investments. First, is there population growth? It is expected that by 2040, the population of whole world exceeds 9 billion. The consistent growth of the population in countries like India and China causes most of the people move from rural to city side. This increase in the consumption of electricity also affects the energy prices. Second is the electricity penetration, in the next two decade both India and other budding companies tries to invest their money on new trend technologies likes smart
power grid to increase their economics status.This is due to the
census that 1.3 billion people around the world do not have access to the electricity and also in India one quarter of people are not able to access electricity. Third one is the Energy
Efficiency Revolution. Keeping all the above-mentioned
factors, three important parameters such as 1) pricing distribution 2) supply-demand ratio and 3) efficient usage of energy are emphasized here. Price distribution in India is still following the conventional methods of cost per unit.
Energy consumption Price = (cost per unit*total unit consumed) ………….(1)
among the data samples to predict the next five years usage pattern. Finally, clustering algorithms are used for identifying the similarity of data samples, which uses to form the groups based on the data sample behaviors. Experimental results are discussed with appropriate graphs and clustering results. Last section is conclusions which summarize the overall workflow of the paper.
II.
LITERATURE SURVEY
The major influenced parameters for energy prediction are energy utilization, production, distribution. Many researches have taken energy scarcity problem into multiple views to improve the utilization of resources with IOT devices, smart appliances, multi-grid distribution approach and an automatic triggering when fault is occurred. Generally, usage of energy is depending on the individuals and business needs. In every aspect of efficiency measurements and influence factors which improvise the efficiency in energy management, it takes to big revolution in power industries. [4] Proposes a method which deals with data mining algorithms of feature recognition and subset evaluation which filters the factors that affects the energy efficiency at large ratios. Eliminating the bad features from over all feature space is studied from feature selection algorithms in data mining. There are two basic approaches [5] used for evaluating the energy efficiency measures called parametric and non-parametric. Parametric approach was defined with attributes and value measurements converted into equation, which has many techniques to solving the equation like Gaussian elimination methods. In non – parametric approach input and outputs are pointed in solution space to take the quantitative analysis to measure the efficiency of energy. The linkage [6] between the efficiency parameters to productivity of the energy is another significant measure. Energy efficiency is calculated by,
Energy Efficiency =
Equation (1) is taken from energy efficiency evaluation method [7], which defines the threshold value and two class labels. If the efficiency is greater than the threshold it takes into consideration of high energy efficiency and low energy efficiency is discarded. There are seven features are considered for [4,8] classifying the data into high and low energy efficiency, normally denoted as 0 for low and 1 for high. The features are energy consumption per unit of GDP, emission coefficient of sulphur dioxide, capital stock, GDP, primary energy output, elasticity coefficient of energy consumption, energy industry investment, and total energy consumption. Another mechanism to predict the energy consumption is Hybrid electric vehicle (HEV) [9] which proposes a strategy of equivalent consumption minimization strategy (ECMS) - for parallel HEVs based on energy prediction (ECMS-EP). The chaining –neural-network methodology is used over different temporal horizons for estimating the energy velocity in energy prediction scheme. Fuel consumption and electrical energy transmission is considered as the key parameters of HEV system. Dynamic modelling approach is followed to continuously monitor the engine model, electrical motor model, battery model, transmission model, vehicle longitudinal dynamic model and driver model. The energy management strategies (EMS) are classified with two techniques [10], [11], one is logical rule-based EMS, which includes and pre-defined rules or fuzzy logic and
4219 production depends on weather conditions. In [30]
priority-based scheduling algorithm is uses for dynamically changing the home appliances usage with respect to usage pattern. The usage pattern of home appliance depends on the three factors are resident activity pattern, environmental factors and state of embedded batteries. Energy storage is an important opportunity to balance the difference in different load demands and supply [31], which can be applied in broad range of industries and utilities. For energy storage in [32] proposes the multicarrier energy systems in a single-family and the network of three interconnected houses energy hubs. Electrical load was supplied by different conversion with different storage technologies. In [33] the author uses, two balancing approaches in neural network models, multilayer perceptron (MLP) network model and knowledge-based neural network (KBNN) model, were used to predict the future solar energy power, through two different training modes of offline and online training. Feature selection and weight updating parameters were additionally added to the network to make it as efficient one. The proposed work of our paper exploits regular pattern for predicting the energy utilization and the objective function is to maximize the throughput of supply and demand energy power consumption.
III.
PROPOSED WORK
Electricity power generation and consumption data has been taken from various sources and test with multiple algorithms of classification and clustering. The proposed scheme of price distribution is helps to the consumer with their usage pattern. It replaces the classical approach of power utilization per unit with cost.
A. Price Distribution
Generally, consumers need to pay a fixed price for every unit that is being consumed. The conventional price distribution method is inefficient because the price of the energy calculation follows without any usage pattern. The objective function is to reduce the user load and also improve the energy utilization in an efficient way. For that based on the energy utilization two scenarios are identified which are peak hour energy usage and non-peak hour energy usage. Peak hour is the particular time range in which majority of the people in the region consumes more electrical energy than the normal utilization. Apart from peak hours, remaining hours are taken as non-peak hours. Peak and non-peak hours cannot be assumed based on the normal people’s living pattern. Since the climate and lifestyle of the people keep changing. So, real time energy consumed data is used to segregate peak and non-peak hours in a day. To do the above segregation hierarchical cluster analysis is implemented.
B. Clustering Algorithms
In order to group the given data and each data is classified in to specific group. It is unsupervised learning and it is used for the analytical purposes. It is highly useful to check on which group the data will fall in to. Many clustering techniques been used here to analyses which clustering techniques works well with the dataset used. Hierarchical Cluster Analysis is an algorithm used to separate large number of data in finite number of clusters. The feature of each cluster is different from each other cluster feature. But the data inside each cluster is similar. The price distribution plays a major role in energy consumption and utilization. Expectation Maximization algorithm (EM) is done
through a statistical model which finds the maximum posteriori (MAP) or maximum likelihood. This algorithm related with the unnoticed latent variables and it is an interactive model. In order to create the expectation of the log likelihood that is been evaluated by the parameters and maximization (M) steps using current estimate. In order to achieve this, the algorithm creates a function and also maximizing the parameter to expected log-likelihood found on each step (E).The EM algorithm seeks to find the MLE of the marginal likelihood by iteratively applying these two steps. One is Expectation step (E step) is define as the expected value of the log likelihood function of with respect to the current conditional distribution of given and the current estimates of the parameters. Other one Maximization step (M step) finds the parameters that maximize this quantity. Farthest-First Clustering is a fast and greedy algorithm. Initially, k numbers of points are grouped to form a cluster. Two centers have to be created. Density Based Spatial Clustering of Application with noise. Given a set of points in some space, it groups together points that are closely packed together (points with many nearby neighbors), marking as outliers points that lie alone in low-density regions (whose nearest neighbors are too far away). DBSCAN is one of the most common clustering algorithms. DBSCAN needs two parameters such as neighborhood of every point and the minimum number of points. K-means Clustering in order to categorize the data in to groups, the feature and the vector value of the data is taken to make k groups of similarity. Euclidean distance measurement is used to calculate the similarity between these groups. Randomly k points are taken, closest mean to each item is found. Through number of iterations each process is executed at the end it produces the clusters.
C.Attribute Selection Algorithms
In this dataset there are 8 attributes are used to predict the household electricity utilization. Some point it will reach to the up and some extreme it will goes down depending upon the utilization. Indentifying the best and most influenced attributes playa a major role in prediction. The most influenced attributes also have the part of less influenced attributes, which is the goal of multivariate analysis.
D.Classification Algorithm
reduce the variance to avoid over fitting. Multiclass Classifier is the problem of classifying instances into one of three or more classes.Tree Based Classifiers are used such as Random Forest is the random forest, individual tree comes under each class classification and which tree gets higher votes is taken as the predicted model. J48 is used to find out the target value from the given dataset and to create univariate decision tree. Decision Stump consists of only one root node or internal node and consecutive two child nodes are present. Thus, decision stump machine learning technique has only one level decision tree. In the random forest, individual tree comes under each class classification and which tree gets higher votes is taken as the predicted model.
IV.
RESULT ANALYSIS
Classification and clustering algorithms are applied over the data samples. Attribute selection algorithms are used to find the rank of the best fit attributes it gives the higher accuracy rather than comparing all attributes. In table 1.1 discussed about the clustering metrics and similarity ratios. There are different scopes of five clustering algorithms are taken for analysis.
Table 1.1 Summarization Clustering Results Name of the
Algorithm
No of Clusters
No. of Instance % of Similarity
EM 06
0-
8533 19%1- 8357 18% 2- 5154 11% 3- 17411 38% 4- 4441 10% 5- 1416 3% Farthest First 02 0- 21526
1- 23786
48% 52% Filtered Cluster 02 0- 22473
1- 22839
50% 50% Density Based
Cluster
02 0- 23753
1- 21559
52% 48% Simple
K-Means
02 0- 22839
1- 22473
50% 50%
In Fig.1 describes the total consumption of electricity power (energy) in India and the distribution of energy among various utilities with respect to the requirements. In this observation nearly 50% of generated power has been utilized by industries and factories. The next highest consumption among other utilities is domestic like household appliances. Domestic applications consume 20-25% of electricity power with total power consumption.
Fig 1. Energy Consumption of other Utilities in India If any of the optimization techniques for resource allocation and utilization is applied in domestic applications then the utilization of the power in domestic (residence) areas can be improved. Remaining utilities are commercial, agricultural, traction, railways and others include small firms, institutions, etc. From the below graph shows the gradual increase in all utilities over the period of 2009 t0 2019 and there is a small decline in the year of 2013 – 2014 there was massive destruction of life and property [34] due to heavy rainfall in various states in India.
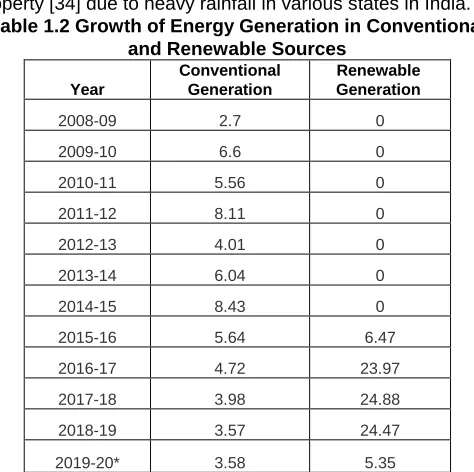
Table 1.2 Growth of Energy Generation in Conventional and Renewable Sources
Year
Conventional Generation
Renewable Generation
2008-09 2.7 0
2009-10 6.6 0
2010-11 5.56 0
2011-12 8.11 0
2012-13 4.01 0
2013-14 6.04 0
2014-15 8.43 0
2015-16 5.64 6.47
2016-17 4.72 23.97
2017-18 3.98 24.88
2018-19 3.57 24.47
2019-20* 3.58 5.35
This table 1.2 shows the growth of energy resources from the conventional and renewable. Starting from 2008 to 2014 there is no standard growth in renewable energy generation because most of the research analysis happens with conventional energy sources. After 2014 people have concentrated to improve the efficiency and effectiveness of renewable energy sources. In table 1.3 there six different types of attribute algorithms are used.
Attribute information Date: date.
Day: day of the week (1-7)
4221 NSWprice: New South Wales electricity price.
NSWdemand: New South Wales electricity on demand.
VICprice: Victoria electricity price. VICdemand: Victoria electricity demand.
Transfer: scheduled electricity transfer between both states.
All values are normalized between 0 and 1.
Table 1.3 Algorithms for Attribute Selection Name of the Algorithm Best Attributes Name
ClassifierAttributeEval
date, vicprice, nswdemand, nswprice, period, day, vicdemand, transfer
CorrelationAttributeEval
nswprice, nswdemand, vicdemand, period, transfer, vicprice, day, date
GainRatioAttributeEval
nswprice, vicprice, nswdemand, period, vicdemand, date, tansfer, day
InfoGainAttributeEval
nswprice, vicprice, period, nswdemand, vicdemand, date, transfer, day
OneRAttributeEval
nswprice, vicprice, date, period, nswdemand, vicdemand, day, transfer
Principle Component Analysis
date, day, period, nswprice, nswdemand, vicprice, vicdemand, transfer
The one attribute of nswprice is identified as the best attribute by four attribute selection algorithms. It is the main factor to decide the low and high electricity price of the particular area. The least valued attributes are considered as date and day. Influence of these attributes are not creates any impacts on the predicted model. As per the cumulative information gain value the percentage of information acquired by the least attributes are also included in the best attributes. It has been calculated with the help of Eigen values and correlation coefficients.
Fig 2. Analysis of Machine Learning Classifiers
Nearly 5000 data samples are taken for implementation of the classification algorithms. Analysis on power consumption with household appliances hit the drastic variation towards correct utilization of resources. Bagging classification gives the highest true positive rate than other algorithms shown in fig 2.
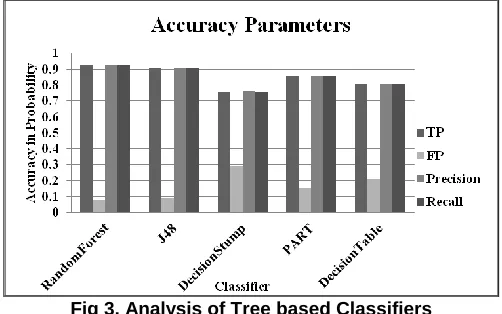
Fig 3. Analysis of Tree based Classifiers
Rules and tree based algorithms are tested with same dataset to acquire the result of high and low utilization of resources. In fig 3 shows the high results on Random Forest and J48 algorithms. With these prediction models demand has been increased over the period and it forces to increase the supply of the electricity power generation. The other factor shows the consumer (people) side they need a optimized approach for paying their electricity bill based on the peak and non peak hours.
IV.CONCLUSION
India is becoming digital country; everything is moving towards automation and digitalization. More power is required for the consumption whereas the power usage is not seen to be efficient one. Due to the above-mentioned factor, power consumption data from various states in India is taken and analysed. Six different clustering techniques such as Hierarchical Cluster Analysis, Canopy clustering, cobweb, Expectation Maximization algorithm, Farthest-First Clustering, Density Based Spatial Clustering of Application with noise are used and dataset behavior is analyzed based on each clustering technique. From Fig 1. A pattern of power usage is formed among various sectors such as Industry, Agriculture, Domestic, Commercial, Transaction and railways and others. Industry seems to have higher and increasing usage of power and it is recommended to use the power more efficiently in the future.
REFERENCE
[1] Guo, Y., Wang, Q., Wan, J., Yang, D., Yu, J. and Zeng, K.,
2019. Provincial Energy Efficiency Prediction in China
Based on Classification Method. IEEE Access, 7,
pp.91602-91611.
[2] Fisher-Vanden, K., Jefferson, G.H., Liu, H. and Tao, Q., 2004. What is driving China’s decline in energy
intensity?. Resource and Energy economics, 26(1),
pp.77-97.
[3] https://commodity.com/energy/
[4] Han, Y., Geng, Z., Zhu, Q. and Qu, Y., 2015. Energy efficiency analysis method based on fuzzy DEA cross-model for ethylene production systems in chemical industry. Energy, 83, pp.685-695.
[5] Boyd, G.A. and Pang, J.X., 2000. Estimating the linkage between energy efficiency and productivity. Energy policy, 28(5), pp.289-296.
multi-model fusion strategy. Cluster Computing, 19(4), pp.1937-1949.
[7] Yang, M., Yang, F. and Chen, X., 2011. On influencing factors affecting China’s energy efficiency: An empirical test based on the VEC model. Resources Science, 33(1), pp.163-168.
[8] Han, S., Zhang, F. and Xi, J., 2018. A real-time energy management strategy based on energy prediction for
parallel hybrid electric vehicles. IEEE Access, 6,
pp.70313-70323.
[9] Martinez, C.M., Hu, X., Cao, D., Velenis, E., Gao, B. and
Wellers, M., 2016. Energy management in plug-in hybrid electric vehicles: Recent progress and a connected vehicles perspective. IEEE Transactions on Vehicular Technology, 66(6), pp.4534-4549.
[10]Zhang, P., Yan, F. and Du, C., 2015. A comprehensive analysis of energy management strategies for hybrid electric vehicles based on bibliometrics. Renewable and Sustainable Energy Reviews, 48, pp.88-104.
[11]Zhou, Z., Xiong, F., Huang, B., Xu, C., Jiao, R., Liao, B., Yin, Z. and Li, J., 2017. Game-theoretical energy management for energy Internet with big data-based
renewable power forecasting. IEEE Access, 5,
pp.5731-5746.
[12]Haupt, S.E. and Kosović, B., 2016. Variable generation power forecasting as a big data problem. IEEE Transactions on Sustainable Energy, 8(2), pp.725-732. [13]Wei, W., Liu, F. and Mei, S., 2015. Distributionally robust
co-optimization of energy and reserve dispatch. IEEE Transactions on Sustainable Energy, 7(1), pp.289-300. [14]Zhou, Z., Xiong, F., Huang, B., Xu, C., Jiao, R., Liao, B.,
Yin, Z. and Li, J., 2017. Game-theoretical energy management for energy Internet with big data-based
renewable power forecasting. IEEE Access, 5,
pp.5731-5746.
[15] Li, L., Yan, B., Yang, C., Zhang, Y., Chen, Z. and Jiang, G., 2015. Application-oriented stochastic energy management for plug-in hybrid electric bus with AMT. IEEE Transactions on Vehicular Technology, 65(6), pp.4459-4470.
[16]Keerthisinghe, C., Verbič, G. and Chapman, A.C., 2014, September. Evaluation of a multi-stage stochastic optimisation framework for energy management of residential PV-storage systems. In 2014 australasian universities power engineering conference (AUPEC) (pp. 1-6). IEEE.
[17]Khalid, M. and Savkin, A.V., 2012. A method for short-term
wind power prediction with multiple observation
points. IEEE Transactions on Power Systems, 27(2), pp.579-586.
[18]Yunus, K., Thiringer, T. and Chen, P., 2015. ARIMA-based
frequency-decomposed modeling of wind speed time series. IEEE Transactions on Power Systems, 31(4), pp.2546-2556.
[19] Zhang, J. and Wang, C., 2013, December. Application of ARMA model in ultra-short term prediction of wind power. In 2013 International Conference on Computer Sciences and Applications (pp. 361-364). IEEE.
[20]Gu, B. and Sheng, V.S., 2016. A Robust Regularization
Path Algorithm for $\nu $-Support Vector
Classification. IEEE Transactions on neural networks and learning systems, 28(5), pp.1241-1248.
[21] Gu, B., Sheng, V.S., Tay, K.Y., Romano, W. and Li, S., 2014. Incremental support vector learning for ordinal
regression. IEEE Transactions on Neural networks and learning systems, 26(7), pp.1403-1416.
[22]Yang, L., He, M., Zhang, J. and Vittal, V., 2015.
Support-vector-machine-enhanced markov model for short-term wind power forecast. IEEE Transactions on Sustainable Energy, 6(3), pp.791-799.
[23]Methaprayoon, K., Yingvivatanapong, C., Lee, W.J. and Liao, J.R., 2007. An integration of ANN wind power
estimation into unit commitment considering the
forecasting uncertainty. IEEE Transactions on Industry Applications, 43(6), pp.1441-1448.
[24]Hosseini-Asl, E., Zurada, J.M. and Nasraoui, O., 2015. Deep learning of part-based representation of data using sparse autoencoders with nonnegativity constraints. IEEE
transactions on neural networks and learning
systems, 27(12), pp.2486-2498.
[25]Zhang, C.Y., Chen, C.P., Gan, M. and Chen, L., 2015. Predictive deep Boltzmann machine for multiperiod wind speed forecasting. IEEE Transactions on Sustainable Energy, 6(4), pp.1416-1425.
[26]Thirukovalluru, R., Dixit, S., Sevakula, R.K., Verma, N.K. and Salour, A., 2016, June. Generating feature sets for fault diagnosis using denoising stacked auto-encoder. In 2016 IEEE International Conference on Prognostics and Health Management (ICPHM) (pp. 1-7). IEEE.
[27]Niyato, D., Lu, X. and Wang, P., 2011.
Machine-to-machine communications for home energy management system in smart grid.
[28]Byun, J., Hong, I. and Park, S., 2012. Intelligent cloud home energy management system using household appliance priority based scheduling based on prediction of renewable energy capability. IEEE Transactions on Consumer Electronics, 58(4), pp.1194-1201.
[29]International Energy Agency, 2005. Variability of wind power and other renewables: management options and strategies. International Energy Agency.
[30]Adamek, F., Arnold, M. and Andersson, G., 2013. On
decisive storage parameters for minimizing energy supply costs in multicarrier energy systems. IEEE Transactions on Sustainable Energy, 5(1), pp.102-109.
[31]Liu, Q. and Zhang, Q.J., 2015. Accuracy improvement of energy prediction for solar-energy-powered embedded systems. IEEE Transactions on Very Large Scale Integration (VLSI) Systems, 24(6), pp.2062-2074.