UNIVERSITI TEKNIKAL MALAYSIA MELAKA
A FIBER OPTIC SENSOR ON ALKALINE LEVEL DETECTION
USING BEAM-THROUGH TECHNIQUE.
This report is submitted in accordance with the requirement of the Universiti Teknikal Malaysia Melaka (UTeM) for the Bachelor of Electronic Engineering Technology
(Telecommunications) with Honours
by
NUR AFIFFA BINTI ISA B071410768
930913-01-6148
BORANG PENGESAHAN STATUS LAPORAN PROJEK SARJANA MUDA
TAJUK: A FIBER OPTIC SENSOR ON ALKALINE LEVEL DETECTION USING BEAM-THROUGH TECHNIQUE.
SESI PENGAJIAN: 2017/2018 Semester 1
Saya NUR AFIFFA BINTI ISA
mengaku membenarkan Laporan PSM ini disimpan di Perpustakaan Universiti Teknikal Malaysia Melaka (UTeM) dengan syarat-syarat kegunaan seperti berikut:
1. Laporan PSM adalah hak milik Universiti Teknikal Malaysia Melaka dan penulis. 2. Perpustakaan Universiti Teknikal Malaysia Melaka dibenarkan membuat salinan untuk
tujuan pengajian sahaja dengan izin penulis.
3. Perpustakaan dibenarkan membuat salinan laporan PSM ini sebagai bahan pertukaran antara institusi pengajian tinggi.
** Jika Laporan PSM ini SULIT atau TERHAD, sila lampirkan surat daripada pihak berkuasa/organisasi berkenaan dengan menyatakan sekali sebab dan tempoh laporan PSM ini perlu dikelaskan sebagai SULIT atau TERHAD.
UNIVERSITI TEKNIKAL MALAYSIA MELAKA
(Mengandungi maklumat yang berdarjah keselamatan atau kepentingan Malaysia sebagaimana yang termaktub dalam AKTA RAHSIA RASMI 1972)
SULIT
(Mengandungi maklumat TERHAD yang telah ditentukan oleh organisasi/badan di mana penyelidikan dijalankan)
TERHAD
TIDAK TERHAD
Alamat Tetap:
BATU 15 ½ ANJUNG BATU 2,
JALAN MUAR, 84900
TANGKAK JOHOR.
TARIKH : _________________
Disahkan Oleh :
Cop Rasmi
i
DECLARATION
I hereby, declared this report entitle „A FIBER OPTIC SENSOR ON ALKALINE LEVEL DETECTION USING BEAM-THROUGH TECHNIQUE„
is the result of my own research except as cited in references.
Signature : ……… Author‟s Name : NUR AFIFFA BINTI ISA Matric Number : B071410768
ii
APPROVAL
This report is submitted to the Faculty of Engineering Technology of UTeM as a partial fulfilment of the requirement for the degree of Bachelor of Engineering Technology Electronic (Telecommunication) (Hons.). The member of the supervisory is as follow:
Signature : ……… Name of Supervisor : MOHD KHANAPIAH BIN NOR Position : SUPERVISOR
iii
ABSTRAK
iv
ABSTRACT
v
DEDICATION
Every challenging work needs self efforts as well as guidance of elders especially those who were very close to our heart. This humble effort specially dedicated to my sweet and loving parents and family.
Special dedicated to my family;
Isa Bin A. Bakar Latifah Binti Abdullah Salim
vi
ACKNOWLEDGMENTS
vii
TABLE OF CONTENT
DECLARATION i
APPROVAL ii
ABSTRAK iii
ABSTRACT iv
DEDICATION v
ACKNOWLEDGMENTS vi
TABLE OF CONTENT vii
TABLE OF FIGURE ix
LIST OF TABLE xi
LIST OF ABBREVATIONS, SYMBOLS AND NOMENCLATURES xv
CHAPTER 1 - INTRODUCTION 1
1.1 Project Background 1
1.2 Problem Statement 2
1.3 Objective 2
1.4 Scope 3
CHAPTER 2 – LITERATURE REVIEW 4
2.1 Introduction of Fiber Optic 4
2.2 Introduction of Fiber Optic Sensor 11
2.3 pH Alkaline Properties 17
2.4 The Future of Fibre Optic Sensor 20
CHAPTER 3 - METHODOLOGY 21
3.1 Introduction 21
3.2 Flow of Project 21
3.3 Process Flow Chart 22
3.4 The Concept of Choosing Parameter 24
3.5 The Concept of Developing „FOS‟ 24
3.6 Preparation of „FOS‟ cable 26
viii
3.8 “FOS” Design Specification 30
3.9 Fiber Optic Test 31
CHAPTER 4 – RESULT AND DISCUSSION 32
4.1 Introduction 32
4.2 Analysis of Light Source Efficiency using Regression Technique for pH 8 liquid of Alkaline.
33
4.3 Analysis of Light Source Efficiency using Regression Technique for pH 9 liquid of Alkaline.
46
4.4 Analysis of Light Source Efficiency using Regression Technique for pH 10 liquid of Alkaline.
63
4.5 Analysis of Light Source Efficiency using Regression Technique for pH 11 liquid of Alkaline.
77
4.6 Analysis of Light Source Efficiency using Regression Technique for pH 12 liquid of Alkaline.
92
4.7 Total Data Analyse By Using Single Mode Based On The Highest Sensitivity Each pH Level
110
4.8 Total Data Analyse By Using Multimode Based On The Highest Sensitivity Each pH Level
111
CHAPTER 5 – CONCLUSION & FUTURE WORK 112
5.1 Introduction 112
5.2 Conclusion 112
5.3 Recommendations for Future Work 114
REFERENCES 115
ix
TABLE OF FIGURE
2.1(a) An Optical Fiber is a Cylindrical Dielectric Waveguide 4
2.1(b) Optical Fiber Configuration 5
2.1.1 Different Types of Fibres 7
2.1.2 Scattering in an Optical Fiber 8
2.2.2(a) Basic Components of an Optical Fiber Sensor System 13 2.2.2(b) Extrinsic and intrinsic types of fiber optic sensors 13
2.2.3(a) Chemical Sensor 15
2.2.3(b Physical sensor 15
2.2.3(c) Bio Medical Sensor 16
2.3.1: pH Scale 18
2.3.2 Colour Changes Strips 18
3.5(a) Light Reflecting Behaviour 25
3.5(b) Fiber Optic Sensing System 25
3.7.2 Jacket Stripper 28
3.7.3 Fiber Optic Cleaver 28
3.7.4 Fusion Splicer 29
3.7.5 Alcohol 29
3.7.6 ASE (Amplitude Spontaneous Emission) 30
x
xi
LIST OF TABLE
4.2.1 Time Analysis for pH 8 liquid of alkaline by using Single Mode
Fiber 33
4.2.1.1 Regression Analysis for pH 8 at 850 nm by using Single Mode
Fiber Optic Cable 34
4.2.1.2 Regression Analysis for pH 8 at 1300 nm by using Single Mode
Fiber Optic Cable 35
4.2.1.3 Regression Analysis for pH 8 at 1310 nm by using Single Mode
Fiber Optic Cable 36
4.2.1.4 Regression Analysis for pH 8 at 1550 nm by using Single Mode
Fiber Optic Cable 37
4.2.2 Time Analysis for pH 8 liquid of alkaline by using Multimode
Mode Fiber 38
4.2.2.1 Regression Analysis for pH 8 at 850 nm by using Multimode
Fiber Optic cable 39
4.2.2.2 Regression Analysis for pH 8 at 1300nm by using Multimode
Fiber Optic cable 40
4.2.2.3 Regression Analysis for pH 8 at 1310nm by using Multimode
Fiber Optic cable 42
4.2.2.4 Regression Analysis for pH 8 at 1550nm by using Multimode
Fiber cable 44
4.2.3 Responsiveness of Fiber Optic Sensor at λ= 850nm, 1300nm,
1310nm and 1550nm in pH 8 Liquid of Alkaline 44 4.3.1 Time Analysis for pH 9 liquid of alkaline by using Single Mode
Fiber 46
4.3.1.1 Regression Analysis for pH 9 at 850 nm by using Single Mode
Fiber cable 48
4.3.1.2 Regression Analysis for pH 9 at 1300 nm by using Single Mode
Fiber cable 50
4.3.1.3 Regression Analysis for pH 9 at 1310 nm by using Single Mode
xii
4.3.1.4 Regression Analysis for pH 9 at 1550 nm by using Single Mode
Fiber cable 53
4.3.2 Time Analysis for pH 9 liquid of alkaline by using MultiMode Fiber
54
4.3.2.1 Regression Analysis for pH 9 at 850 nm by using Multimode
Fiber cable 56
4.3.2.2 Regression Analysis for pH 9 at 1300 nm by using Multimode
Fiber cable 57
4.3.2.3 Regression Analysis for pH 9 at 1310 nm by using Multimode
Fiber cable 58
4.3.2.4 Regression Analysis for pH 9 at 1550 nm by using Multimode
Fiber cable 60
4.3.3 Responsiveness of Fiber Optic Sensor at λ= 850nm, 1300nm,
1310nm and 1550nm in pH 9 Liquid of Alkaline 61 4.4.1 Time Analysis for pH10 liquid of alkaline by using Single Mode
Fiber 63
4.4.1.1 Regression Analysis for pH 10 at 850 nm by using Single Mode
Fiber cable 65
4.4.1.2 Regression Analysis for pH 10 at 1300nm by using Single Mode
Fiber cable 66
4.4.1.3 Regression Analysis for pH 10 at 1310nm by using Single Mode
Fiber cable 67
4.4.1.4 Regression Analysis for pH 10 at 1550 nm by using Single Mode
Fiber cable 68
4.4.2 Time Analysis for pH 10 liquid of alkaline by using Multimode
Fiber 69
4.4.2.1 Regression Analysis for pH 10 at 850 nm by using Multimode
Fiber cable 70
4.4.2.2 Regression Analysis for pH 10 at 1300nm by using Multimode
Fiber cable 71
4.4.2.3 Regression Analysis for pH 10 at 1310 nm by using Multimode
xiii
4.4.2.4 Regression Analysis for pH 10 at 1550 nm by using Multimode
Fiber cable 74
4.4.3 Responsiveness of Fiber Optic Sensor at λ= 850nm, 1300nm,
1310nm and 1550nm in pH 10 Liquid of Alkaline 75 4.5.1 Time Analysis for pH 11 liquid of alkaline by using Single Mode
Fiber 77
4.5.1.1 Regression Analysis for pH 11 at 850 nm by using Single Mode
Fiber cable 79
4.5.1.2 Regression Analysis for pH 11 at 1300 nm by using Single Mode
Fiber cable 81
4.5.1.3 Regression Analysis for pH 11 at 1310 nm by using Single mode
Fiber cable 82
4.5.1.4 Regression Analysis for pH 11 at 1550 nm by using Singlemode
Fiber cable 84
4.5.2 Time Analysis for pH 11 liquid of alkaline by using Multimode
Fiber 85
4.5.2.1 Regression Analysis for pH 11 at 850 nm by using Multimode
Fiber cable 86
4.5.2.2 Regression Analysis for pH 11 at 1300 nm by using Multimode
Fiber cable 87
4.5.2.3 Regression Analysis for pH 11 at 1310 nm by using Multimode
Fiber cable 88
4.5.2.4 Regression Analysis for pH 11 at 1550 nm by using Multimode
Fiber cable 89
4.5.3 Responsiveness of Fiber Optic Sensor at λ= 850nm, 1300nm, 1310nm and 1550nm in pH 11 Liquid of Alkaline
90
4.6.1 Time Analysis for pH 12 liquid of alkaline by using Single Mode
Fiber 92
4.6.1.1 Regression Analysis for pH 12 at 850 nm by using Single Mode
Fiber cable 94
4.6.1.2 Regression Analysis for pH 12 at1300nm by using Single Mode
xiv
4.6.1.3 Regression Analysis for pH 12 at 1310 nm by using Single Mode
Fiber cable 98
4.6.1.4 Regression Analysis for pH 12 at 1550 nm by using Single Mode
Fiber cable 99
4.6.2 Time Analysis for pH 12 liquid of alkaline by using Multi Mode
Fiber 100
4.6.2.1 Regression Analysis for pH 12 at 850 nm by using Multimode Fiber cable
102
4.6.2.2 Regression Analysis for pH 12 at 1300 nm by using Multimode
Fiber cable 104
4.6.2.3 Regression Analysis for pH 12 at 1310 nm by using Multimode
Fiber cable 106
4.6.2.4 Regression Analysis for pH 12 at 1550 nm by using Multimode
Fiber cable 107
4.6.3 Responsiveness of Fiber Optic Sensor at λ= 850nm, 1300nm,
1310nm and 1550nm in pH12 Liquid of Alkaline 108 4.7 Responsiveness of Fiber Optic Sensor at λ= 850nm, 1300nm,
1310nm and 1550nm Based on Sensitivity by using Single Mode
Fiber Cable 110
4.8 Responsiveness of Fiber Optic Sensor at λ= 850nm, 1300nm, 1310nm and 1550nm Based on Sensitivity by using Multimode
xv
LIST OF ABBREVATIONS, SYMBOLS AND NOMENCLATURES
ASE - Amplified Spontaneous Emission
dB - Decibels
DWDM Dense Wavelength Division Multiplexing
EMI - Electromagnetic Interference
FOS - Fibre Optic Sensor
FYP - Final Year Project
LED - Light Emitting Diode
OSA - Optical Spectrum Analyzer
OTDR Optical Time Domain Reflectometer
pH - Power Of Hydrogen
SMF - Single-mode fiber
t - Time
TCF - Thin Core Fiber
1
CHAPTER 1
INTRODUCTION
1.1 Project Background
The fiber optic sensors also called as optical fiber sensors utilize optical fiber or detecting component. Other than detection of pH determination, these sensors are also utilized to detect a few amounts like temperature, pressure, vibrations, displacements, rotations or concentration of chemical species. Fiber have such a variety of uses in the field of remote detecting since they require no electrical power at the remote area. The fiber optic sensor has an optical fiber associated with a light source to take into account recognition in tight spaces or where a little profile is gainful. Fiber optic sensors are incomparable for harsh conditions, including noise, high vibration, extreme heat, wet and unstable situations. These sensors can undoubtedly fit in small areas and can be situated accurately wherever adaptable fiber are required.
2
An alkaline pH level was measure by using a pH meter and litmus papers. In this project focuses on develop of fiber optic sensor of alkaline pH detection for pharmaceutical industries. Development of the fiber optic sensor that has to be able to test the pH level that relate closely to the sensor efficiency in testing the alkalinity substance.
1.2 Problem Statement
Nowadays, the fiber optic sensor in market these days are basically connected with to be used for measuring alkaline pH level, however through changing the association of the course of action the sensor can be tuned to respond to different trigger boost, for instance, pH reaction. The standard technique used for pH level detection was used a pH meter or litmus papers. However, this strategy required exactness when measuring convincing pH plans, liquid suspensions of normal matter or low ionic quality arrangements. Fortunately, these restrictions could be overcome by using optical pH sensors and fiber optic pH sensors. It is exceptionally reasonable to supplant the current customary sensor to detect the alkaline pH level as a result of it phenomenal qualities as far as qualities to the extent precision, offer ease, insignificant exertion and non-contact sort detecting which ready to perform without reaching the example. Additionally, development and trial of a sensor for recognizing the nearness of alkaline as a component of position along an optical fiber length.
1.3 Objective
Student should be able to:
1. To understand or to study about fiber optic sensor.
2. To develop fiber optic sensor for alkaline level detection using beam through technique.
3
1.4 Scope
The scopes of this project are following below:
1. The review and comprehension of fiber optic sensor in alkaline pH level detection.
2. Conduct the experiment using fiber optic to test alkaline solution.
3. Locate the true result of estimation to demonstrate the execution of alkaline pH level.
4. The examination of the outcome utilizing factual procedure. 5. Enhancing the robustness of the plan or procedure to variety.
4
CHAPTER 2
LITERATURE REVIEW
2.1 Introduction of Fiber Optic
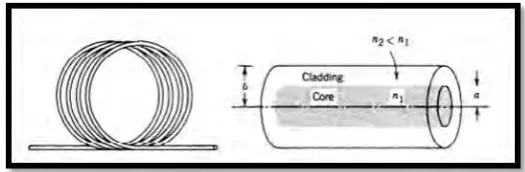
An optical fiber is a round and hollow dielectric wave-guide made of low-misfortune materials, for example, silica glass. It has a focal center in which the light is guided, implanted in an external cladding of marginally lower refractive index (Figure 2.1(a)). Light beams occurrence on the center cladding limit at points more noteworthy than the critical angle experience add up to internal reflection and are guided through the center without refraction. Beams of more noteworthy slant to the fiber hub lose some portion of their power into the cladding at every reflection and are not guided.
Figure 2.1(a): An Optical Fiber is a Cylindrical Dielectric Waveguide
[image:21.595.202.465.474.560.2]5
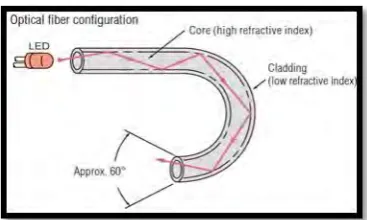
Figure 2.1(b): Optical Fiber Configuration.
The core is divide into the following type:
A. Plastic Type
The core of the plastic-fiber comprises of at least one acrylic-resin fiber 0.25 to 1 mm 0.01" to 0.04" in distance across, encased in a polyethylene sheath. Plastic fiber are light, practical, and adaptable which is the reason they are the most widely recognized kind of fiber sensor.
B. Glass Type
The glass-fiber comprises of 10 to 100 μm 0.39 to 3.94 Mil distance across glass fiber encased in stainless steel tubing. This permits it to be utilized at high working temperatures (350°C 662°F max.).
[image:22.595.243.427.70.180.2]6
2.1.1 Type of Fiber Optic
The fiber is a dielectric waveguide comprising of discrete number of propagation modes. In light of the modes, the fiber can be classified as single and multimode furthermore, are talked about as underneath:
A. Multimode Fibre
It has bigger core diameter and relative refractive index than single mode fiber and permits expansive number of modes for the light beams to go through it. These fibers might be additionally arranged as:
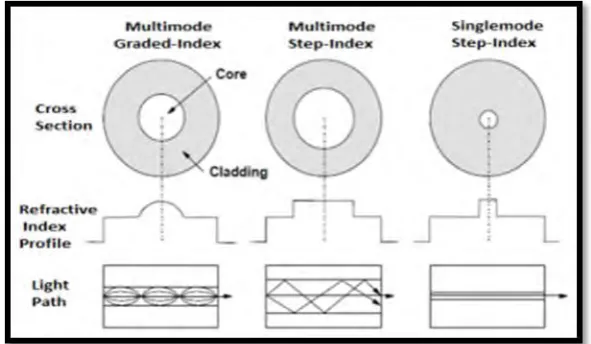
i. Multimode Step-Index Fibre
The refractive index of the center is uniform all through and experiences an unexpected or step change at the center cladding limit. Due to its bigger center size (typically 100 µm), more light can be coupled into this sort of fiber. Notwithstanding, there is commonly more signal loss and additionally more signal distortion because of the various ways of light signal that may continue with this bigger fiber.
ii. Multimode Graded-Index Fibre
7
B. Single mode Fibre
It has little center and just a single pathway of light. The contrast between the refractive index of the center and the cladding is little. SMF has a higher capacity to transmit data as it can hold the loyalty of each light pulse over longer separations and displays no scattering created by the different modes. It has too bring down fiber attenuation than multimode fiber. Its faults are its littler center width making the coupling light into the center more troublesome, troublesome manufacture and higher cost. SMF likewise called single mode step index fiber is examined as underneath:
i. Single Mode Step-Index fibre
[image:24.595.187.483.445.617.2]It has fundamentally littler focal center measurement (ranging from 8-12 µm) than any of the multimode fiber. Light beams, that enter the fiber, either propagate down the center or are reflected as it were few circumstances. All beams around take after a similar time to travel to every part of the length of the fiber. The cross segment, refractive index profile and light way for various sorts of filaments are appeared in Figure 2.1.1.