Development at Age 36 Months in Children
With Deformational Plagiocephaly
WHAT’S KNOWN ON THIS SUBJECT: Infants and toddlers with deformational plagiocephaly (DP) score lower on developmental measures than children without DP and lower than expected relative to test norms.
WHAT THIS STUDY ADDS: This study is thefirst to examine developmental outcomes in preschool-aged children with DP relative to demographically similar children without DP using a standardized, clinician administered assessment.
abstract
OBJECTIVES: Infants and toddlers with deformational plagiocephaly (DP) have been shown to score lower on developmental measures than unaffected children. To determine whether these differences persist, we examined development in 36-month-old children with and without a history of DP.
METHODS:Participants included 224 children with DP and 231 children without diagnosed DP, all of who had been followed in a longitudinal study since infancy. To confirm the presence or absence of DP, pedia-tricians blinded to children’s case status rated 3-dimensional cranial images taken when children were 7 months old on average. The Bayley Scales of Infant and Toddler Development, Third Edition (BSID-III) was administered as a measure of child development.
RESULTS:Children with DP scored lower on all scales of the BSID-III than children without DP. Differences were largest in cognition, language, and parent-reported adaptive behavior (adjusted differences = –2.9 to –4.4 standard score points) and smallest in motor development (adjusted difference = –2.7). Children in the control group who did not have previously diagnosed DP but who were later rated by pediatricians to have at least mild cranial deformation also scored lower on the BSID-III than unaffected controls.
CONCLUSIONS:Preschool-aged children with a history of DP continue to receive lower developmental scores than unaffected controls. These
findings do not imply that DP causes developmental problems, but DP may nonetheless serve as a marker of developmental risk. We encourage clinicians to screen children with DP for developmental concerns to facilitate early identification and intervention.
Pediatrics2013;131:e109–e115
AUTHORS:Brent R. Collett, PhD,a,bKristen E. Gray, MS,c Jacqueline R. Starr, PhD,c,d,eCarrie L. Heike, MD,f,gMichael L. Cunningham, MD, PhD,f,gand Matthew L. Speltz, PhDa,b
Departments ofaPsychiatry and Behavioral Sciences, cEpidemiology, andfPediatrics, University of Washington, Seattle,
Washington; Department ofbPsychiatry and Behavioral Medicine,
andgSeattle Children’s Craniofacial Center, Seattle Children’s
Hospital, Seattle, Washington;dDepartment of Clinical and
Translational Research, The Forsyth Institute, Cambridge, Massachusetts; andeDepartment of Oral Health Policy and
Epidemiology, Harvard School of Dental Medicine, Boston, Massachusetts
KEY WORDS
plagiocephaly, developmental assessment, preschool age, Back to Sleep
ABBREVIATIONS
3D—3 dimensional
BSID-III—Bayley Scales of Infant and Toddler Development, Third Edition
CI—confidence interval DP—deformational plagiocephaly RR—relative risk
SES—socioeconomic status
Dr Collett assisted in study conceptualization and design, participated in recruitment and data collection, supervised infant/toddler examiners, led data analyses, drafted the initial manuscript, and approved thefinal manuscript as submitted; Ms Gray assisted with conceptualization and study design, particularly data analyses and interpretation; assisted with manuscript preparation; provided a critical review of the manuscript; and approved thefinal manuscript as submitted; Dr Starr assisted in conceptualization and study design, particularly data analyses and interpretation; provided a critical review of the manuscript; and approved thefinal manuscript as submitted; Dr Heike assisted with conceptualization and study design, particularly collection of 3-dimensional cranial imaging data; provided a critical review of the manuscript; and approved thefinal manuscript as submitted; Dr Cunningham assisted with study conceptualization and design, provided medical oversight during participant enrollment (eg, to determine eligibility when questions arose for children with other medical conditions), provided a critical review of the manuscript, and approved the
final manuscript as submitted; and Dr Speltz conceptualized and designed the study, obtained National Institutes of Health funding, supervised data collection, assisted with data analyses and interpretation, provided a critical review of the manuscript, and approved thefinal manuscript as submitted.
(Continued on last page)
fl
to external forces. The prevalence of DP in the United States has increased from 5% in the 1990s to 20% to 30% at present,1–3
an increase largely attributed to the successful “Back to Sleep” campaign.4
Many clinicians consider DP to be a mi-nor cosmetic condition, although DP has been associated with heightened risk for developmental delays in infants and toddlers.5–10Data on the persistence of
DP-associated delays are less consis-tent.11–13Existing studies are limited by
the use of parent observations rather than clinician-administered measures, and most have relied on retrospective evaluations of development and com-parisons to test norms.
To determine whether DP is associated with development from diagnosis through age 3 years, we initiated a longitudinal study of 235 children diagnosed with DP and 237 demographically similar controls. Participants were previously assessed at an average age of 7 and 18 months (Time 1 and Time 2, respec-tively) using the Bayley Scales of Infant and Toddler Development–Third Edition (BSID-III).14At both assessments,
chil-dren with DP received lower BSID-III scores than controls.5,10 In this study,
we sought to examine whether (1) these group differences persisted at age 36 months (Time 3), (2) findings were altered by participation in de-velopmental interventions, and (3) outcomes among cases were affected by demographic and clinical variables.
METHODS Participants
Participants were enrolled after obtain-ing informed consent usobtain-ing procedures approved by the Institutional Review Board at Seattle Children’s Hospital.
Infants With DP
The parents of infants with DP were approached for participation at the
’
Center (see Speltz et al10). Patients were
eligible if they had been diagnosed with DP by a craniofacial specialist, were aged 4 to 11 months, and families were able to complete a study visit within 4 weeks of the child’s diagnosis. Exclu-sions were (1) history of prematurity (,35 weeks’gestation); (2) a diagnosed neurodevelopmental condition, brain injury, or significant hearing or vision impairment; (3) presence of a major malformation or$3 minor extracranial anomalies15; (4) a non-English-speaking
mother; (5) history of adoption or out-of-home placement; and (6) family plans to move out of state before project completion. We recruited 235 infants with DP between June 2006 and February 2009, representing 52% of eligible patients. Participants were similar to nonparticipants with re-gard to demographic characteristics and DP severity.10
Infants Without DP
In addition to the exclusions listed for infants with DP, infants without DP were excluded if they had been diagnosed with DP or any other craniofacial anomaly. Thefirst 8 infants in this group were identified through pediatric prac-tices. Remaining infants were identified from a pool of families who agreed to be contacted for research participation when their child was born. Parents were contacted by phone when their child was 4 to 11 months old, and those who expressed interest in the project were screened to determine eligibility. We selected controls who were most similar to infants in the DP cohort in terms of infants’age, gender, ethnicity, and family socioeconomic status (SES).16
Two hundred thirty-seven infants with-out known DP were recruited between March 2007 and February 2009, repre-senting 90% of those eligible for partic-ipation. Twenty-seven families declined participation.
Severity of Cranial Deformation
Three-dimensional (3D) cranial images were obtained during participants’ Time 1 study visit using the 3dMD Cranial System (see Speltz et al10). Images were
deidentified, randomly sorted, and rated for severity by 2 craniofacial pedia-tricians (MC and CH) who were unaware of DP status. A 4-point ordinal scale (none, mild, moderate, severe) was used to rate cranial deformation. The mean of the 2 raters’ scores was used to represent the overall severity of each participant’s cranial deformation. Interrater agreement (weightedk) was 0.72 for severity category and (k) 0.80 for the presence or absence of any deformation.
Bayley Scales of Infant and Toddler Development, Third Edition (BSID-III)
The BSID-III14yields composite scores
items (k) was 0.84 to 0.90. Mothers were asked to complete the BSID-III adaptive development scale and return the form by mail.
Medical and Intervention History
Interviews were completed with moth-ers at Time 1 to document demographic characteristics and medical history, including history of suspected or
con-firmed torticollis. At Time 3, an abbre-viated interview was conducted for cases and controls to obtain informa-tion about newly diagnosed medical conditions and participation in de-velopmental interventions. Because the duration of services varied, partic-ipants were only classified as receiving an intervention if they had$4 treatment sessions or$2 months of monitoring in a “Birth-to-Three” early intervention program. These cutoffs were used to differentiate children receiving only assessments from those participating in ongoing intervention. For cases, the Time 3 interview also documented the use of orthotic treatments for DP.
Assessment Procedures
We scheduled participants’Time 3 visit within 12 weeks of the child’s 3-year birthday and set an upper age limit of 42 months. Parents unable to partici-pate in a full assessment completed the interview by phone and were mailed the BSID-III adaptive behavior scale. After testing, psychometrists in-dicated whether they considered the evaluation “valid” or “invalid” due to child behavior (eg, noncompliance) or testing circumstances (eg, child ill-ness). One or more BSID-III scores were dropped for 1 child with DP and 6 children without DP due to examiner ratings of invalidity.
Data Analyses
We used pediatricians’ratings of Time 1 3D surface images to categorize par-ticipants into 3 groups: DP Cases
(infants with a diagnosis of DP,
con-firmed with clinician ratings), Unaf-fected Controls (infants with no previous diagnosis of DP and no evidence of DP with clinician ratings), and DP Controls (infants without previously diagnosed DP but detectable dysmorphology based on our pediatricians’ ratings of 3D images).
Linear regression analyses with robust standard errors were used to compare Time 3 standard scores for DP cases and unaffected controls on the BSID-III cognitive, language, motor, and adap-tive behavior composites. We also ex-amined differences in scaled scores on BSID-III language and motor subscales. In categorical analyses, we used Pois-son regression models with robust standard errors to estimate the relative risk (RR) of children with and without DP receiving a standard score,85 on the BSID-III composite scales, a conven-tional threshold for risk of develop-mental delay. We adjusted all analyses for children’s age (in months), gender, race/ethnicity (white and non-Hispanic vs non-White or Hispanic), and SES.
In secondary analyses, we used linear regression to compare average BSID-III scores of unaffected controls and DP controls. Among cases, we examined developmental outcomes as a function of initial severity, coded as “mild” or
“moderate to severe.” In separate re-gression analyses, we also examined developmental outcomes among cases as a function of children’s gender; his-tory of suspected or confirmed torti-collis; and history of orthotic treatment. In addition to adjusting for demographic covariates, we adjusted these analyses for Time 1 DP severity (continuous).
The foregoing analyses do not account for the fact that some children received developmental interventions before being assessed. This could bias case-control differences toward the null because these interventions were far more common among DP cases (see
Table 1) and may have improved their developmental outcomes on average. We therefore repeated the primary analyses using censored normal re-gression.17 This approach assumes
that we cannot know how participants receiving intervention would have scored without treatment, but their estimated scores would likely have been at least as low as their observed scores (ie, their scores are“left cen-sored”). This method therefore pro-vides an estimate of bias by accounting for the anticipated increase in BSID-III scores after intervention. Analyses were completed by using the Stata SE 12.0 software package.18
RESULTS
Two hundredfifteen children with and 224 children without diagnosed DP completed the BSID-III at Time 3. A parent interview or BSID-III adaptive behavior scale was completed for an additional 9 children with DP and 7 controls, resulting in partial or com-plete data for 224 children with DP and 231 children without DP (95% and 97% of the original cohorts, respectively). Compared with participants, families lost to follow-up (11 children with DP, 6 children without DP) had lower SES (71% Hollingshead categories III–IV compared with 28% among partic-ipants), and a greater proportion were non-White or Hispanic (59% compared with 35% among participants). Partic-ipants and nonparticPartic-ipants were similar in their average DP severity at Time 1.
Children with and without DP were predominantly male, of white race, and of middle to upper SES (Table 1). The mean age at Time 3 for children in both groups was∼36 months. Seventy-nine children with DP (35.3%) received or-thotic treatment. Eighty-two children with DP (36.6%) and 15 children with-out DP (6.5%) participated in $4 in-tervention sessions or$2 months of Birth-to-Three monitoring.
Fifty-four percent of cases had“ mod-erate”or“severe”DP based on pedia-tricians’reviews of subjects’3D images at Time 1 (Table 1). Among controls, 163 (70.6%) had no discernible skull dys-morphology, 66 (28.6%) had “mild” dysmorphology, and 2 (0.9%) had
“moderate” to “severe” dysmorphol-ogy. We excluded from further analyses 2 children with diagnosed DP who did not have discernible skull dysmorphol-ogy. We also excluded from analysis 7 children with DP and 2 children without DP (both of who had evidence of dys-morphology on 3D imaging) who, after study enrollment, were diagnosed with
other medical conditions that could af-fect neurodevelopment.5
This left 215 DP cases, 163 unaffected controls and 66 DP controls for analysis.
Developmental Outcomes for DP Cases Versus Unaffected Controls
Cases scored lower on average than unaffected controls on all BSID-III composite scales (Table 2). The larg-est differences were observed in lan-guage (adjusted difference =–4.4, 95% confidence interval [CI] =–6.8 to–2.0) and cognitive development (adjusted difference =–2.9 95% CI =–4.6 to–1.1).
2.7, 95% CI =–5.1 to –0.3). DP cases also scored lower than unaffected controls on the receptive language, expressive language, and fine motor subscales.
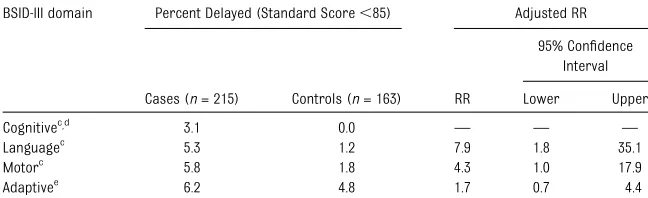
DP cases were more likely than un-affected controls to receive scores,85 in language (RR = 7.9, 95% CI = 1.8– 35.1), motor (RR = 4.3, 95% CI = 1.0– 17.9), and cognitive development (RR was not calculated because none of the controls scored in the delayed range; Table 3). Children with DP were only slightly more likely than controls to score in the delayed range on the adaptive behavior (parent report) composite (RR = 1.7, 95% CI = 0.7–4.4).
Secondary Analyses
DP controls scored lower than unaf-fected controls on all BSID-III composite scales, with adjusted group differences of–2.9 to–3.5 standard score points. DP controls also scored lower on the receptive language (adjusted differ-ence =–0.56, 95% CI =–1.1 to 0.0) and
fine motor subscale (adjusted differ-ence =–0.76, 95% CI =–1.5 to 0.0).
Among DP cases, outcomes were sim-ilar for children with “mild” and
“moderate-severe” DP and for those with and without a history of orthotic treatment. Female DP cases scored lower than male DP cases in cognitive development (adjusted difference =– 2.7, 95% CI = –5.1 to –0.3), although their scores were similar in all other areas. Average scores were similar for children with and without a history of torticollis except on the composite motor and gross motor scales, on which cases with torticollis scored on average 4.2 and 0.6 points higher, re-spectively (95% CI = 1.0–7.4 and 0.1– 1.1, respectively).
In censored normal regression analyses, the magnitude of all differences between DP cases and unaffected controls were
Characteristic Cases (n= 224) Controls (n= 231)
n % n %
Gender
Male 145 64.7 139 60.2 Female 79 35.3 92 39.8 Age in months at Time 3 (mean, SD)a
36.5(1.2) 36.0(1.1) Race/ethnicity
Caucasian 153 68.3 144 62.3 Asian/Pacific Islander 12 5.4 12 5.2 Black/African American 0 – 6 2.6 Hispanic/Latino 26 11.6 28 12.1 Mixed race/Other 33 14.7 41 17.7 Familial SES (mean, SD) 47.1 (12.4) 46.9 (11.6)
I (high) 80 35.7 60 26.0
II 89 39.7 100 43.3
III 34 15.2 46 19.9
IV 15 6.7 20 8.7
V (low) 6 2.7 5 2.2
History of torticollisb
Suspected 9 4.0 3 1.3 Confirmed 89 39.7 2 0.9 None 126 56.3 226 97.8 Orthotic helmet or band therapyb
Yes 79 35.3 0 –
No 145 64.7 231 100.0 Developmental interventionsb
Physical or occupational therapy 104 46.4 11 4.8 Speech/language therapy 34 15.2 14 6.1 Birth-to-Three monitoring 31 13.8 16 6.9
Other 38 17.0 18 7.8
Any Developmental Interventionsc 122 54.5 38 16.5
$4 intervention sessions or$2 mo Birth-to-Three early intervention monitoring
82 36.6 15 6.5 DP severity in infancy
None 2 0.9 163 70.6
Mild 101 45.1 66 28.6 Moderate-severe 121 54.0 2 0.9
aRange in age = 34.0 to 41.7 mo in cases, 33.3 to 40.9 mo in controls.
greater after accounting for the esti-mated effects of developmental inter-ventions. Group differences favoring controls increased by 2.0 to 3.3 stan-dard score points on the BSID-III com-posites and 0.6 to 0.7 scaled score points on BSID-III subscales.
DISCUSSION
Children with a history of DP continued to score lower than unaffected controls on the BSID-III at age 36 months. Im-portantly, this observation is based on a sample from which we excluded cases and controls with conditions that
ele-vate the risk of developmental delays (eg, prematurity, sensory impairments). We observed few differences among DP cases as a function of clinical and de-mographic characteristics. Consistent with the study by Miller and Clarren,12
a large proportion of children with DP received developmental services in the community. Assuming even a modest treatment effect, use of interventions likely reduced the magnitude of ob-served group differences, as is sug-gested by ourfindings using censored normal regression analyses. Finally,
“DP controls” (ie, infants enrolled as healthy controls without previously di-agnosed DP, but later found to have skull dysmorphology on 3D imaging) consis-tently scored lower on the BSID-III than unaffected controls. This suggests that the association between DP and de-velopment is not due merely to bias in patients referred to a specialty clinic.
These observations are consistent with comparisons at ages 7 and 18 months in this cohort,5,10 and they provide the
first evidence of a persistent associa-tion between DP and development in preschoolers using clinician-administered assessments. Although the strength of the association between DP and de-velopment is relatively modest, its clini-cal relevance is suggested by the consistency of this association over time and the persistence of group differences despite the high proportion of children with DP who received developmental intervention. Compared with those ob-served during infancy, group differences in gross motor development were di-minished, whereas differences per-sisted or increased in language and cognition. This specificity may reflect the nature of the developmental inter-ventions received because physical and occupational therapy were the most common interventions (46.4% of cases, compared with 4.8% of controls) and may have ameliorated motor deficits.
TABLE 2 Average Standardizeda
BSID-III Scores and Adjustedb
Group Comparisons for Children With DP (Cases) and Without DP (Controls)c
BSID-III Domain Cases,n= 215 mean (SD)
Controls,n= 163 mean (SD)
Case vs unaffected control differences
Adj. diff.
95% CI
Pvalue Lower Upper
Cognitived
97.3 (8.3) 99.4 (8.2) 22.9 24.6 21.1 .001 Languaged 105.0 (11.9) 108.7 (10.8) 24.4 26.8 22.0 ,.0005
Receptive languaged 10.9 (2.1) 11.3 (1.9) 20.6 21.1 20.2 .005 Expressive languaged 10.8 (2.2) 11.6 (2.1) 20.9 21.3 20.4 ,.0005 Motord 100.4 (11.1) 102.5 (10.5) 22.7 25.1 20.3 .030
Fine motord 10.6 (2.4) 11.1 (2.3) 20.6 21.1 20.1 .022 Gross motord 9.5 (1.8) 9.7 (1.9) 20.3 20.7 0.1 .185 Adaptive behaviore 101.1 (13.9) 104.8 (13.0) 24.0 27.0 20.9 .011
aStandard scores for the cognitive, language, motor, and adaptive behavior composite scales have a normative mean of 100 and SD of 15. Scaled scores for the receptive language, expressive language,fine motor, and gross motor subscales have a normative mean of 10 and SD of 3.
bAdjusted for child age (in mo), gender, SES (Hollingshead total, measured continuously), and ethnicity (white, non-Hispanic vs nonwhite or Hispanic).
cData were dropped for 2 children in the DP group who did not have evidence of DP based on clinician ratings of 3D head photographs and 68 children in the non-DP group who had mild or greater posterior skullflattening or asymmetry. Data were also dropped for 7 children with DP and 2 children without DP who were diagnosed with medical conditions with de-velopmental implications after enrollment in the study.
dScores rated as“invalid”by the examiner were dropped from analyses. At Time 3, cognitive scores were rated invalid for 1 child without DP; language scores were rated invalid for 3 children without DP; and motor scores were rated invalid for 1 child with DP and 5 children without DP.
eAdaptive behavior data were missing for 31 children with DP and 18 children without DP at Time 3. Another 3 children with DP and 3 children without DP were not seen for a clinic assessment, and only parent-reported adaptive behavior data were available.
TABLE 3 Percentage of Children With DP (Cases) and Without DP (Controls)a
Who Received Standard Scores,85 on the BSID-III and Adjusted RRb
BSID-III domain Percent Delayed (Standard Score,85) Adjusted RR
Cases (n= 215) Controls (n= 163) RR
95% Confidence Interval Lower Upper Cognitivec,d 3.1 0.0 — — — Languagec 5.3 1.2 7.9 1.8 35.1 Motorc 5.8 1.8 4.3 1.0 17.9 Adaptivee 6.2 4.8 1.7 0.7 4.4
aData were dropped for 2 children in the DP group who did not have evidence of DP based on clinician ratings of 3D head photographs, and 68 children in the non-DP group who had mild or greater posterior skullflattening or asymmetry. Data were also dropped for 7 children with DP and 2 children without DP who were diagnosed with medical conditions with developmental implications after enrollment in the study.
bAdjusted for child age (in mo), gender, SES (Hollingshead total, measured continuously), and ethnicity (white, non-Hispanic vs nonwhite or Hispanic).
cScores rated as“invalid”by the examiner were dropped from analyses. At Time 3, cognitive scores were rated invalid for 1 child without DP; language scores were rated invalid for 3 children without DP; and motor scores were rated invalid for 1 child with DP and 5 children without DP.
dRR was not calculated for cognitive scores given that no children in the unaffected control group scored,85. eAdaptive behavior data were missing for 31 children with DP and 18 children without DP at Time 3. Another 3 children with DP and 3 children without DP were not seen for a clinic assessment, and only parent reported adaptive behavior data were available.
with DP to preschool age,11which relied
on parent-reported developmental outcomes and test norms for compar-ison. In that study, 11% of children with DP aged 3 to 5 years scored in the
“delayed”range relative to test norms on the Ages and Stages Question-naire.19One risk when relying on test
norms for comparison is that research participants may differ from the nor-mative sample in characteristics that are associated with development (eg, SES), potentially leading to an un-derestimation of the risk of scoring below a clinical cutoff relative to de-mographically similar peers. In our sample, few children scored in the“ at-risk” range compared with the pro-portion indicated by test norms (see Table 3), likely reflecting the middle to high SES of the families in our sample and the exclusion of children with known neurodevelopmental liabilities. Nonetheless, children with DP in this study were∼2 to 8 times more likely to receive“at-risk”scores than unaffected controls, and we would expect the ab-solute percentage of delayed children with DP to be higher in samples with broader representation of SES.
Although we cannot rule out DP as the cause of developmental delays, a more parsimonious explanation for the ob-served case-control differences is the reverse: infants with early develop-mental risk are more apt to develop DP. There is some evidence for this possi-bility in population-based studies,2and
the high prevalence of previously un-diagnosed medical conditions that emerged in our sample of children with DP suggests an underlying develop-mental liability that preceded skull deformation. It may be that DP is the result of the interaction between
jority of children are now placed in supine position for sleep, only a mi-nority develop DP. Those with de-velopmental concerns, who may be less able to reposition themselves, may be more likely to develop skull de-formation. This idea is consistent with data reported by Fowler et al6 who
found that infants with DP were more likely than controls to have abnormal muscle tone on neurologic exams. DP might therefore serve as a physical
“marker” of developmental risk, evi-dent before delays are fully manifest and testable, which could be used to identify children who need additional evaluation and intervention.
That the severity of DP in infancy was unrelated to developmental outcomes at Time 3 argues further against the notion that DP causes later de-velopmental delays. Using the model proposed here, it may be that early neurodevelopmental concerns place an infant at risk for some degree of DP, with severity of deformation mediated by parents’ positioning practices. Or parents may be better motivated to participate in repositioning and other exercises when their child’s skull de-formity is severe, with beneficial effects on later development.
Strengths of this study included ob-jective measures of development, 3D imaging of children with and without diagnosed DP to identify skull dysmor-phology, the inclusion of demogra-phically similar controls for comparison, and an excellent retention rate. Limi-tations include recruitment of partic-ipants through a specialty craniofacial clinic (DP cases) and via a participant pool (controls), rather than population-based sampling. Children in both sam-ples might differ from the general
affect developmental outcomes. Fur-thermore, the participation rate among children with DP was lower than desired, in part because of the requirement that families be seen for the study#4 weeks after the child’s diagnosis. However, we did not find evidence of participation bias as a function of demographic (eg, SES) or clinical (eg, DP severity) varia-bles.10 The rate of developmental
in-tervention might have been elevated by feedback provided to participants as part of this study. We provided all fam-ilies with feedback regarding their child’s BSID-III scores, and when chil-dren scored in the“at-risk”range on the BSID-III we recommended follow-up with the child’s primary care provider. This likely prompted some families who otherwise would not have received as-sessment to seek out developmental intervention in the community. However, this should have had a similar effect on families in both groups, and therefore does not account for the disparity be-tween DP cases and controls. Moreover, censored regression analyses sug-gested that accounting for this source of bias would only magnify the observed differences.
CONCLUSIONS
Developmental differences between children with and without DP persist through age 36 months. Additional study is needed to determine whether these differences continue in school-aged children and to confirm these
REFERENCES
1. Argenta LC, David LR, Wilson JA, Bell WO. An increase in infant cranial deformity with supine sleeping position.J Craniofac Surg. 1996;7(1):5–11
2. McKinney CM, Cunningham ML, Holt VL, Leroux B, Starr JR. Characteristics of 2733 cases diagnosed with deformational pla-giocephaly and changes in risk factors over time.Cleft Palate Craniofac J. 2008;45 (2):208–216
3. Kane AA, Mitchell LE, Craven KP, Marsh JL. Observations on a recent increase in pla-giocephaly without synostosis. Pediatrics. 1996;97(6 pt 1):877–885
4. Turk AE, McCarthy JG, Thorne CH, Wisoff JH. The “back to sleep campaign” and de-formational plagiocephaly: is there cause for concern?J Craniofac Surg. 1996;7(1): 12–18
5. Collett BR, Starr JR, Kartin D, et al. De-velopment in toddlers with and without deformational plagiocephaly.Arch Pediatr Adolesc Med. 2011;165(7):653–658 6. Fowler EA, Becker DB, Pilgram TK, Noetzel
M, Epstein J, Kane AA. Neurologic fi nd-ings in infants with deformational pla-giocephaly. J Child Neurol. 2008;23(7): 742–747
7. Hutchison BL, Stewart AW, Mitchell EA.
Characteristics, head shape
measure-ments and developmental delay in 287 consecutive infants attending a plagioce-phaly clinic. Acta Paediatr. 2009;98(9): 1494–1499
8. Kennedy E, Majnemer A, Farmer JP, Barr RG, Platt RW. Motor development of infants with positional plagiocephaly. Phys Occup Ther Pediatr. 2009;29(3):222–235
9. Kordestani RK, Panchal J.
Neuro-development delays in children with de-formational plagiocephaly. Plast Reconstr Surg. 2006;118(3):808–809, author reply 809–810
10. Speltz ML, Collett BR, Stott-Miller M, et al. Case-control study of neurodevelopment in deformational plagiocephaly. Pediatrics. 2010;125(3). Available at: www.pediatrics. org/cgi/content/full/125/3/e537
11. Hutchison BL, Stewart AW, Mitchell EA. De-formational plagiocephaly: a follow-up of head shape, parental concern and neuro-development at ages 3 and 4 years.Arch Dis Child. 2011;96(1):85–90
12. Miller RI, Clarren SK. Long-term
velopmental outcomes in patients with de-formational plagiocephaly.Pediatrics. 2000;
105(2). Available at: www.pediatrics.org/ cgi/content/full/105/2/E26
13. Steinbok P, Lam D, Singh S, Mortenson PA, Singhal A. Long-term outcome of infants with positional occipital plagiocephaly.
Childs Nerv Syst. 2007;23(11):1275–1283 14. Bayley N.Manual for the Bayley Scales of
Infant and Toddler Development. 3rd ed. San Antonio, TX: The Psychological Corpo-ration; 2006
15. Leppig KA, Werler MM, Cann CI, Cook CA, Holmes LB. Predictive value of minor anomalies. I. Association with major mal-formations.J Pediatr. 1987;110(4):531–537 16. Hollingshead AB.Four Factor Index of So-cial Status. New Haven, CT: Yale University; 1975
17. Tobin MD, Sheehan NA, Scurrah KJ, Burton PR. Adjusting for treatment effects in studies of quantitative traits: antihyper-tensive therapy and systolic blood pres-sure.Stat Med. 2005;24(19):2911–2935 18. StataCorp. Stata Statistical Software;
Re-lease 12. College Station, TX: StataCorp LP
19. Squires J, Twombly E, Bricker D, Potter R.
Behavior—Ages & Stages Questionnaires. 3rd ed. Eugene, OR: University of Oregon, Center on Human Development; 2009
(Continued fromfirst page)
www.pediatrics.org/cgi/doi/10.1542/peds.2012-1779 doi:10.1542/peds.2012-1779
Accepted for publication Sep 17, 2012
Address correspondence to Brent R. Collett, PhD, Seattle Children’s Research Institute, 2001 8th Ave, Suite 600, Mailstop CW8-6, Seattle, WA 98121. E-mail: bcollett@u. washington.edu
PEDIATRICS (ISSN Numbers: Print, 0031-4005; Online, 1098-4275). Copyright © 2013 by the American Academy of Pediatrics
FINANCIAL DISCLOSURE:The authors have indicated they have nofinancial relationships relevant to this article to disclose.
FUNDING:This publication was made possible in part by grant 1 R01 HD046565 from the National Institute of Child Health and Human Development (NICHHD) to Dr Speltz and grant 1 UL1 RR025014 from the National Center for Research Resources (NCRR), components of the National Institutes of Health (NIH). Its contents are solely the responsibility of the authors and do not necessarily represent the official view of NICHHD, NCRR, or NIH. Funded by the National Institutes of Health (NIH).
DOI: 10.1542/peds.2012-1779 originally published online December 24, 2012;
2013;131;e109
Pediatrics
Cunningham and Matthew L. Speltz
Services
Updated Information &
http://pediatrics.aappublications.org/content/131/1/e109
including high resolution figures, can be found at:
References
http://pediatrics.aappublications.org/content/131/1/e109#BIBL
This article cites 15 articles, 4 of which you can access for free at:
Subspecialty Collections
al_issues_sub
http://www.aappublications.org/cgi/collection/development:behavior Developmental/Behavioral Pediatrics
following collection(s):
This article, along with others on similar topics, appears in the
Permissions & Licensing
http://www.aappublications.org/site/misc/Permissions.xhtml
in its entirety can be found online at:
Information about reproducing this article in parts (figures, tables) or
Reprints
http://www.aappublications.org/site/misc/reprints.xhtml
DOI: 10.1542/peds.2012-1779 originally published online December 24, 2012;
2013;131;e109
Pediatrics
Cunningham and Matthew L. Speltz
Brent R. Collett, Kristen E. Gray, Jacqueline R. Starr, Carrie L. Heike, Michael L.
Development at Age 36 Months in Children With Deformational Plagiocephaly
http://pediatrics.aappublications.org/content/131/1/e109
located on the World Wide Web at:
The online version of this article, along with updated information and services, is
by the American Academy of Pediatrics. All rights reserved. Print ISSN: 1073-0397.