www.impactjournals.com/Genes&Cancer Genes & Cancer, Vol. 7 (7-8), July 2016
Pathway analysis of bladder cancer genome-wide association
study identifies novel pathways involved in bladder cancer
development
Meng Chen1,*, Nathaniel Rothman2,*, Yuanqing Ye1, Jian Gu1, Paul A. Scheet1, Maosheng Huang1, David W. Chang1, Colin P. Dinney3, Debra T. Silverman2, Jonine D. Figueroa2, Stephen J. Chanock2,** and Xifeng Wu1,**
1 Department of Epidemiology, The University of Texas M. D. Anderson Cancer Center, Houston, TX, USA 2 Division of Cancer Epidemiology and Genetics, National Cancer Institute, Bethesda, MD, USA
3 Department of Urology, The University of Texas M. D. Anderson Cancer Center, Houston, TX, USA * co-first author
** co-last author
Correspondence to: Xi-Feng Wu, email: [email protected]
Keywords: pathway analysis, gene set enrichment analysis, GWAS, bladder cancer, susceptibility loci
Received: May 20, 2016 Accepted: July 28, 2016 Published: August 07, 2016
ABSTRACT
Genome-wide association studies (GWAS) are designed to identify individual regions associated with cancer risk, but only explain a small fraction of the inherited variability. Alternative approach analyzing genetic variants within biological pathways has been proposed to discover networks of susceptibility genes with additional effects. The gene set enrichment analysis (GSEA) may complement and expand traditional GWAS analysis to identify novel genes and pathways associated with bladder cancer risk. We selected three GSEA methods: Gen-Gen, Aligator, and the SNP Ratio Test to evaluate cellular signaling pathways involved in bladder cancer susceptibility in a Texas GWAS population. The candidate genetic polymorphisms from the significant pathway selected by GSEA were validated in an independent NCI GWAS. We identified 18 novel pathways (P < 0.05) significantly associated with bladder cancer risk. Five of the most promising pathways (P ≤ 0.001 in any of the three GSEA methods) among the 18 pathways included two cell cycle pathways and neural cell adhesion molecule (NCAM), platelet-derived growth factor (PDGF), and unfolded protein response pathways. We validated the candidate polymorphisms in the NCI GWAS and found variants of RAPGEF1, SKP1, HERPUD1, CACNB2, CACNA1C,
CACNA1S, COL4A2, SRC, and CACNA1C were associated with bladder cancer risk. Two CCNE1 variants, rs8102137 and rs997669, from cell cycle pathways showed the strongest associations; the CCNE1 signal at 19q12 has already been reported in previous GWAS. These findings offer additional etiologic insights highlighting the specific genes and pathways associated with bladder cancer development. GSEA may be a complementary tool to GWAS to identify additional loci of cancer susceptibility.
INTRODUCTION
Urinary bladder cancer is the fourth most common cancer in men in U.S. Estimates in 2015 indicate urinary
bladder cancer affects 56,320 males and 17,680 females, and will lead to 16,000 deaths in the U.S. [1] . Bladder
cancer is a heterogeneous disease attributed to many risk factors. The number one risk factor is tobacco
bladder cancer, initially based on familial clustering of bladder cancer. Epidemiologic studies have demonstrated a two-fold elevation in bladder cancer risk among first-degree relatives of bladder cancer patients [6, 7]. A segregation analysis in 1,193 families suggests a paucity of high penetrance gene for sporadic bladder cancer but instead many low penetrance genes with modest effects [8], indicative of a complex, polygenic model [9]. A large population based twin study evaluated the contribution of hereditary factors to the causation of various sporadic
cancers and estimated the genetic contribution of bladder
cancer to be roughly 30% [10].
Approaches towards mapping cancer susceptibility regions have undergone an evolution due to the recent annotation of variation across the genome as well as technical advances in single nucleotide polymorphism (SNP) arrays [11]. The candidate gene approach was pursued in the beginning but with very few successes that replicated in subsequent studies. In recent years, the emergence of genome-wide association studies (GWAS) has substantially advanced the field of identifying novel cancer susceptibility loci. Currently, bladder cancer GWAS have identified nine novel loci including 18q12.3 (urea transport, SLC14A1, intron), 8q24.21 (oncogene MYC, intergenic region), 4p16.3 (fibroblast growth factor, FGFR3, intron),22q13.1 (apolipoprotein B mRNA-editing enzyme catalytic polypeptide-like 3A, APOBEC3A, intergenic region), 19q12 (cyclin E1, CCNE1, intergenic region), 8q24.3 (prostate stem cell antigen, PSCA, missense mutation), 3q28 (tumor protein p63, TP63, intergenic region), 2q37.1(UDP-glycosyltransferase 1 family polypeptide A1, UGT1A, intron), and 5p15.33 (telomerase reverse transcriptase, TERT, intron) [12-18]. In addition, two previously reported bladder cancer risk loci 1p13.3 (glutathiones transferase, GSTM1, deletion) and 8p22 (N-acetyltransferase 2, NAT2, intergenic region) were further validated in the GWAS studies [17, 19, 20].
Recent GWAS have provided valuable insights into the genetic basis of human disease but GWAS do not fully explain heritability in sporadic cancers [21]. So far, the low estimated effect sizes of the individual SNPs account for a small portion of the heritability of bladder cancer. In addition, majority of disease associated SNPs found in GWAS are tagging SNPs at non-genic regions without clear functional implication (http://www.genome. gov/gwastudies/). They may be highly correlated with
the variants directly associated with bladder cancer susceptibility [22].
Gene set enrichment analysis (GSEA), also known as pathway based analysis, examines whether the test statistics for a group of common genetic variants that map to predefined gene sets (e.g., gene set from pathways defined by prior biological knowledge) support the possibility of disease association [23]. To date, GSEA have been applied to explore the critical pathways and
genes of several diseases and traits, including Crohn’s disease [24], rheumatoid arthritis [25, 26], multiple sclerosis [25, 27], diabetes [25], Parkinson’s disease [25, 28, 29], bipolar disorder [25, 30], coronary artery disease [25], hypertension [25], age-related eye disease [25, 28], adult heights [31], colon cancer [32], breast cancer [33], and bladder cancer [34] .
RESULTS
A total of 781 pathways, including those from KEGG (http://www.genome.jp/kegg/), Biocarta (http:// cgap.nci.nih.gov/Pathways/BioCarta_Pathways),
and Reactome (http://www.reactome.org/) databases
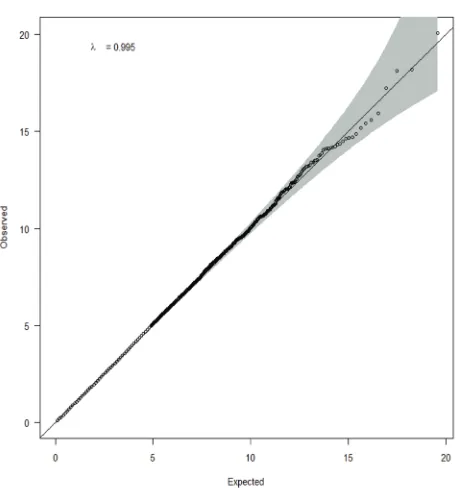
were included in the GSEA of bladder cancer GWAS (Supplementary Figure 1). A quantile-quantile plot of observed versus expected chi2 test statistics showed no evidence for inflation in the Texas population (inflation factor 0.995)(Figure 1). We identified 85 possibly significant pathways associated with bladder cancer risk by Gen-Gen method alone (Supplementary Table 1), 44 significant pathways by Aligator (Supplementary Table 2), and 68 significant pathways by SNP Ratio Test (Supplementary Table 3). The results from the above three GSEAs (Gen-Gen, SNP Ratio Test, and Aligator) were consistent that we identified 18 novel pathways (P < 0.05)
significantly associated with bladder cancer risk in all three GSEA methods (Table 1) from the Texas population. Top five pathways (P ≤ 0.001 in any of the three GSEA methods) among the 18 pathway included two cell cycle pathways involved in the G1/S transition (PGenGen: 0.001, PAligator: 0.001, PSRT: 0.002), neural cell adhesion molecule (NCAM) pathway (PGenGen: < 0.001, PAligator: 0.020, PSRT: 0.014), platelet-derived growth factor (PDGF) induced intracellular pathway (PGenGen: < 0.001, PAligator: 0.026, PSRT: 0.006) and unfolded protein response pathway (PGenGen: 0.007, PAligator: 0.001, PSRT: < 0.001) (Table 1). We grouped these five significant pathways into three categories based on functional similarity:
Cell cycle related pathways
The two significant pathways, “BIOCARTA_ RACCYCD_PATHWAY” and “BIOCARTA_SKP2E2F_ PATHWAY”, were both related to cell cycle, specifically genes critical for G1 and S phase (Table 2 and Supplementary Figure 2A). In our GSEA, “BIOCARTA_ RACCYCD_PATHWAY” (http://www.biocarta.com/ pathfiles/h_RacCycDPathway.asp) contains 300 SNPs from 26 genes, and “BIOCARTA_SKP2E2F_PATHWAY”
(http://www.biocarta.com/pathfiles/h_skp2e2fPathway. asp) consists of 115 SNPs from 10 genes. Five genes
2A). We also examined the individual SNP association for variants located in genes from the two pathways and then queried the significant SNPs (P < 0.05) in the NCI bladder cancer GWAS for validation (Table 3). Three SNPs from “BIOCARTA_RACCYCD_PATHWAY”, and four SNPs from “BIOCARTA_SKP2E2F_PATHWAY” were significant in the Texas population, NCI population, and pooled analysis. Three significant SNPs were in CCNE1 gene: rs8102137 (PTexas = 0.0003, PNCI = 0.0005, PPooled = 1×10⁻⁶), rs997669 (P
Texas = 0.0031, PNCI = 0.0019, PPooled =
3.6×10⁻⁵), and rs4804903 (P
Texas = 0.0458, PNCI = 0.0019,
PPooled = 0.001), which were not in linkage disequilibrium and were the overlapping SNPs co-existed in the two cell cycle pathways (Table 3). In addition, SKP1 rs10491321 from “BIOCARTA_SKP2E2F_PATHWAY” remained significant after validation (PTexas = 0.0206, PNCI = 0.0035, PPooled = 0.0004) (Table 3). Imputation of CCNE1 and SKP1
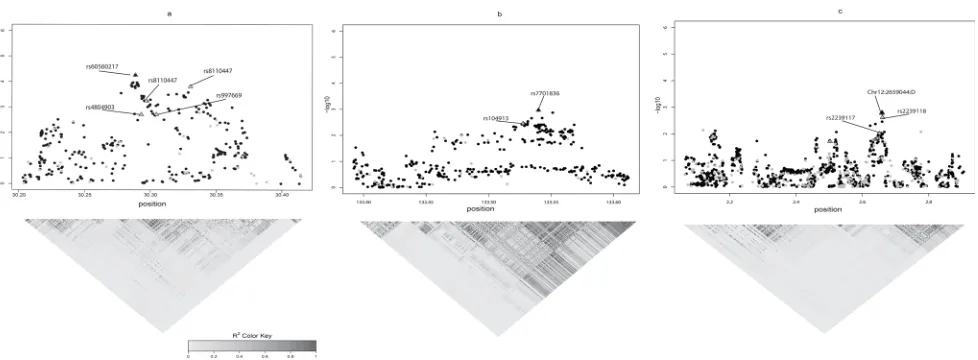
region showed that the strongest signals in the region of interest are CCNE1 rs60560217 (Chr19: 30288545) and SKP1 rs7701836 (Chr5: 133539947) (Figure 2A and 2B), which are in strong linkage disequilibrium (R2 > 0.7)
with CCNE1 rs8102137 and SKP1 rs10491321, a region already identified in previous GWAS [15].
Figure 1: Q-Q plot of observed versus expected chi2 test statistics in Texas population.
Table 1: Significant pathways from the three gene set enrichment analyses
Gen-Gen Aligator SNP Ratio Test
Pathway P Rank P Rank P Rank
REACTOME_SIGNALING_BY_PDGF <0.001 1 0.0264 25 0.005994 5
REACTOME_NCAM_SIGNALING_FOR_NEURITE_OUT_GROWTH <0.001 1 0.0198 21 0.013986 12
BIOCARTA_RACCYCD_PATHWAY 0.001 2 0.0012 2 0.001998 2
BIOCARTA_SKP2E2F_PATHWAY 0.001 2 0.0016 3 0.011988 10
BIOCARTA_NDKDYNAMIN_PATHWAY 0.003 4 0.007 8 0.08991 56
REACTOME_NCAM1_INTERACTIONS 0.005 6 0.009 11 0.025974 21
BIOCARTA_P27_PATHWAY 0.005 6 0.0044 6 0.021978 18
REACTOME_UNFOLDED_PROTEIN_RESPONSE 0.007 8 0.0008 1 0.000999 1
REACTOME_INACTIVATION_OF_APC_VIA_DIRECT_INHIBITION_
OF_THE_APCOMPLEX 0.008 9 0.0368 30 0.002997 3
BIOCARTA_BAD_PATHWAY 0.009 10 0.0496 38 0.008991 7
REACTOME_CONVERSION_FROM_APC_CDC20_TO_APC_CDH1_IN_
LATE_ANAPHASE 0.013 13 0.0484 37 0.016983 14
BIOCARTA_NFAT_PATHWAY 0.017 16 0.0036 4 0.013986 12
REACTOME_CTLA4_INHIBITORY_SIGNALING 0.018 17 0.0392 32 0.027972 22
REACTOME_PHOSPHORYLATION_OF_THE_APC 0.018 17 0.0376 31 0.010989 9
REACTOME_APCDC20_MEDIATED_DEGRADATION_OF_CYCLIN_B 0.019 18 0.0392 32 0.00999 8
KEGG_PROSTATE_CANCER 0.02 19 0.004 5 0.036963 29
REACTOME_SYNTHESIS_OF_BILE_ACIDS_AND_BILE_SALTS_
VIA_24_HYDROXYCHOLESTEROL 0.025 22 0.007 8 0.048951 36
BIOCARTA_DC_PATHWAY 0.044 34 0.0138 17 0.005994 5
Growth factor mediated intracellular signaling
There were two growth factor mediated
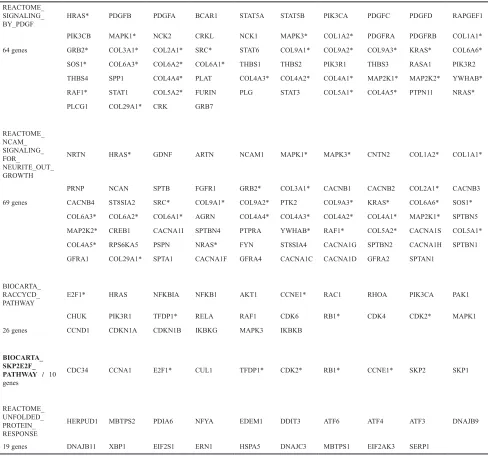
intracellular signaling pathways significant in GSEA analysis. Neural cell adhesion molecule (NCAM) pathway, (“REACTOME_NCAM_SIGNALING_FOR_ NEURITE_OUT_GROWTH”: http://www.reactome. org/entitylevelview/PathwayBrowser.html#DB = gk_ current&FOCUS_SPECIES_ID = 48887&FOCUS_ PATHWAY_ID = 375165&ID = 375165) was composed of 2,232 SNPs from 69 genes, and platelet-derived growth factor (PDGF) induced intracellular pathway (“REACTOME_SIGNALING_BY_PDGF”: http://www. reactome.org/entitylevelview/PathwayBrowser.html#DB = gk_current&FOCUS_SPECIES_ID = 48887&FOCUS_ PATHWAY_ID = 186797&ID = 186797) consisted of
1,423 SNPs from 64 genes (Table 1 and Table 2). There were 31 overlapping genes co-existed in these two pathways (Table 2). After validation in NCI population, eleven SNPs in 5 genes of the “REACTOME_NCAM_ SIGNALING_FOR_NEURITE_OUT_GROWTH” pathway, including CACNB2 rs12416052, rs17611556; CACNA1C rs1990240, rs2239062, rs2239117, rs2239118, rs7132154, rs7963955; CACNA1S rs3767499; COL4A2 rs418543; and SRC rs6011959, and three SNPs COL4A2 rs418543, SRC rs6011959, and RAPGEF1 rs7040470 from the “REACTOME_SIGNALING_BY_PDGF” pathway remained significant with P value less than 0.005 in pooled analysis (Table 3). Among them, SRC rs6011959
and COL4A2 rs418543 were overlapping SNPs in two pathways, while RAPGEF1 rs7040470 was the most significant SNP in this PDGF mediated pathway with pooled P value of 1.2 x 10⁻⁵. For all these genes, the most
significant SNPs in imputation were labeled in Figure 2C. The top signals of CACNA1C are chr12:2659044:D and rs11062272 which are in linkage disequilibrium (R2 > 0.7)
with the validated SNPs rs2239117 and rs2239118 (Figure 2C).
Unfolded protein response
Unfolded protein response (UPR) pathway (REACTOME_UNFOLDED_PROTEIN_RESPONSE:
http://www.reactome.org/entitylevelview/
pathwayBrowser.html#DB = gk_current&FOCUS_ SPECIES_ID = 48887&FOCUS_PATHWAY_ID = 381119&ID = 381160&VID = 3079930) with 257 SNPs from 19 genes showed strongest enrichment signal based on Aligator (P = 0.0008) and SNP Ratio Test (P = 0.0009), and ranked top 8 in Gen-Gen (P = 0.007) (Table 2 and Supplementary Figure 2D). However, after validation, only one SNP rs2518054 at HERPUD1 was significant in the Texas population with P = 0.0193, in NCI population
with P = 0.0312, and in pooled analysis with P = 0.0017 (Table 3). The top signal in imputation is not linked with the validated SNP in HERPUD1 (data not shown).
DISCUSSION
In this study, we pursued a pathway approach in the Texas bladder cancer GWAS data using three GSEA methods including Gen-Gen, Aligator, and SNP Ratio Test. We identified 18 promising pathways out of 781 predefined gene-sets, which were associated with bladder cancer risk according to our screening criteria. The top five significant pathways involved cell cycle control at
Figure 2: The imputation of gene regions of interest using 1000 genomes data (black dot) along with Texas Bladder Cancer GWAS data (gray dot). The SNPs indicated by triangles were those validated in NCI population. Top three gene regions in which top signals from imputation are in strong linkage disequilibrium (R2 > 0.7) with the SNPs validated in both Texas and NCI
G1 and S phase, NCAM and PDGF induced intracellular signaling, and unfolded protein response. From these top five pathways, 17 SNPs from CCNE1, RAPGEF1, SKP1, HERPUD1, CACNB2, CACNA1C, CACNA1S, COL4A2, SRC, CACNA1C, appear to be associated withbladder
cancer risk and were subsequently observed in the NCI bladder cancer GWAS.
The pathways highlighted were two cell cycle related pathways “BIOCARTA_RACCYCD_PATHWAY”, and “BIOCARTA_SKP2E2F_PATHWAY” at G1 and S phase (Supplementary Figure 2A). The G1/S phase transition is the rate-limiting step in cell cycle. This process is sequentially and coordinately regulated by the
formation of several Cyclin-Cyclin Dependent Kinase (CDK) complexes, for example, Cyclin-D -CDK4/6 complex for G1 progression, Cyclin-E -CDK2 complex for the G1-S transition, and Cyclin-A -CDK2 complex for S-phase progression [35, 36]. Disruption of these complexes leads to either cell cycle arrest or uncontrolled cell cycle proliferation. Somatic and germline alterations of this pathway had been found in bladder cancer and other tumors [37-40]. In particular, the expression of Cyclin E1 has been correlated with more advanced and invasive bladder cancer, as well as poor clinical outcomes [41]. In our GSEA, the most significant SNP after validation in NCI population is CCNE1 rs8102137, which mapsto the
Table 2: Genes contained in significant pathways REACTOME_
SIGNALING_
BY_PDGF HRAS* PDGFB PDGFA BCAR1 STAT5A STAT5B PIK3CA PDGFC PDGFD RAPGEF1
PIK3CB MAPK1* NCK2 CRKL NCK1 MAPK3* COL1A2* PDGFRA PDGFRB COL1A1*
64 genes GRB2* COL3A1* COL2A1* SRC* STAT6 COL9A1* COL9A2* COL9A3* KRAS* COL6A6*
SOS1* COL6A3* COL6A2* COL6A1* THBS1 THBS2 PIK3R1 THBS3 RASA1 PIK3R2
THBS4 SPP1 COL4A4* PLAT COL4A3* COL4A2* COL4A1* MAP2K1* MAP2K2* YWHAB*
RAF1* STAT1 COL5A2* FURIN PLG STAT3 COL5A1* COL4A5* PTPN11 NRAS*
PLCG1 COL29A1* CRK GRB7
REACTOME_ NCAM_ SIGNALING_ FOR_
NEURITE_OUT_ GROWTH
NRTN HRAS* GDNF ARTN NCAM1 MAPK1* MAPK3* CNTN2 COL1A2* COL1A1*
PRNP NCAN SPTB FGFR1 GRB2* COL3A1* CACNB1 CACNB2 COL2A1* CACNB3
69 genes CACNB4 ST8SIA2 SRC* COL9A1* COL9A2* PTK2 COL9A3* KRAS* COL6A6* SOS1*
COL6A3* COL6A2* COL6A1* AGRN COL4A4* COL4A3* COL4A2* COL4A1* MAP2K1* SPTBN5
MAP2K2* CREB1 CACNA1I SPTBN4 PTPRA YWHAB* RAF1* COL5A2* CACNA1S COL5A1*
COL4A5* RPS6KA5 PSPN NRAS* FYN ST8SIA4 CACNA1G SPTBN2 CACNA1H SPTBN1
GFRA1 COL29A1* SPTA1 CACNA1F GFRA4 CACNA1C CACNA1D GFRA2 SPTAN1
BIOCARTA_ RACCYCD_
PATHWAY E2F1* HRAS NFKBIA NFKB1 AKT1 CCNE1* RAC1 RHOA PIK3CA PAK1
CHUK PIK3R1 TFDP1* RELA RAF1 CDK6 RB1* CDK4 CDK2* MAPK1
26 genes CCND1 CDKN1A CDKN1B IKBKG MAPK3 IKBKB
BIOCARTA_ SKP2E2F_ PATHWAY / 10 genes
CDC34 CCNA1 E2F1* CUL1 TFDP1* CDK2* RB1* CCNE1* SKP2 SKP1
REACTOME_ UNFOLDED_ PROTEIN_ RESPONSE
HERPUD1 MBTPS2 PDIA6 NFYA EDEM1 DDIT3 ATF6 ATF4 ATF3 DNAJB9
19 genes DNAJB11 XBP1 EIF2S1 ERN1 HSPA5 DNAJC3 MBTPS1 EIF2AK3 SERP1
chromosome 19q12 at the 5’ flanking region of CYCLIN E1 gene with P value of 1×10⁻⁶ (Table 3). This SNP has
been reported in previous GWAS, which is reassuring for the analytical approach [15]. CCNE1 rs8102137 is also linked with the top signal rs60560217 in our imputation results (Figure 2A). There were no functional implications for rs60560217. Rs997669, located at the intron 4 of CCNE1, was significantly associated with bladder cancer
risk (pooled P value of 3.6×10⁻⁵) independent of the above
two SNPs.
In the “REACTOME_NCAM_SIGNALING_FOR_ NEURITE_OUT_GROWTH” pathway (Supplementary Figure 2B), the neural cell adhesion molecule, NCAM, belongs to the immunoglobulin superfamily. The NCAM
induced intracellular signaling not only functions
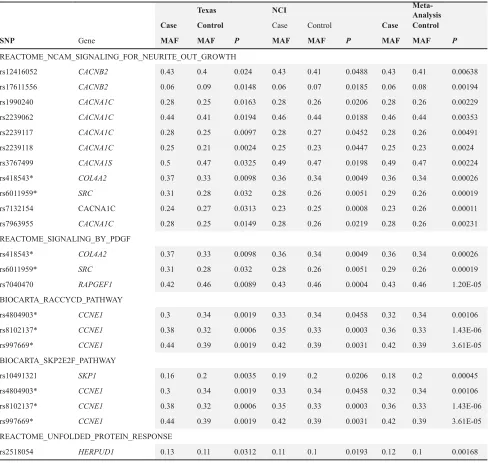
in neuronal differentiation, synaptic plasticity, and Table 3: Validated SNPs from significant pathways in independent populations
Texas NCI Meta-Analysis
Case Control Case Control Case Control
SNP Gene MAF MAF P MAF MAF P MAF MAF P
REACTOME_NCAM_SIGNALING_FOR_NEURITE_OUT_GROWTH
rs12416052 CACNB2 0.43 0.4 0.024 0.43 0.41 0.0488 0.43 0.41 0.00638
rs17611556 CACNB2 0.06 0.09 0.0148 0.06 0.07 0.0185 0.06 0.08 0.00194
rs1990240 CACNA1C 0.28 0.25 0.0163 0.28 0.26 0.0206 0.28 0.26 0.00229
rs2239062 CACNA1C 0.44 0.41 0.0194 0.46 0.44 0.0188 0.46 0.44 0.00353
rs2239117 CACNA1C 0.28 0.25 0.0097 0.28 0.27 0.0452 0.28 0.26 0.00491
rs2239118 CACNA1C 0.25 0.21 0.0024 0.25 0.23 0.0447 0.25 0.23 0.0024
rs3767499 CACNA1S 0.5 0.47 0.0325 0.49 0.47 0.0198 0.49 0.47 0.00224
rs418543* COL4A2 0.37 0.33 0.0098 0.36 0.34 0.0049 0.36 0.34 0.00026
rs6011959* SRC 0.31 0.28 0.032 0.28 0.26 0.0051 0.29 0.26 0.00019
rs7132154 CACNA1C 0.24 0.27 0.0313 0.23 0.25 0.0008 0.23 0.26 0.00011
rs7963955 CACNA1C 0.28 0.25 0.0149 0.28 0.26 0.0219 0.28 0.26 0.00231
REACTOME_SIGNALING_BY_PDGF
rs418543* COL4A2 0.37 0.33 0.0098 0.36 0.34 0.0049 0.36 0.34 0.00026
rs6011959* SRC 0.31 0.28 0.032 0.28 0.26 0.0051 0.29 0.26 0.00019
rs7040470 RAPGEF1 0.42 0.46 0.0089 0.43 0.46 0.0004 0.43 0.46 1.20E-05
BIOCARTA_RACCYCD_PATHWAY
rs4804903* CCNE1 0.3 0.34 0.0019 0.33 0.34 0.0458 0.32 0.34 0.00106
rs8102137* CCNE1 0.38 0.32 0.0006 0.35 0.33 0.0003 0.36 0.33 1.43E-06
rs997669* CCNE1 0.44 0.39 0.0019 0.42 0.39 0.0031 0.42 0.39 3.61E-05
BIOCARTA_SKP2E2F_PATHWAY
rs10491321 SKP1 0.16 0.2 0.0035 0.19 0.2 0.0206 0.18 0.2 0.00045
rs4804903* CCNE1 0.3 0.34 0.0019 0.33 0.34 0.0458 0.32 0.34 0.00106
rs8102137* CCNE1 0.38 0.32 0.0006 0.35 0.33 0.0003 0.36 0.33 1.43E-06
rs997669* CCNE1 0.44 0.39 0.0019 0.42 0.39 0.0031 0.42 0.39 3.61E-05
REACTOME_UNFOLDED_PROTEIN_RESPONSE
rs2518054 HERPUD1 0.13 0.11 0.0312 0.11 0.1 0.0193 0.12 0.1 0.00168
* “REACTOME_SIGNALING_BY_PDGF” and “REACTOME_NCAM_SIGNALING_FOR_NEURITE_OUT_GROWTH” had overlapping SNPs. The shared SNPs and Genes were indicated by asterisk.
“BIOCARTA_RACCYCD_PATHWAY” and “BIOCARTA_SKP2E2F_PATHWAY” had overlapping SNPs. The shared SNPs and Genes were indicated by asterisk.
regeneration, but is also involved in the regulation of growth factor signaling, and cytoskeletion, etc. In the “REACTOME_SIGNALING_BY_PDGF” pathway (Supplementary Figure 2C), the binding of Platelet-derived growth factors (PDGF) to its two tyrosine kinase receptor induces the receptor dimerization and autophosphorylation, and enables the activation of many downstream molecules, such as SRC, PI3K, CRK, STAT, SHP-2, NCK, GAP, SHC, GRB2, GRB7, and PLC-γ1. Therefore PDGF can elicit the crosstalk of many downstream pathways, for example RAS-RAF-MEK-MAPK and PI3K-AKT pathways, to influence diverse functions, such as cell growth and motility [42].
In growth factor mediated intracellular pathways (Supplementary Figure 2B and 2C), RAPGEF1 rs7040470 was significantly associated with bladder cancer risk and the significance level reached 1.2×10⁻⁵ in the pooled
analysis (Table 3). RAPGEF1 maps to 9q34.13 and
encodes the RAP guanine nucleotide exchange factor 1. RAPGEF1 regulates the RAS-CRK-RAP1 cellular signal
transduction system which has shown abnormality in lung
carcinogenesis [43, 44]. Rs7040470 is at the downstream
near gene region of RAPGEF1.
UPR contributes to a critical decision point between homeostasis or apoptosis of cell (Supplementary Figure 2D). During the ER stress, UPR initially decreases protein translation and enhances the unfolded protein degradation response to enforce the cell to maintain a homeostastic status [45]. If unable to maintain homeostasis within a certain time, the cell will commit apoptosis. In the UPR pathway (Supplementary Figure 2D), rs2518054 of HERPUD1was the only significant SNP validated with pooled P value 0.002 (Table 3). HERPUD1, located at 16q13, is an endoplasmic reticulum (ER) resident protein which is up-regulated in response to ER stress [46]. Interestingly, variants in HERPUD1 have been associated with the metabolic syndrome in GWAS [47-49] .
The GSEA method is an attractive approach for identifying additional susceptibility signals but it does require both larger sample sizes and independent replication sets to conclusively establish novel loci. GSEA can detect evidence for subtle effects of multiple SNPs in the same gene set, though it does not dissect pleiotropy in a given region. In our GSEA, we not only validated one SNP at CCNE1 from previous GWAS, but also highlighted several novel SNPs, genes, and pathways potentially involved in bladder cancer tumorigenesis (Tables 1-3). Since GSEA grouped millions of SNPs into hundreds of gene sets, the burden of multiple comparisons have been greatly reduced. In addition, incorporation of
the biological knowledge into statistical analysis renders
our finding more relevant to biological interpretation. The biggest challenge for GSEA is how to define a gene set as misclassification leads directly to a loss of power. Due to the complexity of cell biology, some of the gene sets will be inevitably redundant or overlapping. Thus, associations
could be driven by significant genes that are overlapped in different pathways. Another major limitation of GSEA
is that it can only assess SNPs in or near gene regions so
non-genic variants are not considered. Furthermore, the analysis assumes SNPs having only local cis-effects, an assumption that may be limiting. Finally, we only validated the genes and SNPs but not the pathways associated with bladder cancer risk since the NCI data was derived from multiple GWAS genotyping panels (HumanHap 1M, HumanHap610-Quad, HumanHap610, and HumanHap550 equivalents) compared to the MD Anderson data of using a single beadchip (HumanHap610). Differences in gene coverage and the selection of tagSNPs for each gene region in the various Illumina GWAS panels precluded us from confirming the results at the pathway level.
In summary, we implemented three different GSEA methods as internal validation to identify the biological pathways consistently associated with bladder cancer risk and also validated our results in an independent NCI population, which may reduce false discovery in our findings. GSEA is a complementary
tool to identify additional genetic contributions to the
heritability of bladder cancer, and may also be applicable to clinical outcome studies [50] by incorporating the biological pathway information into GWAS analysis. Our findings may pinpoint potential pathway targets for cancer prevention and treatment and to improve the risk prediction model of bladder cancer. However, to pursue these strategies, further research are needed to validate, fine-map and conduct functional characterization to pinpoint the variants directly associated with bladder
cancer risk.
MATERIALS AND METHODS
Study population for primary GWAS
Study population was derived from our previous published GWAS (14), which included a total of 969 Caucasian cases and 957 Caucasian controls. Cases were recruited from MD Anderson Cancer Center and Baylor College of Medicine between 1999 and 2007. They were newly diagnosed bladder cancer patients, histologically confirmed, and previously untreated (ICD codes 188.1-188.9). There were no restrictions on age, sex, ethnicity, and cancer stage in case recruitment. Control subjects
were recruited from Kelsey Seybold clinics and were
Center, Baylor College of Medicine, and Kelsey-Seybold Clinic. No inflation was found in the study population structure [14]. All leukocyte DNAs were genotyped by Illumina HumanHap610 chip. Quality control for genotyping has been described previously (14). Briefly, cases and controls were excluded from analysis if they had genotyping call rates less than 95%; were found on review not to be of European ancestry; or were found to be duplicated samples, not matched according to established criteria, or to have reported a sex that did not match with X chromosome heterozygosity. We also excluded samples that deviated by more than 4 standard deviation from other study subjects using similarity in genotypes implemented in PLINK [51].We randomly selected 2% of the samples for duplicate genotyping. The concordance of SNP genotype calls was > 99% for duplicated samples. Among the 620,901 markers on HumanHap610 chip, we excluded those that were copy number variation markers, did not yield genotypes, variants with minor allele frequency (MAF) less than 0.01 or with call rate < 95%. We further removed SNPs that deviated from Hardy-Weinberg equilibrium in the controls at P < 0.0001. These
procedures left 556,429 SNPs for the final analysis. The validation population consists of the primary scan of the NCI bladder cancer GWAS (available on dbGaP), which includes five studies with 3,532 cases and 5,120 controls of European ancestry [15, 34]. These five studies are Spanish Bladder Cancer Study (SBCS), New England, Maine and Vermont Bladder Cancer Study (NEBCS-ME/VT), Alpha-Tocopherol, Beta-Carotene Cancer Prevention Study (ATBC), the American Cancer Society Cancer Prevention Study II Nutrition Cohort (CPS-II), and the Prostate, Lung, Colorectal and Ovarian Cancer Screening Trial (PLCO). The same ICD codes as Texas GWAS were used for patient selection.
Pathway definition and annotation
The molecular signature database (http://www.
broadinstitute.org/gsea/msigdb/) from Broad Institute was used to define gene sets/pathways, which were composed of positional gene sets, curated gene sets, motif gene sets, computational gene sets and GO gene sets. We downloaded the 880 canonical pathways for GSEA. To avoid the overly narrow and broad definition of a biological pathway, we confined the input pathway to contain 10-100 genes per pathway, resulting in 781 pathways in our GSEA analysis (Supplementary Figure. 1). Among these, 151 pathways were selected from KEGG
(http://www.genome.jp/kegg/), 214 were from Biocarta
(http://www.biocarta.com/), 377 were from Reactome
(http://www.reactome.org/), and 39 were from other resources. Biocarta generally has the smallest pathway size in terms of the number of gene in each pathway, with a median gene number of 18 per pathway. In contrast, KEGG pathway has the largest size with a median gene
number of 44 per pathway. The significant pathways selected by GSEA were input into the Ingenuity Pathway Analysis tools (http://www.ingenuity.com/index.html) for functional annotation.
SNP-gene map
Gene information was downloaded from NCBI dbSNP build 36.3. SNP information was from the Illumina HumanHap610 chip and validated by USCS genome browser (http://genome.ucsc.edu/). SNPs were mapped to gene region and ±20KB upstream and downstream of gene boundaries to cover the gene coding region and most of the regulatory components.
Statistical analysis
Data preparation
To assess the association between each SNP
and disease status, we built a 2x2 contingency table by counting the number of times each possible allele appears
in a case or control and allelic 1 degree of freedom (d.f.)
test implemented in PLINK was performed similar to the primary GWAS analysis [14]. We conducted quantile-quantile plot analysis to assess the distribution of chi2 test statistics of all GWAS SNPs using the R installed package snpMatrix (http://www.bioconductor.org/packages/2.3/ bioc/html/snpMatrix.html) and hexbin (http://cran.r-project.org/web/packages/hexbin/index.html). Deviation of observed data from expected results might indicate the possibility of population stratification, inadequacy of case-control matching, or differential genotyping in cases and controls. We randomly permuted the case-control status 1000 times in order to test the presence of differential genotyping. In each permutated data the same number of
cases and controls was generated and an allelic 1 d.f. test
statistic and P value was re-calculated for each SNP using the permuted case-control status. We applied three GSEA methods for comparison to determine which pathway(s) associated with bladder cancer were likely true findings, not derived by chance. For all methods, pathways with P values < 0.05 were considered significant.
Pathway analysis
GenGen [28]
The statistic value of each gene was represented by the highest statistic value among all SNPs mapped to the
at the top of entire ranked list of genes in the genome:
, where NR = ∑Gj*∈s|r(j*)|p, p was the weight to genes with
extreme statistic values. The enrichment score, ES(S), indicated the maximum deviation of the sum of the statistic values in gene set S from a set of randomly picked genes in the genome. Normalized enrichment score,
was used which enabled
the comparisons among different gene sets [27]. Aligator [30]
Aligator utilizes a predefined threshold P-value of 0.01 wherein significant SNPs were defined on the basis of less than the predefined threshold. If a gene had one or more than one significant SNP, the gene was considered significant. Assume the total number of significant gene was K in the overall data. The number of significant genes
was counted for each gene set. To determine the statistical
significance of the gene set, 5000 replicate gene lists were generated by randomly selecting SNPs from all available SNPs and adding the genes that encompass the SNP to
the gene list until the size of the gene list reached K. The
P-value for each gene set was evaluated by comparing the number of significant genes from the observed data to the number of significant genes from the 5000 replicate gene lists. To correct for multiple testing, the program randomly selected one replicate gene list as the observed data and sample 5000 gene lists with replacement from the 5000 replicate gene lists. P-values for each gene set were calculated as before, using permutation. This procedure was repeated 1000 times to determine whether there was a significant excess of significant gene sets.
SNP ratio test [29]
For a given pathway W, the SNP ratio rw = the
number of significant SNP in W / the number of SNPs in W. The empirical P value for a particular pathway, P =
(s+1)/(N+1), where s is the number of simulated datasets that produce a ratio greater than or equal to the original ratio, and N is the total number of simulated datasets.
Gene and SNP analysis
We selected SNPs identified in the pathway analyses above for validation in a second dataset from the already published NCI GWAS [15]. The P values of the distribution of genotypes of these SNPs between case
and controls were assessed by allelic 1 degree of freedom
(d.f.) test in both Texas and NCI populations. For SNPs to be considered “validated”, the differential distribution of the genotypes in cases vs. controls in the validation group is consistent with the discovery population (same direction of change), and also both their associations with bladder cancer risk are significant at P < 0.05. A
meta-analysis of the Texas and NCI populations was also used to further support the findings. Imputation of the SNPs at gene region of interest for Texas bladder cancer GWAS data was conducted by Impute 2 software (The University of Oxford http://mathgen.stats.ox.ac.uk/ impute/impute_v2.html) using 1000 genomes data (http:// www.1000genomes.org/) as reference panel.
CONFLICTS OF INTEREST
The authors declared they have no conflicts of
interest.
FUNDING SUPPORT
This work was supported by National Institutes of Health grant CA127615 to X.W., the UTHealth Innovation for Cancer Prevention Research Post-doctoral Fellowship (CPRIT grant #RP101503) to M.C., and Duncan Family Institute Junior Faculty Fellowship of UT MD Anderson Cancer Center to M.C.
REFERENCES
1 Siegel, R, Miller, KD, Jemal, A. Cancer statistics, 2015. CA Cancer J Clin. 2015; 63: 11-30.
2 Hartge, P, Silverman, D, Hoover, R, Schairer, C, Altman, R, Austin, D, Cantor, K, Child, M, Key, C, Marrett, LD et al. Changing cigarette habits and bladder cancer risk: a case-control study. J Natl Cancer Inst. 1987; 78: 1119-1125. 3 Vineis P, Simonato L. Proportion of lung and bladder
cancers in males resulting from occupation: a systematic approach. Arch Environ Health. 1991; 46: 6-15.
4 Reulen RC, Kellen E, Buntinx F, Brinkman M, Zeegers MP. A meta-analysis on the association between bladder cancer and occupation. Scand J Urol Nephrol Suppl. 2008; 64-78. 5 Scelo G, Brennan P. The epidemiology of bladder and
kidney cancer. Nat Clin Pract Urol. 2007; 4: 205-217. 6 Aben KK, Witjes JA, Schoenberg MP, Hulsbergen-van de
Kaa C, Verbeek AL, Kiemeney LA. Familial aggregation of urothelial cell carcinoma. Int J Cancer. 2002; 98: 274-278. 7 Kramer AA, Graham S, Burnett WS, Nasca P. Familial
aggregation of bladder cancer stratified by smoking status. Epidemiology. 1991; 2: 145-148.
8 Aben KK, Baglietto L, Baffoe-Bonnie A, Coebergh JW, Bailey-Wilson JE, Trink B, Verbeek AL, Schoenberg MP, Alfred Witjes J, Kiemeney LA. Segregation analysis of urothelial cell carcinoma. Eur J Cancer. 2006; 42: 1428-1433.
9 Purcell SM, Wray NR, Stone JL, Visscher PM, O’Donovan MC, Sullivan PF, Sklar P. Common polygenic variation contributes to risk of schizophrenia and bipolar disorder. Nature. 2009; 460: 748-752.
J, Koskenvuo M, Pukkala E, Skytthe A, Hemminki K. Environmental and heritable factors in the causation of cancer—analyses of cohorts of twins from Sweden, Denmark, and Finland. N Engl J Med. 2000; 343: 78-85. 11 Horikawa Y, Gu J, Wu, X. Genetic susceptibility to
bladder cancer with an emphasis on gene and gene-environmental interactions. Curr Opin Urol. 2008; 18: 493-498.
12 Kiemeney LA, Sulem P, Besenbacher S, Vermeulen SH, Sigurdsson A, Thorleifsson G, Gudbjartsson DF, Stacey SN, Gudmundsson J, Zanon C, Kostic J, Masson G, Bjarnason H, et al. A sequence variant at 4p16.3 confers susceptibility to urinary bladder cancer. Nat Genet. 2010; 42: 415-419. 13 Kiemeney, L.A., Thorlacius, S., Sulem, P., Geller, F., Aben,
K.K., Stacey, S.N., Gudmundsson, J., Jakobsdottir, M., Bergthorsson, J.T., Sigurdsson, A. Blondal T, Witjes JA, Vermeulen SH, et al. Sequence variant on 8q24 confers susceptibility to urinary bladder cancer. Nat Genet. 2008; 40, 1307-1312.
14 Wu X, Ye Y, Kiemeney LA, Sulem P, Rafnar T, Matullo G, Seminara D, Yoshida T, Saeki N, Andrew AS, Dinney CP, Czerniak B, et al. Genetic variation in the prostate stem cell antigen gene PSCA confers susceptibility to urinary bladder cancer. Nat Genet, 2009; 41: 991-995.
15 Rothman N, Garcia-Closas M, Chatterjee N, Malats N, Wu X, Figueroa JD, Real FX, Van Den Berg D, Matullo G, Baris D, Thun M, Kiemeney LA, Vineis P, et al. A multi-stage genome-wide association study of bladder cancer identifies multiple susceptibility loci. Nat Genet, 2010; 42: 978-984.
16 Rafnar T, Vermeulen SH, Sulem P, Thorleifsson G, Aben KK, Witjes JA, Grotenhuis AJ, Verhaegh GW, Hulsbergen-van de Kaa CA, Besenbacher S, Gudbjartsson D, Stacey SN, Gudmundsson J et al. European genome-wide association study identifies SLC14A1 as a new urinary bladder cancer susceptibility gene. Hum Mol Genet. 2011; 20:4268-4281
17 Garcia-Closas M, Ye Y, Rothman N, Figueroa JD, Malats N, Dinney CP, Chatterjee N, Prokunina-Olsson L, Wang Z, Lin J. Real FX, Jacobs KB, Baris D, et al. A genome-wide association study of bladder cancer identifies a new susceptibility locus within SLC14A1, a urea transporter gene on chromosome 18q12.3. Hum Mol Genet. 2011; 20:4282-4289.
18 Rothman N, Garcia-Closas M, Chatterjee N, Malats N, Wu X, Figueroa JD, Real FX, Van Den Berg, D, Matullo G, Baris D, Thun M, Kiemeney LA, Vineis P, et al. (2010) A multi-stage genome-wide association study of bladder cancer identifies multiple susceptibility loci. Nat Genet. 2010; 42: 978-984.
19 Garcia-Closas M, Malats N, Silverman D, Dosemeci M, Kogevinas M, Hein DW, Tardon A, Serra C, Carrato A, Garcia-Closas R, Lloreta J, Castaño-Vinyals G, Yeager M, et al. (2005) NAT2 slow acetylation, GSTM1 null genotype, and risk of bladder cancer: results from the Spanish Bladder
Cancer Study and meta-analyses. Lancet. 2005; 366: 649-659.
20 Moore LE, Baris DR, Figueroa JD, Garcia-Closas M, Karagas MR, Schwenn MR, Johnson AT, Lubin JH, Hein DW, Dagnall CL, Colt JS, Kida M, Jones MA, et al. GSTM1 null and NAT2 slow acetylation genotypes, smoking intensity and bladder cancer risk: results from the New England bladder cancer study and NAT2 meta-analysis. Carcinogenesis. 2011; 32: 182-189.
21 Eichler EE, Flint J, Gibson G, Kong A, Leal SM. Moore JH, Nadeau JH. Missing heritability and strategies for finding the underlying causes of complex disease. Nat Rev Genet. 2010; 11: 446-450.
22 Kiemeney LA, Grotenhuis AJ, Vermeulen SH, Wu X. Genome-wide association studies in bladder cancer: first results and potential relevance. Curr Opin Urol, 2009; 19: 540-546.
23 Hakonarson H, Wang K, Li, MY. Analysing biological pathways in genome-wide association studies. Nature Reviews Genetics. 2010; 11: 843-854.
24 Wang K, Zhang H, Kugathasan S, Annese V, Bradfield JP, Russell RK, Sleiman PM, Imielinski M, Glessner J, Hou C, Wilson DC, Walters T, Kim C, et al. Diverse genome-wide association studies associate the IL12/IL23 pathway with Crohn Disease. Am J Hum Genet. 2009; 84: 399-405. 25 Peng G, Luo L, Siu H, Zhu Y, Hu P, Hong S, Zhao J,
Zhou X, Reveille JD, Jin L, Amos CI, Xiong M. Gene and pathway-based second-wave analysis of genome-wide association studies. Eur J Hum Genet. 2010; 18: 111-117. 26 Luo L, Peng G, Zhu Y, Dong H, Amos CI, Xiong M.
Genome-wide gene and pathway analysis. Eur J Hum Genet. 2010; 18: 1045-1053.
27 Baranzini SE, Galwey NW, Wang J, Khankhanian P, Lindberg R, Pelletier D, Wu W, Uitdehaag BM, Kappos L, Polman CH, Matthews PM, Hauser SL, Gibson RA et al. Pathway and network-based analysis of genome-wide association studies in multiple sclerosis. Hum Mol Genet. 2009; 18: 2078-2090.
28 Wang K, Li M, Bucan M. (2007) Pathway-based approaches for analysis of genomewide association studies. Am J Hum Genet. 2007; 81: 1278-1283.
29 O’Dushlaine C, Kenny E, Heron EA, Segurado R, Gill M, Morris DW, Corvin A. The SNP ratio test: pathway analysis of genome-wide association datasets. Bioinformatics, 2009; 25: 2762-2763.
30 Holmans P, Green EK, Pahwa JS, Ferreira MA, Purcell SM, Sklar P, Owen MJ, O’Donovan MC, Craddock N. Gene ontology analysis of GWA study data sets provides insights into the biology of bipolar disorder. Am J Hum Genet. 2009; 85: 13-24.
31 Nam D, Kim J, Kim SY, Kim S. GSA-SNP: a general approach for gene set analysis of polymorphisms. Nucleic Acids Res. 2010; 38: W749-754.
Peters U, Hsu, L. Insights into colon cancer etiology via a regularized approach to gene set analysis of GWAS data. Am J Hum Genet. 2010; 86: 860-871.
33 Menashe I, Maeder D, Garcia-Closas M, Figueroa JD, Bhattacharjee S, Rotunno M, Kraft P, Hunter DJ, Chanock SJ, Rosenberg PS, Chatterjee N. Pathway analysis of breast cancer genome-wide association study highlights three pathways and one canonical signaling cascade. Cancer Res, 2010; 70: 4453-4459.
34 Menashe I, Figueroa JD, Garcia-Closas M, Chatterjee N, Malats N, Picornell A, Maeder D, Yang Q, Prokunina-Olsson L, Wang Z, Real FX, Jacobs KB, Baris D, et al. Large-scale pathway-based analysis of bladder cancer genome-wide association data from five studies of European background. PLoS One. 2012; 7: e29396.
35 Harbour JW, Dean DC. The Rb/E2F pathway: expanding roles and emerging paradigms. Genes Dev. 2000; 14: 2393-2409.
36 Klein EA, Assoian RK. Transcriptional regulation of the cyclin D1 gene at a glance. J Cell Sci, 2008; 121: 3853-3857.
37 Malumbres M, Barbacid M. Cell cycle, CDKs and cancer: a changing paradigm. Nat Rev Cancer. 2009; 9: 153-166. 38 Malumbres M, Barbacid M. To cycle or not to cycle: a
critical decision in cancer. Nat Rev Cancer. 2001; 1: 222-231.
39 Ye Y, Yang H, Grossman HB, Dinney C, Wu X, Gu J. (Genetic variants in cell cycle control pathway confer susceptibility to bladder cancer. Cancer. 2008; 112: 2467-2474.
40 Cam H, Dynlacht BD. Emerging roles for E2F: beyond the G1/S transition and DNA replication. Cancer Cell. 2003; 3: 311-316.
41 Richter J, Wagner U, Kononen J, Fijan A, Bruderer J, Schmid U, Ackermann D, Maurer R, Alund G, Knönagel H, Rist M, Wilber K, Anabitarte M, et al. High-throughput tissue microarray analysis of cyclin E gene amplification and overexpression in urinary bladder cancer. Am J Pathol. 2000; 157: 787-794.
42 Heldin CH, Ostman A, Ronnstrand L. Signal transduction via platelet-derived growth factor receptors. Biochim Biophys Acta. 1998; 1378: F79-113.
43 Hirata T, Nagai H, Koizumi K, Okino K, Harada A, Onda M, Nagahata T, Mikami I, Hirai K, Haraguchi S. Jin E, Kawanami O, Shimizu K, et al. Amplification, up-regulation and over-expression of C3G (CRK SH3 domain-binding guanine nucleotide-releasing factor) in non-small cell lung cancers. J Hum Genet. 2004; 49: 290-295. 44 Takai S, Tanaka M, Sugimura H, Yamada K, Naito Y, Kino
I, Matsuda M. Mapping of the human C3G gene coding a guanine nucleotide releasing protein for Ras family to 9q34.3 by fluorescence in situ hybridization. Hum Genet. 1994; 94: 549-550.
45 Bernales S, Papa FR, Walter P. Intracellular signaling by the
unfolded protein response. Annu Rev Cell Dev Biol. 2006; 22: 487-508.
46 Kokame K, Agarwala KL, Kato H, Miyata T. Herp, a new ubiquitin-like membrane protein induced by endoplasmic reticulum stress. J Biol Chem. 2000; 275: 32846-32853. 47 Zabaneh D, Balding DJ. A genome-wide association study
of the metabolic syndrome in Indian Asian men. PLoS One, 2010; 5: e11961.
48 Ridker PM, Pare G, Parker AN, Zee RY, Miletich JP, Chasman DI. Polymorphism in the CETP gene region, HDL cholesterol, and risk of future myocardial infarction: Genomewide analysis among 18 245 initially healthy women from the Women’s Genome Health Study. Circulation. Cardiovascular genetics, 2009; 2: 26-33. 49 Smith EN, Chen W, Kahonen M, Kettunen J, Lehtimaki
T, Peltonen L, Raitakari OT, Salem RM, Schork NJ, Shaw M, Srinivasan SR, Topol EJ, Viikari JS, et al. Longitudinal genome-wide association of cardiovascular disease risk factors in the Bogalusa heart study. PLoS Genet. 2010; 6: e1001094.
50 Fridley BL, Jenkins GD, Tsai YY, Song H, Bolton KL, Fenstermacher D, Tyrer J, Ramus SJ, Cunningham JM, Vierkant RA. Chen Z, Chen YA, Iversen E et al. Gene set analysis of survival following ovarian cancer implicates macrolide binding and intracellular signaling genes. Cancer Epidemiol Biomarkers Prev. 2012; 21: 529-536.