Assessing Dar es Salaam port logistics chain players’ service
delivery factors and level of their integration for port
efficiency and competitiveness
Walter Eliakunda1 , Mary Mashoke2, Leticia3 and Zuberi Gurisha4
1. Walter Kissimbo Eliakunda - Bcom, MBA University of Dar Es Salaam, CSP (T), Diploma in port operation management and harbors Technique, handling of dangerous goods and statistics - APEC- Belgium, certificate of handling dangerous goods and safety advisor- In Went/BLG-Germany
2. Mary Mashoke – MA. BA, Diploma in education
3. Leticia Edward Mihayo, MSc in Computer Science – UDOM, Postgraduate Diploma in Scientific Computing, Advanced Diploma in Information Technology
4. Zuberi Gurisha Hamis- MSc Urban Planning and Management -Ardhi University
Post Graduate Diploma in Urban Planning and Management -Ardhi University, Advanced Diploma in Transport Management
Abstract
Port competitiveness is judged not only by the amount of cargo it handles, but cargo clearance speed, delivery reliability, and logistics visibility (Slack et al., 2016). Poorly performing ports in terms of logistics efficiency substantially reduce trade volume and has greater damping impact on port competitiveness (David, 2015). Cargo movement in seaport faces stiff competition because each port strives to increase its share of global sea throughput. The objective of this paper is to assess the role of Dar es Salaam port logistics chain players’ service provision and integration in promoting logistic efficiency and competitiveness. Specifically, the study aimed at assessing and rating the factors affecting the performance of port service providers and their degree of integration in providing logistic services. Logistics efficiency for port competitiveness depends on the player’s service provision and how they are integrated in service delivery. The study examined the level of technology in place among logistics players and the way they integrate documentation process and inter process communication. Survey method was used where questionnaires were distributed to 126 logistics chain service providers and users. Descriptive statistics, was used in data analysis. The findings of the study are that the port needs to synchronize the clearance process, improve inter process communication and harmonise the processes to improve logistics efficiency and competitiveness. The problem of high duties and logistics charges , lack of single clearance window and many agencies handling cargo clearance need to be addressed as they have an influence on the efficiency and effectiveness of the port.
Theme: Logistics Efficiency for Port Competitiveness Keywords: Port Logistics chain, Efficiency, Competitiveness
INTRODUCTION
In today’s world, port competitiveness is not judged by the amount of cargo it handles alone, but also by cargo clearance speed, cargo delivery reliability, and logistics visibility(Slack et al., 2016). As clearing houses for a major portion of the world increase international flow, port logistics efficiency frontier becomes an important issue (Baluch and Edward, 2010). Poorly performing port in terms of logistics efficiency substantially reduce trade volume and has greater damping impact on port competitiveness (David, 2015). Cargo movement in seaport faces stiff competition as most of the ports strive to increase their share of global sea throughput. Ports continue to face increased pressure to be more time and cost efficient to maintain their market share and acquire more cargo (Baluch and Edward, 2010). Thus the debate on port logistics efficiency in seaport currently dominates maritime transport studies worldwide (Hirimba, 2015). Ports with high logistics efficiency such as Singapore, Hong Kong, and Rotterdam have increased their cargo and market share while ports with logistics inefficiency such as Dar es Salaam, Mombasa and Lagos continue to lose their market share (World bank, 2016). An international port handling cargo flow needs to be efficient in order to attract more volume, improve country competitiveness and efficiency in port operations as well as reduction in logistics costs, barriers to international trade and cost of doing business to the economy in order to attract global investment (Jasmine and liz, 2013)
poor service quality of its logistics chain players dealing with logistics efficiency or low integration of those players in providing service ((Slack et al., 2016, Obed, 2013) or both. Studies on the cause of port logistics chain efficiency require an examination of how the logistics chain players offer their services (Baluch, 2005). Despite the importance of logistics efficiency in ports, empirical evidence shows that the theoretical benefits of speed logistics efficiency in developing countries are limited (Baluch and Edwards, 2010). Further, empirical evidence shows that most of ports logistics efficiency in developing countries are barriers to trade (Baluch., 2005).The debate exists as to why there is logistics inefficiency in developing countries ports (Vinh et al, 2014). Ports in developing countries experience numerous incidences of logistics efficiency that are not well explained by existing theories of port performance. Among the available port performance theories are dwell time theories(Baluch and Edwards, 2010), port productivity theories , and key productivity theories (Ali and Hasssan, 2015). These theories were formulated before the transitions in developing countries ports thus failing to explain better why cargo delay in developing countries. ports.
Hebel, (2012) explains that logistics efficiency in ports allows scholars to test the applicability of existing theories that were developed in other countries and to identify hidden issues. Dwell time figures are the major commercial instrument used to attract cargo, therefore, the incentives for ports is to lower them in order to attract more cargo (Refas and Thomas., 2011). Dwell time explain how long the cargo stay in the port from the date entered to the date exit. It is one of the variables for measuring port efficiency in moving cargo. It is not surprising that cargo dwell time, port congestion and high logistics costs are an illustration of the more general problem in African development. Average cargo dwell time in African ports is about 14 days compared with 3 days in most of the international ports, yet neither of the solutions seems to be working (World Bank, 2015). Increasing port charges tariffs, adding additional berths and increasing port infrastructure and superstructures, as the previous port performance theories suggest, have not brought down the dwell time figures to the acceptable level (Baluch and Edward, 2010).
Dwell time in Sub Saharan African ports have abnormal dispersion, with evidence that clearance chain discretionary behaviors increase logistics inefficiencies and rise in total logistics costs (TICTS, 2014; Baluch and Edwards, 2010; Ali and Hassan, 2015). Cargo clearance time in most of Sub Saharan countries was estimated to be five times higher than in developed countries (Samwel, 2014). Some scholars believe that inefficiency of port logistics chain player are the major causes of high dwell time in Sub Saharan Africa ports but still, there is information gap on the effects of logistic firm involved in cargo movement process (Refas and Thomas, 2011)
Despite the crucial role played by the port to Tanzania economy which handles about 80% of the country's inward and outward cargo, Tanzania port is rated among the most costly and inefficient port in East African region (Hebel, 2012). There still a research gap on what lead to delays in cargo clearance at ports in Tanzania. The application of superstructure and infrastructure theories by improving the Dar es Salaam port cargo handling equipment and port space fail to explain the determinants of logistics inefficiency in Dar es Salaam port. Most of those aspects can be improved through the studies of how the players integrate into cargo clearance.
STATEMENT OF THE PROBLEM
Dar es Salaam port has experienced port congestion, high cargo dwells time and high logistic cost and has lost its market share to Mombasa port on handling transit cargo for Uganda, Rwanda, and Burundi (World Bank, 2016). The World Bank report indicates that Tanzania looses USD 1.8 billion annually due to inefficient logistic services at the Dar es Salaam port and this loss is approximately 7 percent of the country’s total GDP. If Dar es Salaam port could perform as Mombasa port, Tanzania and its neighboring countries could earn up to USD 2.6 billion more a year (World Bank, 2016).
Studies focused on why cargo stay in weeks in Sub –Saharan African ports and indicated areas for further research as the logistics chain service provision in terms of how each player provide its service and how they are integrated as single process (Refas and Thomas, 2011, Rabolland et al., (2012). The current study intends to fill the gap by focusing on logististic chain players service provision and how the players integrate to ascertain Dar es salaam port logisticts efficiency and port competitiveness
RESEARCH OBJECTIVES
The main objective of this research is to assess Dar es Salaam port logistics chain players’ service provision for efficiency and competitiveness
Specific objectives are:
1. To ascertain factors affecting the performance of different logistics service providers in Dar es salaam port 2. To assess the degree of logistics chain players integration in providing logistics services.
LITERATURE REVIEW
Jasmine and Liz (2013) distinguished between cargo movement in the port and storage coordination by claiming that the former is concerned with operations and coordination while the latter deals with how logistics players integrate. For the purpose of improving port efficiency, attention must be directed towards integrating all processes into a single cargo movement in the port. Cargo movement in the port is completed once the documents pass different logistics chain service providers processes in the port. Logistics efficiency depends on how those Port logistic chains provide their services and the fact that the communication system does not talk to each other forces documents to be transferred manually (Hebel, 2012). The ports of most African countries find it challenging to be efficient in their daily operations (Refas and Thomas, 2011). Cargo movement in the port logistics chain players is defined as private, public and government institutions involved in movement and storage of goods as an integrated process into single clearance process. The systems approach is a powerful theory for understanding the interrelationship or interactions between elements (Von Bertalaffy ,1956) The systems approach simply states that all functions or activities or elements need to be understood in terms of how they affect and are affected by other elements and activities with which they interact. By analyzing the actions in isolation, one will not understand the big picture or how such actions affect or is affected by other activities (Baluch, 2005). The theory explain better how logistics chain players are expected to perform at the port. The movement of cargo depends on the extent those players work as a system in processing the documents and moving the cargo at the port.
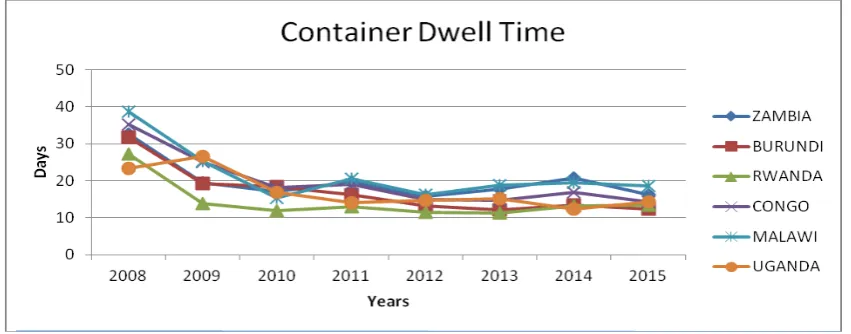
Cargo movement at the port involves different processes undertaken by different organizations. Freight forwarders need to make sure documents pass through all processes before cargo moves out of the port (Samwel, 2014). The processes are undertaken by different organizations and time to accomplish each process determines how long the cargo stays in port. Overall cargo movement at the port is concerned with operations and coordination while operations deal with strategic movement and storage, however, attention must be directed to integrating all service factors delivery into a single cargo clearance (Vihn et al., 2014). There is a need to look into the cargo movement in the port service quality factors and how they affect cargo movement in terms of cost and speed (World Bank, 2015). Statistics show that despite some improvement in logistics efficiency over time in Dar es Salaam port the container dwells time still is very high (Figure1.1). The port has associated higher logistics cost with cargo storage, removal charges, demurrage and customs warehouse rent. Key determinant of dwell time is the efficiency of logistic service provider to process documents for cargo movement through the international trade requirements
Figure 1.1: Dar es Salaam port Container Dwell time 2008 -2015 ( SUMATRA, 2016)
Dar es Salaam port logistic chain involves different public and private organizations. The complexity of the chain rise on how those players operate as a single unit to enable cargo to move through the port (Baluch, 2005). Myang-Shitta (2015) associated the delays in port cargo movement with a number of factors including documentary requirements of all processes, lack of automation, out-dated procedures, insignificant use of information technology, lack of predictability, high charges in terms of customs duties, port charges and shipping line charges, corruption tendency, lack of transparency and cooperation of Other Government Department.
RESEARCH METHODOLOGY
Primary data was collected through sample survey. Data were analysed using SPSS where the factor analysis was used and both descriptive statistics and communalities conducted using a principal component method was used to arrive at the findings. An equamax rotation was used to determine the factor loadings and communalities. A communality is the extent to which items correlates with all other items. The higher the communality the better and it is since it indicates that larger amount of the variance in the variable has been extracted by the factor solution. For better measurement of factor analysis communalities should be 0.4 or greater (MacCallum et al., 2001).. A summated scale or score was calculated for each factor to determine which factor had the greatest influence. The KMO and Bartlett’s Test was used. It indicates the proportion of variance in the variables that might be caused by the underlying factors. Higher values close to 1.0 (i.e greater than .50) generally indicate that a factor analysis may be useful with the data. Factor loading using the rotated component matrix was also used.
PRESENTATION AND DISCUSSION OF FINDINGS
The reliability of the survey instrument was deemed satisfactory since the Cronbach Alpha and Guttman split-half coefficients were relatively high for all the items. The Cronbatchs Alpha and the split-split-half coefficient were 0.858 and 0.854, respectively. The study was conducted at the Dar Es Salaam Port Authority. The findings were analyzed and discussed in the context of the objectives of the study.
Demographic Profile
The demographic profile of the respondents are presented in tables 1.1 to 1.3. The majority of the firms were purely locally owned with the minority comprising of very few pure foreign owned, joint venture between foreign and local investor and Multinational company operating in Tanzania.
Table 1.1. Firm Identification
Frequency Percent
Valid
Government institution 1 0.8
Privte firms Purely local owned 111 88.1
Private firms Purely foreign owned but based in Tanzania 3 2.4
A joint venture between foreign and local investors 1 0.8
Multinational company operating in Tanzania 10 7.9
Total 126 100.0
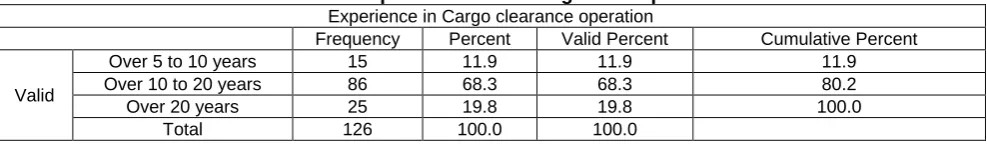
The findings also indicated that the majority of the firms had experience in port logistic operations for a period between 10 and 20 years (Table 6.2)
Table 1.2 : Experience in Port Logistics Operation Experience in Cargo clearance operation
Frequency Percent Valid Percent Cumulative Percent
Valid
Over 5 to 10 years 15 11.9 11.9 11.9
Over 10 to 20 years 86 68.3 68.3 80.2
Over 20 years 25 19.8 19.8 100.0
Total 126 100.0 100.0
In terms of educational level, a majority of the respondents had at least a Diploma level of education as shown in Table 1.3
Table 1.3: Level of Education of the respondents
Frequency Percent
Valid
O level 3 2.4
A level 15 11.9
Diploma 26 20.6
Degree 37 29.4
Postgraduate 32 25.4
6.00 13 10.3
Total 126 100.0
Findings on study objectives
Factors affecting different logistics service providers in Dar es salaam port
The research objective one was to ascertain factors affecting different logistics service providers in Dar es salaam port . The discussion focus on factors affecting different logistics service providers grouped in six categories namely Freight forwarding, Customs Authority, Other Government Department, Shipping line agencies, Terminal and ICDs and , Consolidator. Respondents were asked to indicate the extent to which they agree or disagree with the statements by applying a tick (√) using a 5 point Likert scale represented by 1= Strongly Disagree, 2=disagree 3= Neutral, 4 = Agree, 5 = Strongly agree. The responses were obtained using factor analysis as follows;
Factors affecting Freight forwarding service
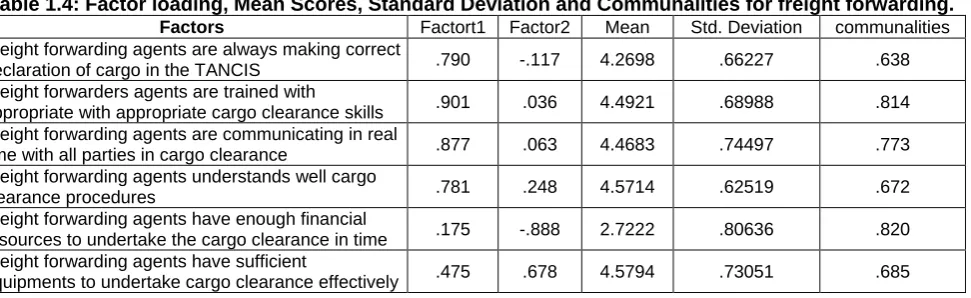
Respondents were asked to indicate their level of agreement or disagreement on the independent variables. Table 1.4 presents the factor loadings, mean, standard deviation and the communalities.
Table 1.4: Factor loading, Mean Scores, Standard Deviation and Communalities for freight forwarding.
Factors Factort1 Factor2 Mean Std. Deviation communalities Freight forwarding agents are always making correct
declaration of cargo in the TANCIS .790 -.117 4.2698 .66227 .638
Freight forwarders agents are trained with
appropriate with appropriate cargo clearance skills .901 .036 4.4921 .68988 .814 Freight forwarding agents are communicating in real
time with all parties in cargo clearance .877 .063 4.4683 .74497 .773
Freight forwarding agents understands well cargo
clearance procedures .781 .248 4.5714 .62519 .672
Freight forwarding agents have enough financial
resources to undertake the cargo clearance in time .175 -.888 2.7222 .80636 .820 Freight forwarding agents have sufficient
equipments to undertake cargo clearance effectively .475 .678 4.5794 .73051 .685
Communalities:
Extraction Method: Principal Component Analysis. a. 2 components extracted.
The findings indicate that respondents agreed on the statements stated in table with exception of the fifth statement. Respondents disagreed that freight forwarding have no enough financial resources to undertake cargo clearance in time. The mean for this statement is below .3 ie 2.7222 while for other statement the mean is above .3. This basically means that freight forwarding agents are always making correct declaration of cargo in the TANCIS, are trained with appropriate with appropriate cargo clearance skills, are communicating in real time with all parties in cargo clearance, understands well cargo clearance procedures and have sufficient equipments to undertake cargo clearance effectively. All the communalities are greater than 0.4 with the highest being .820. The findings also indicate that the KMO is greater than .5 and the findings are statistically significant at 0.000. Refer to the KMO findings in the table below
Table 1.5: KMO and Bartlett's Test for freight forwaeding factors KMO and Bartlett's Test
Kaiser-Meyer-Olkin Measure of Sampling Adequacy. .787
Bartlett's Test of Sphericity
Approx. Chi-Square 307.452
Df 15
Sig. .000
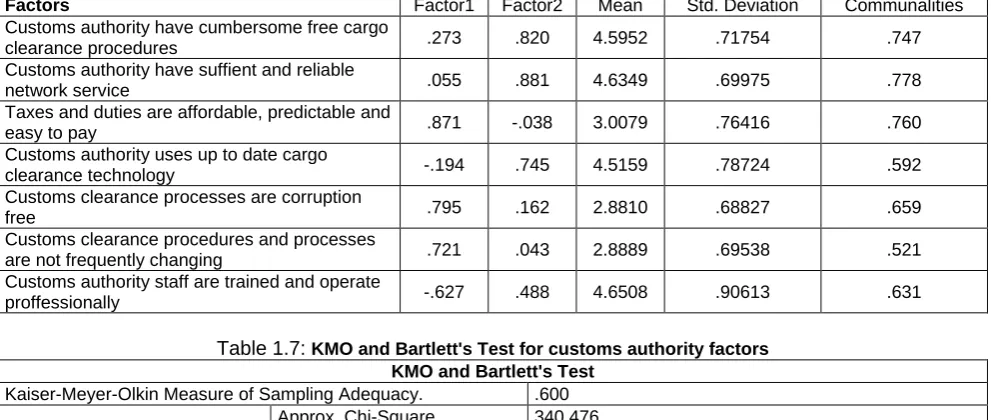
Factors affecting Customs Authority Service
Respondents were asked to rate their level of agreement and disagreement on factors relating to customs authority.
Table 1.6: Mean Score, factor loading and communalities for customs authority factors
Factors Factor1 Factor2 Mean Std. Deviation Communalities
Customs authority have cumbersome free cargo
clearance procedures .273 .820 4.5952 .71754 .747
Customs authority have suffient and reliable
network service .055 .881 4.6349 .69975 .778
Taxes and duties are affordable, predictable and
easy to pay .871 -.038 3.0079 .76416 .760
Customs authority uses up to date cargo
clearance technology -.194 .745 4.5159 .78724 .592
Customs clearance processes are corruption
free .795 .162 2.8810 .68827 .659
Customs clearance procedures and processes
are not frequently changing .721 .043 2.8889 .69538 .521
Customs authority staff are trained and operate
proffessionally -.627 .488 4.6508 .90613 .631
Table 1.7: KMO and Bartlett's Test for customs authority factors KMO and Bartlett's Test
Kaiser-Meyer-Olkin Measure of Sampling Adequacy. .600
Bartlett's Test of Sphericity
Approx. Chi-Square 340.476
Df 21
Sig. .000
Factors affecting Other Government Department service
The study considered other government department factors and how they affect business to business services. The findings are as presented below.
Table 1.8: Mean Score, factor loadings and communalities for other government department factors Mean Score, factor loadings and communalities for other government department factors
Factors Factor1 Factor 2 N Mean Std. Deviation Communality OGDs cargo clearance procedures are
cumbersome .664 -.071 126 1.8016 .97996 .445
OGDs charges are affordable, predictable
and easy to pay .773 .240 126 1.6032 .67028 .655
OGDs procedures and processes are
frequently changing .827 .175 126 1.6032 .83980 .714
OGDs clearance are corruption free .754 .251 126 1.4841 .61624 .631
OGDs staff are correctly and accurately
implement their procedures .293 .686 126 1.5000 .57619 .556
OGDs provide its service electronically .304 .752 126 1.6190 .77828 .658 OGDs offices are located in places easy to
reach -.120 .751 126 2.8175 1.46643 .578
Valid N (listwise) .664 -.071 126 .445
The findings indicate that most of the respondents disagreed with all the variables concerning other government department factors. Respondents disagreed that OGDs cargo clearance procedures are cumbersome, OGDs charges are affordable, predictable and easy to pay, OGDs procedures and processes are frequently changing, OGDs clearance are corruption free, OGDs staff are correctly and accurately implementing their procedures, OGDs provide its service electronically, and OGDs offices are located in places easy to reach. With respect to these OGD factors, the mean is below .3 and therefore the authority and policy implementers must real concentrate on these OGD factors in order to improve business to business services. All the communalities are above 0.4 with the highest being .714, the KMO is above .6 and the findings were also statistically significant at 0.000. Consider the KMO test results below
Table 1.9: KMO and Bartlett's Test for OGD factors KMO and Bartlett's Test
Kaiser-Meyer-Olkin Measure of Sampling Adequacy. .701
Bartlett's Test of Sphericity
Approx. Chi-Square 268.051
Df 21
Sig. .000
Factors affecting Shipping line agency services
Shipping line factors were also considered to influence business to business. The findings on these factors were as follows;
Table 1.10: Mean Score, factor loading and communalities for shipping line agency factors Mean Score, factor loading and communalities for shipping line agency factors
Factors Factor1 Factor 2 Factor 3 N Mean Std.
Deviation Communalities Shipping line procedures are cumbersome
free .881 -.057 -.001 126 4.1984 .92104 .780
Shipping line charges and deposits are
affordable, predictable and easy to pay .061 -.124 .890 126 3.1984 .86736 .812 Shipping line procedures are
understandable .790 .247 -.159 126 4.4841 .77701 .710
Shipping line systems are well automated .153 .794 .165 126 4.3016 .82239 .681 Shipping line services are corruption free -.429 .180 .702 126 3.2302 .85942 .709 Shipping line officers are located near to
other cargo clearance service providers and are ease to reach
-.032 .847 -.176 126 3.2222 1.00311 .750
Valid N (listwise) 126
The findings as indicated in the table above shows that most respondents agreed on the statement that Shipping line procedures are cumbersome free, Shipping line procedures are understandable and Shipping line systems are well automated. The mean for these variables is above .3 while some respondents were neutral and most of them disagreed with the statements that Shipping line charges and deposits are affordable, predictable and easy to pay, Shipping line services are corruption free, and Shipping line officers are located near to other cargo clearance service providers and are ease to reach. These factors are very crucial to business to business services, it is therefore important for the authority to consider improving each of these factors. All the communalities were above 0.4 with the highest being .812 and the KMO test confirm that was useful and the findings were statistically significant at 0.000. Consider the table below,
Table 1.11: KMO and Bartlett's Test shipping line factors KMO and Bartlett's Test
Kaiser-Meyer-Olkin Measure of Sampling Adequacy. .541
Bartlett's Test of Sphericity
Approx. Chi-Square 109.599
Df 15
Sig. .000
Factors affecting Terminal and ICDs service
Terminal and ICD factors influence business to business services. Respondents were asked to indicate their level of agreement or disagreement on the determined factors. The findings of the study are as indicated in the table below.
Table 1.12: Mean Score, factor loadings and communalities for terminal and ICD factors Mean Score, factor loadings and communalities for terminal and ICD factors
Factors Factor 1 Factor 2 Factor 3 N Mean Std.
Deviation Communalities Terminal and ICDs procedures are
cumbersome free .607 .239 -.074 126 4.1032 .82781 .435
Terminal and ICDs have sufficient and appropriate cargo handling equipment for cargo
.202 .866 .129 126 4.2063 .92362 .802
Terminal and ICDs process are corruption
fee -.325 .103 .896 125 3.3440 .96807 .919
Terminal and ICDs charges are affordable ,
predictable and easy to pay .260 -.622 .659 126 3.3492 .97421 .887
Terminal and ICDs have sufficient space
for cargo storage .835 -.046 -.098 126 4.4444 .87229 .710
Terminal and ICDs process are well
automated .648 .256 -.055 126 4.4365 .80495 .484
Terminal and ICDs staff are well trained
and offer service professionally .445 .699 -.182 126 4.4603 .93510 .720
The findings indicate that most of the respondents agreed that Terminal and ICDs procedures are cumbersome free, Terminal and ICDs have sufficient and appropriate cargo handling equipment for cargo, Terminal and ICDs have sufficient space for cargo storage, Terminal and ICDs process are well automated and Terminal and ICDs staff are well trained and offer service professionally. On the other hand some respondents disagreed and other were neutral on the statement that Terminal and ICDs process are corruption fee, and Terminal and ICDs charges are affordable , predictable and easy to pay. The issue of corruption and terminal charges needs to be considered when improving business to business services. All the communalities were higher above 0.4 with the highest being .919. The KMO test indicates was useful at .536 and the findings were statistically significant at 0.000.
Table 1.13: KMO and Bartlett's Test for terminal and ICD factors KMO and Bartlett's Test
Kaiser-Meyer-Olkin Measure of Sampling Adequacy. .536
Bartlett's Test of Sphericity
Approx. Chi-Square 222.909
Df 21
Sig. .000
Factors affecting Consolidation service
Consolidator factors are important in influencing business to business services. Respondents were asked to indicate their level of agreement and disagreement on the stated factors. The findings are as indicated in the table below;
Table 1.14: Mean Score, factor loadings and communalities for consolidator factors Mean Score, factor loadings and communalities for consolidator factors
Factors Factor 1 Factor 2 Factor
3 N Mean
Std.
Deviation Communalities Consolidators procedures are
cumbersome free .117 -.081 .904 126 4.1190 3.70212 .838
consolidators charges are affordable,
predictable and ease to pay -.300 .746 .020 126 3.1429 .96924 .648
Consolidators’ procedures are
understandable .637 -.345 .127 126 4.1032 1.06455 .541
Consolidators’ systems are well
automated .728 .385 .235 126 3.6825 1.07071 .734
Consolidators’ services are corruption
free .139 .777 -.065 126 3.0635 .90108 .627
Consolidators’ officers are located near to other cargo clearance service providers and are easy to reach
.666 -.128 -.492 126 2.9921 .86252 .702
Valid N (listwise) 126
The findings above indicate that most of the respondents were neutral and some agreed with the statement that Consolidators procedures are cumbersome free and Consolidators’ procedures are understandable. The findings further indicate that most of the respondents were neutral and some disagreed with the statement that consolidators charges are affordable, predictable and ease to pay, Consolidators’ systems are well automated, and Consolidators’ services are corruption free. The communalities were also high above 0.4 with the highest being .838. The findings show that the KMO was above .5 and were also statistically significant at 0.000. Consider the KMO test results below.
Table 1.15: KMO and Bartlett's Test for consolidators factors KMO and Bartlett's Test
Kaiser-Meyer-Olkin Measure of Sampling Adequacy. .514
Bartlett's Test of Sphericity
Approx. Chi-Square 59.058
df 15
Sig. .000
Assessing the degree of logistics chain intergration
asked to indicate their level of agreement or disagreement basing on the 5 Likert scales. The mean of their respondents on the factors are as presented in the table below
Table 1.16: Mean Score, factor laoding and communalities for degree of logistics chain integration factors Mean Score, factor laoding and communalities for degree of logistics chain integration factors
Factors Factor 1 Factor 2 N Mean Std. Deviation Communalities Cargo clearance are concurrent and
not sequentially .328 .724 126 1.6667 .92087 .632
Cargo clearance service providers effective communication between each others
.757 .289 126 1.4683 .85498 .657
Cargo clearance service providers are
electronically connected .854 .026 126 1.4603 .84523 .730
Cargo clearance service providers
have harmonised procedures .827 -.147 126 1.5794 .96626 .705
Cargo clearance service provider has
one clearance platform .198 -.796 126 3.1667 1.43527 .673
Valid N (listwise) .328 .724 126 .632
The findings indicate that most of the respondents disagreed with the statements relating to service provider factors. Respondents disagreed with the statements that Cargo clearance are concurrent and not sequentially, Cargo clearance service providers effective communication between each others, Cargo clearance service providers are electronically connected and Cargo clearance service providers have harmonized procedures. However, few respondents were neutral and some agreed with the statement that Cargo clearance service provider has one clearance platform. The findings imply that service provider factors need to be improved in order to improve business to business services. All the communalities were above 0.4 with the highest being .730. On the other side the KMO is above .5 and the findings were statistically significant at 0.000. Consider the KMO test results below.
Table 1.17: KMO and Bartlett's Test for logistics chain integration factors KMO and Bartlett's Test
Kaiser-Meyer-Olkin Measure of Sampling Adequacy. .647
Bartlett's Test of Sphericity
Approx. Chi-Square 127.503
df 10
Sig. .000
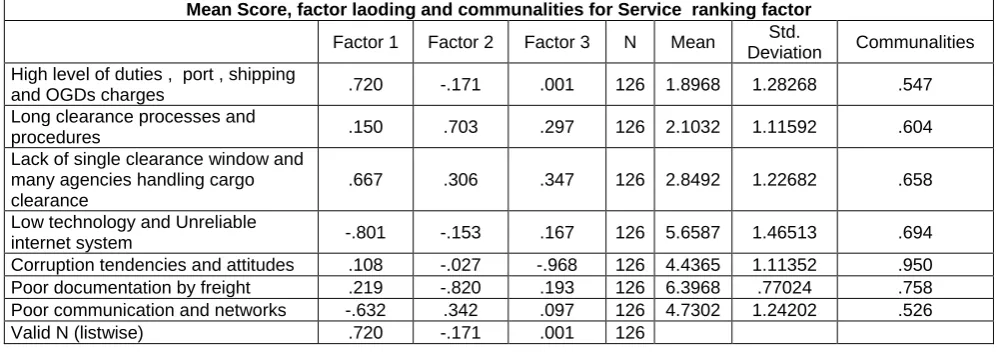
Ranking factors affecting logistics efficiency and competitivenes
The study further rank factors affecting logistics efficiency and competitiveness in Dar es salaam port as its objective three.Respondents were asked to rank the factors affecting logistics efficiency and competitive in the port of Dar es Salaam with 1 being most affecting and 7 less affecting. The findings are as presented in the table below.
Table 1.18: Mean Score, factor laoding and communalities for Service ranking factor Mean Score, factor laoding and communalities for Service ranking factor
Factor 1 Factor 2 Factor 3 N Mean Std.
Deviation Communalities High level of duties , port , shipping
and OGDs charges .720 -.171 .001 126 1.8968 1.28268 .547
Long clearance processes and
procedures .150 .703 .297 126 2.1032 1.11592 .604
Lack of single clearance window and many agencies handling cargo clearance
.667 .306 .347 126 2.8492 1.22682 .658
Low technology and Unreliable
internet system -.801 -.153 .167 126 5.6587 1.46513 .694
Corruption tendencies and attitudes .108 -.027 -.968 126 4.4365 1.11352 .950
Poor documentation by freight .219 -.820 .193 126 6.3968 .77024 .758
Poor communication and networks -.632 .342 .097 126 4.7302 1.24202 .526
Valid N (listwise) .720 -.171 .001 126
speed of cargo clearance at the Dar es Salaam port. On the other hand most respondents stated that Low technology and Unreliable internet system, Poor documentation by freight and Poor communication and networks are less affecting the speed of cargo clearance at the Dar es Salaam port. Most respondents stated that Corruption tendencies and attitudes neither most affect nor less affects the speed of cargo clearance at the Dar es Salaam port. In general most of the respondents stated that this variable do not affect the speed of cargo clearance at the Dar es Salaam port. All the communalities were high above 0.4 with the highest being 0.950. The findings are similar to the suggestions of Ali and Hassan, 2015. On contrary, the KMO test indicated that the variables were useful for PCA since it was below .5 i.e 0.138 but the findings were statistically significant at 0.000. The KMO test confirms the results.
Table 1.19: KMO and Bartlett's Test for Service ranking factor KMO and Bartlett's Test
Kaiser-Meyer-Olkin Measure of Sampling Adequacy. .138
Bartlett's Test of Sphericity
Approx. Chi-Square 281.956
df 21
Sig. .000
CONCLUSIONS AND RECOMMENDATIONS
The objective of this research was to assess Dar es Salaam port logistics chain players’ service provision for efficiency and competitiveness through ascertain factors affecting different logistics service providers in Dar es salaam port, assess the degree of logistics chain players integration in providing logistics services and rank factors affecting logistics efficiency and competitiveness.
The above results shows that each logistics service provider had issues to address in order to improve the port logistics efficiency and competitiveness. Each logistics chain players namely Freight forwarding, Customs Authority, Other Government Department, Shipping line agency, Terminal and ICDs, Consolidator had different factors to address as shown above. For the port logistics efficiency and competitiveness its paramount to address those factor affecting specific logistics service providers exaoustively.
For the issues of degree of logistics chain players intergration the study noted that the port need to address aspect of cargo clearance process to be concurrent, logistics service providers should effective communication between each other, improve logistics service providers electronically connecting and harmonized procedures in service provision.
Study further reveals that ,there is a need to address issue of high level of duties, port, shipping, and OGDs charges, long clearance processes and procedures, Lack of single clearance window and many agencies handling cargo clearance those factors most affect the overall logistic efficiency and competitiveness of the port of Dar es salaam.
Basing on the findings, it can be concluded that these factors should be addressed by both the players and the Ports Authority in order to ensure efficiency and effectiveness of the port..
REFERENCES
Aidas, V.V. (2015). An economic evaluation model of the logistics system based on container transportation Transport. Journal of transport and logistics 2(3):51-59.
Ali, A.H.Y., and Hassan, J. (2015). Cargo and Container Dwell Time Reduction: Effective Strategy to Increase the Efficiency of Trans Ports, Journal of social issues and humilities 3(1):15-25.
Baluch, I. and Edwards, C.H.W. (2010). Transports Logistics: The Wheel of Commerce Ivy House publishing USA. Baluch, I. (2005). Transport Logistics: Past, Present and Predictions. Winning Books Dubai United Arabs Emirates’.
David, H.; (2015). Weakness in the Supply chain: who packed the box? World Customs Journal. 4:11-21. World Custom Organization Australia
Hebel, M. (2012). Port Performance Indicators. ELSVER A case of Dar es Salaam Port UNCTAD. Working paper 4
Hirimba, O.M., (2015). Port Service Quality from shipping line perspective. Diss, Arab academy for science Technology and maritime Transport. Riyadh Saudi Arabia
Jasmine, S. L. L. and Li-Z. (2013). Enhanced logistics services provider framework for higher integration and efficiency in maritime logistics. International Journal of Logistics Research and Applications. 5(2):23-31.
Maocallum.,R; Widaman, F., Preache, J., and Sehee Hong,S.,(2001)Samle size in factor Analysis: The role of model Error. Multivariate Behavioral Research, 36(4), 611-637
Moon, W.(2013). The impact of port operations on efficient ship operation: From both economic and environmental perspectives. Paper presented at the International Conference of the International Association of Maritime Economists (IAME), Marseilles, France.
Myung – Shintta, (2015). A Comparison of service quality and major container ports: Implication for Korean Ports. Journal of Transport Geography. 3: 78-99.
Obed, B. C. (2013). A critical Assessment of Delay Factors and effects on Productivity in Nigerian Ports Authority: A case study or Ports complex: Diss, University of technology Oweri Imostale Nigeria.
Refas S.,.and Thomas, C. (2011). Why does cargo spend weeks in African Ports? The case of Duala Cameron: World Bank Policy Research Working Paper 5565.
Samwel, M. N. A (2014). Factors influencing container Terminal Efficiency. A case of Mombasa entry port. European Journal of Logistics Purchasing and Supply Chain Management. 2(3) 39-78.
Slack,1., Talley W., Manwo Ng and Erika M (2016). Port Service chain and port performance evaluation. Transportation Reserarch Part E. 3:67-78 www.elsevier. Com/locate/tre site visited on 12.09.2018.
TICTS (2014). Dar es Salaam Port Report Africa Journal of Transport. 2:62-78.
Vinh, V.T., Wei, J. T., Raymond, M.N and Alan, A (2014). Defining service quality in Tramp shipping conceptual model and empirical evidence. The Asian Journal f shipping and logistics.3 (1): 1-29.
World Bank (2016). Tanzania Economic updates opening the gates. How the port of Dar es Salaam can transform Tanzania: ww.worldbank.org/Tanzania/economic up date. Text downloaded on 26/09/2018 Journal of transport. 30/(4): 421-432.