2nd International Conference on Current Research Trends in Engineering and Technology
© 2018 IJSRSET | Volume 4 | Issue 5 | Print ISSN: 2395-1990 | Online ISSN : 2394-4099 Themed Section: Engineering and Technology
Supervise Method for Acute Lymphoblastic Leukemia Segmentation
and Classification
Arpana Mahajan *
1, Dr. Sheshang D. Degadwala
2, Dhairya Vyas
3, Rocky Upadhyay
4 *1Assistant Professor, Computer Department, Sigma Institute of Engineering, Vadodara, Gujarat, India 2Head of Department, Computer Department, Sigma Institute of Engineering, Vadodara, Gujarat, India3Assistant Professor, EC Department, Sigma Institute of Engineering, Vadodara, Gujarat, India 4Assistant Professor, Computer Department, Sigma Institute of Engineering, Vadodara, Gujarat, India ABSTRACT
Leukemias are classified as either myelogenous (also called myeloid) or lymphocytic depending on which types of white blood cells are affected. Acute leukemias occur when the bone marrow produces immature white cells, and chronic leukemias occur when the marrow produces mature cells. Acute lymphoblastic leukemia (ALL) is a type of cancer in which the bone marrow makes too many immature lymphocytes (a type of white blood cell). Leukemia may affect red blood cells, white blood cells, and platelets. ALL is most common in childhood, with a peak incidence at 2–5 years of age and another peak in old age. Here is an automatic segmentation technique that uses two-color systems and the clustering algorithm K-means. The proposed approach is evaluated on three public image databases with different characteristics and performance measures: accuracy, specificity, sensitivity and Kappa index. Segmentation and classification of acute lymphoblastic leukemia can be done by using Supervise Learning Approach. In that hybrid model with color and cluster system will be used.
Keywords: Acute lymphoblastic, WBC, SVM, K-Means
I.
INTRODUCTIONLeukemia is a blood cancer originated from abnormality blood cell in the bone marrow. The differential diagnosis may be associated with an elevated leukocyte count and a left shift. So, patients with acute leukemia may also present with low leukocyte counts together with anaemia and thrombocytopenia. It is critical to distinguish these malignant diseases, which require rapid therapeutic intervention, from benign hematologic disorders. White blood cells (WBC) or leukocytes play a significant role in the diagnosis of different diseases (including Leukemia), [4] and therefore, extracting information about that is valuable for hematologists.
Leukemia refers to a progressive, malignant disease of the blood-forming organs. Complete blood count process is the first step for leukemia screening. The pathology is characterized by the uncontrolled accumulation of immature white blood cells [4].The four main types of leukemia are Acute Myelogenous Leukemia (AML); Acute Lymphoblastic Leukemia (ALL); Chronic Myeloid Leukemia (CML); Chronic Lymphocytic Leukemia (CLL).
II.
CLASSIFICATION OF ACUTE LYMPHOBLASTIC LEUKEMIA [11]chromatin, a regular nuclear shape, and small or no nucleoli, scanty cytoplasm, and mild to moderate basophilia.
Figure 1: ALL-L1 [11]
ALL-L2: This Figure 2 shows All-L2 type of image which contains Large, heterogeneous cells with variable nuclear chromatin, an irregular nuclear shape, 1 or more nucleoli, a variable amount of cytoplasm, and variable basophilia.
Figure 2: ALL-L2 [11]
ALL-L3: This Figure 3 shows All-L3 type of image which contains Large, homogeneous cells with fine, stippled chromatin; regular nuclei; prominent nucleoli; and abundant, deeply basophilic cytoplasm. The most distinguishing feature is prominent cytoplasmic vacuolation.
Figure 3: ALL-L3 [11]
After studying and analysing various papers, it is found that many work have been done on Segmentation of WBC. But till now the no methods exists for accurate leukemia type classification using Machine Learning. So, it is necessary to avoid such kind of limitations by using the method that can work within such scenario where, it is possible to classify the leukemia fever type for any blood cell image to improve the accuracy of the system with all kind of environments.
III.
NEED FOR RESEARCH AND MOTIVATION
The WBC leukaemia has been observed in many patient. The Exudate leukaemia Disease is mainly divided into four types. Doctors need to capture approximately 20 to 50 pictures of WBC from different angle to identify the disease and its location. still, the result was not so efficient in providing the spatial detail information of the actual disease part.
Figure 4: Symptoms of Acute Lymphoblastic Leukemia [13]
IV.
PROPOSED SYSTEM
These are several steps which describes the proposed work as follows
Step 1: Input ALL
The image will be input from the All idb dataset. Step 2: Pre-Processing
In this step, Image is converted into grey scale using Histogram Equalization technique.
Step 3: Segmentation
This step segment the image into regions. For that it uses segmentation methods like FCM, means, K-means LAB, K-K-means LAB-CMYK.
Step 4: Feature Extraction
• Extract the features from segmented image. i.e centroid, area, major axis, minor axis, perimeter etc..
• Features can be extracted using Texture. In that Harlik, Glicm techniques are used.
Step 5: Classification
This step involves classification of the image. It classify weather it is all-1, all-2 or all-3. For that SVM, ANN, RF, NB algorithm can be used.
Figure 5: Proposed System
V.
Experimental ResultTable 1: Implementation Results
Original Image Ground truth K means result CMYK LAB
Table 2: Comparative Analysis
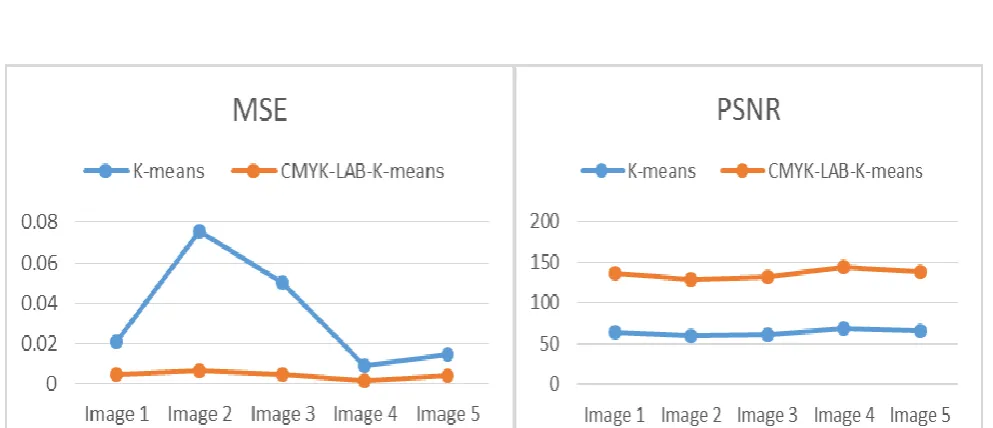
Figure 6: Graphical Representation of MSE and PSNR
VI. CONCLUSION
Segmentation is considered an important step in the automatic diagnosis of different computer systems. It was found that several methods based on cluster based and color based in the literature have shown promising results. As per the analysis it’s prove that Cluster and Color based Combine method gives accurate segmentation then K-means. So In propose work Consider color and fuzzy cluster based segmentation method and extract the texture features(i.e Contrast, Correlation, Energy,
VII. REFERENCES
[1] R.G Bagasjvara , Ika Candradewi , Sri Hartati , Agus Harjoko “Automated Detection and Classification Techniques of Acute Leukemia using Image Processing: A Review “ 2016 [2] Luis H. S. Vogado1, Rodrigo de M. S. Veras1,
Alan R. Andrade1, Flavio H. D. de Araujo2, Romuere R. V. e Silva2, Fatima N. “UnsupervisedLeukemiaCellsSegmentationBas edonMulti-spaceColorChannels”
[3] Jakkrich Laosai and Kosin Chamnongthai
Images K-means CMYK-LAB-K-means
PSNR MSE PSNR MSE
Image 1 64.9322 0.0209 71.8647 0.0042
Image 2 59.3415 0.0757 70.1910 0.0062
Image 3 61.1181 0.0503 71.6905 0.0044
Image 4 68.7857 0.0086 76.1435 0.0016
Engineering “Classification of Acute Leukemia Using CD Markers”
[4] “Acute Leukemia Classification by Using SVM and K-Means Clustering “Jakkrich Laosai and Kosin Chamnongthai
[5] Mashiat Fatma Jaya Sharma “ Identification and Classification of Acute Leukemia Using Neural Network “
[6] Ansha Beevi S., Remya R.S. “An Overview on Acute Lymphocytic Leukemia Detection using Cell Image Segmentation” IOSR Journal of Computer Engineering (IOSR-JCE) e-ISSN: 2278-0661,p-ISSN: 2278-8727, PP 22-29 www.iosrjournals.org
[7] Sonali Mishra, Banshidhar Majhi, Pankaj Kumar Sa, Lokesh Sharma “Gray level co-occurrence matrix and random forest based acute lymphoblastic leukemia detection” Biomedical Signal Processing and Control 33 (2017) 272–280
[8] Sabina Chiaretti, Gina Zini,and Renato Bassan “Diagnosis and Subclassification of Acute Lymphoblastic Leukemia” Mediterr J Hematol Infect Disv.6(1); 2014 PMC4235437
Books
[9] Digital image processing third edition, Rafael C. Gonzalez, Richard E. Woods, Pearson publication.
Links
[10] https://homes.di.unimi.it/scotti/all/
![Figure 3: ALL-L3 [11]](https://thumb-us.123doks.com/thumbv2/123dok_us/1225234.1626674/2.595.89.269.395.554/figure-all-l.webp)
![Figure 4: Symptoms of Acute Lymphoblastic Leukemia [13]](https://thumb-us.123doks.com/thumbv2/123dok_us/1225234.1626674/3.595.69.529.599.743/figure-symptoms-acute-lymphoblastic-leukemia.webp)