Detection of Silver Ion Percolation Through
Integrated Constructed Wetland and Sand
Filters
Mahesh Gajanuru Snehal Deshmukh
Assistant Professor Assistant Professor
Department of Civil Engineering Department of Civil Engineering
Vidya Pratishthan’s College of Engineering, Baramati, India Vidya Pratishthan’s College of Engineering, Baramati, India,
Snehal Walke Apurv Vaidya
Assistant Professor Assistant Professor
Department of Civil Engineering Department of Civil Engineering
Vidya Pratishthan’s College of Engineering, Baramati, India Vidya Pratishthan’s College of Engineering, Baramati, India
Bhagyashri Sawant
Assistant Professor Department of Civil Engineering
Vidya Pratishthan’s College of Engineering, Baramti, India
Abstract
In the present research work, the percolation of metal ions particularly silver ion in the artificially constructed wetland filter bed. And the study has been focused on identifying the effects of soil and sand characteristics on the transport of Ag ions though the filter beds. And also to study the impact of added biomass concentration on Ag ion transport. The integrated system was fed with influent feed water, prepared by mixing biomass obtained in the aeration tank. The initial concentration of silver ion in the feed wastewater, the soil and sand materials were found using Atomic Absorption Spectrophotometer and also in EDX. The initial results were then compared with the results obtained after sacrificing the reactors. The comparison of results clearly shows that there is a considerable sinking of silver ion through the filter bed with a significant impact of soil and sand on the effluent water.
Keywords: Constructed wetland, filters, EDX, silver ion percolation, wetlands infiltration
________________________________________________________________________________________________________
I. INTRODUCTION
Large increases in the production and application of engineered nanoparticles inevitably result in the release of these materials into the natural environment. For many engineered nanoparticles, sewage and industrial discharges are the primary pathways of release (Boxall et al., 2007). Thus wastewater treatment plays an important role in controlling the release of engineered nanoparticles into the environments, e.g., into surface waters via effluent discharges and to land via sewage sludge disposal. However, reports on the fate of engineered nanoparticles during wastewater treatment processes are scarce. The behavior of engineered nanoparticles in wastewater treatment plants is largely unknown and has been identified as one of the major knowledge gaps for accurate environmental risk assessments of nanomaterials.
Recent studies have shown that environmental nanoparticles with their high surface area and reactivity may enhance the transport of contaminants in both surface waters and through soil media into the groundwater. Nanoparticle mobilization may be influenced by hydraulic gradients and preferential flow paths within the soil, particle size and morphology, competitive sorption-desorption processes with soluble ions and organic functional groups, pore size distribution, as well as dispersion-flocculation phenomena. Nanoparticle mobility may be limited by sequestration within micropores, coagulation into larger size aggregates that may lead to extensive straining even within macropores, and sorption or physical attachment to non-mobile particles.
biosolid-derived nanoparticles to sorb and transport Ag contaminants through soil filter media. The study also addresses the effects of physico-chemical properties of soil, sand and also the biomass on the rate of transport.
II. MATERIALS AND METHODS
Preparation and Characterization of Feed Water:
Wastewater was collected from Vasant Kunj, and then wastewater was given aeration for a minimum of 3 months continuously to aid the oxygen concentration. MLSS will be removed every day in order to maintain the biomass yield and the removed MLSS was taken out as influent biomass to prepare feed water in this study.
The biomass wastage is used as a source of silver ion, since Nano silver ion now a days is the most common and commercialized nanomaterials, and there are cases of leaching of silver ion into the water bodies also. The Ag ion suspension is prepared by mixing 10 ml of biomass with 100 ml tap water. The initial Ag ion concentration in the feed water was measured to be 0.271 mg/L, using Atomic Absorption Spectrophotometer.
Fabrication of Filter Beds and Characterization of Soil and Sand:
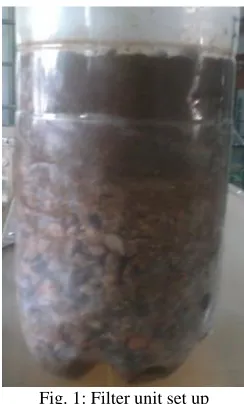
Fig. 1: Filter unit set up
The Coarse gravels (>2mm), sand (2mm) and soil (<2mm), was used to construct the filter column experiments. The pebbles and gravels were sieved in #1sieve, sand was sieved in # 10 sieves and the clay was sieved in a # 40 sieve. The porosity of the individual materials used in filter as well as the column was determined.All the filter materials are washed separately and are arranged in layers in a plastic container. Then the complete set up is again washed sequentially through tap water to remove the impurities. The filtrate was collected and analyzed for Ag ions.
Leaching experiments were conducted with soil and sand depths of 4 cm each below the surface with neutral pH (8.0) and 20% porosity initially. The pH of the soil (8.0) was considerably higher than the colloidal suspensions(6.8 to 7.4). The pH of the sand (8.0) was considerably higher than the colloid suspensions (6.8 to 7.4).
Experimental set up:
Experiment 1: Biomass + water only:
The biomass was collected and it is mixed with 100 ml tap water and the mixture was stored for 25 days in a reactor. Similarly another reactor was developed with same mixture proportions and the analysis was done on the same day. Then both samples were analyzed for silver ion presence.
Experiment 2: Biomass + water + soil column experiments:
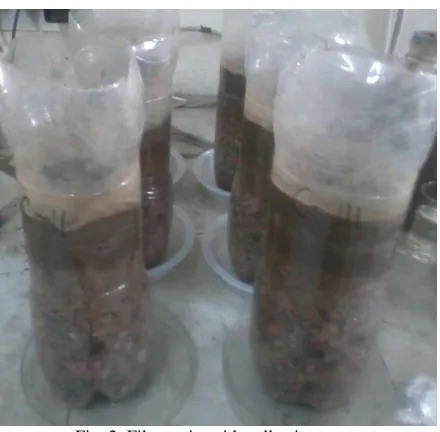
Fig. 2: Filter units with collection trays
Experiments were conducted according to the standard protocols presented under the methods part. Reactors were constructed and are initially fed with tap water to clean off the impurities present the soil, sand and the pebbles and gravels. After a repeated cleaning is done the reactors were fed with 1:10 mixture of biomass and water. The procedure is continued for 15 days, and the samples were collected for analysis. And then the reactors were left UN operated for 10 days to check for the stability. Similarly the experiment is continued for another 5 days.
Experimental conditions:
The biomass containing wastewater is used for preparing the sample. The reactors were placed in lab and exposed to light every day for 15 minutes to aid the evaporation of water. The atmospheric parameters are measured and reported in the table 2. This includes temperature, humidity and light intensity. Initial and final characterization of the sand, soil, pebbles and gravels were done as per USEPA guidelines.
Table – 1 Atmospheric and their levels
Parameter Range
Light intensity 872 Lux for 15 min
Temperature 36 +/-30C at 10 AM during exposure for 15 min everyday Photoperiod 16h light/8h darkness, assuming an average wavelength of 400 to700 nm;
Humidity 23+/-4% at 10 AM during exposure for 15 min everyday Test vessel 21x8cm plastic containers
Test Volume 110 mL
Replicates 3
Water type Tap water/drinking water
Test Duration 24hours.
Sample preparation for AAS analysis:
The Sand, soil, biomass and water samples were digested by following methods described by Joan E. McLean et al. (1992). For soil digestion, one gram of dry soil/sand samples were digested (wet acid digestion) with 10 mL of concentrated HNO3 and H2SO4 in 2:1 ratio and for wastewater, 100 ml sample 5 ml H2SO4 both are digested at 900C until a transparent solution was obtained. Ag metal ion was determined using atomic absorption spectrometry (model 4141, ECI). (Chabukdhara et al. 2012). (1g soil digested then diluted to 50 mL= 1g/0.05L; Silver ion in this diluted sample = 0.00395mg/g
Overall silver ion content in soil sample initially = (0.079 mg/L)/ (1g/ (0.05L) = (0.079*0.05) = 0.00395 mg/g silver ion. And similarly the sand silver ion concentration initially was = (0.099 mg/L)/ (1g/ (0.05L) = (0.099*0.05) = 0.00495 mg/g silver ion.
Sample preparation for EDX analysis:
Soil and sand samples were extracted from the reactor assembly before the installations and after sacrificing the reactors and the samples were dried, powdered and the fine powder was taken in the EDX sample port for the analysis.
III. RESULTS AND DISCUSSIONS
Experiment 1: Biomass With Water Only:
Experiment 2: Biomass From The Reactor Outlet:
Samples collected from all reactors were analyzed using AAS for Ag ion and are reported in the table 2.
Soil and sand characterization is done for both initial and final samples; the table 3 represents the porosity and pH. And Ag ion concentration in table 4.
Experimental Observations:
The transport of silver ions in the filter column was detected, after the suspension of 1:10 biomass and water mixture is fed over the filter media. Mass balance calculations were done for the influent and effluent feed water sample. Which shows decrease in Ag ion concentration?
Table – 2
Concentration of Ag ion in experimental and control reactors
PARAMETERS
CONCENTRATION of Ag ion in (mg/L)
Initial (after 1 day)
Final Cumulative of effluent from
2nd to 15th day
Cumulative of effluent between 27-31st day
EXPERIMENTAL (10 mL biomass +100 mL tap water)
E – I 0.169 0.0 0.0
E – II 0.387 0.032 0.0
E – III 0.258 0.0 0.0
Overall
Average 0.271333 0.010667 0.0
STD.DEV 0.10961 0.018475 0.0
CONTROL (No biomass from top)
C – I 0 0.0 0.0
C – II 1.538 0.0 0.0
C – III 0.069 0.08 0.0
Overall
Average 0.535667 0.026667 0.0
STD.
DEV 0.868731 0.046188 0.0
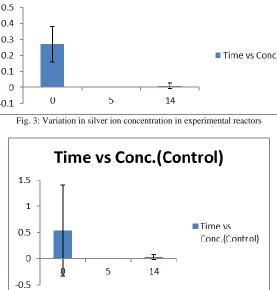
The results were plotted on the bar graph which gives the standard deviation from the average values of silver ion concentration in experimental reactor and also in control reactor. The figure 3 shows concentration change in experimental reactors and figure 4 shows the concentration change in control reactors.
Fig. 3: Variation in silver ion concentration in experimental reactors
Change in Porosity and pH of the Parameters
Table – 3
Soil characteristics (before and after the experiment)
Parameters Initial (from ground) Final (on 31st day after sacrificing the reactor)
Porosity (in Percent) Soil (top layer) 18 15
Sand 38 35
pH Soil 8.0 7.7
Sand 8.0 7.6
Change in Silver Ion Concentration
Table – 4
Silver ion concentrations in soil and sand
PARAMETERS CONCENTRATION of Ag ion in (mg/g)
Initial (0th day; before starting the experiment) Final (on 31st day after sacrificing the reactor)
Exp. Control
Soil
1 0.00395 0.0013 0.0001
2 0.00395 0.0013 0.0004
3 0.00395 0.0013 Not Detected
Sand
1 0.00495 0.001 0.0007
2 0.00495 Not detected Not detected
3 0.00495 Not detected Not detected
Since the soil bed in the reactors is exposed to silver contaminated water first and then consequently the sand and pebbles layer. It indicates that the probability of soil having higher concentrations of Ag ion than sand is more.
EDX Analysis Report
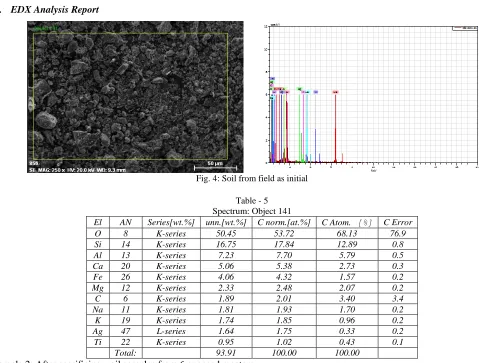
Fig. 4: Soil from field as initial Table - 5
Spectrum: Object 141
El AN Series[wt.%] unn.[wt.%] C norm.[at.%] C Atom. [%] C Error
O 8 K-series 50.45 53.72 68.13 76.9
Si 14 K-series 16.75 17.84 12.89 0.8
Al 13 K-series 7.23 7.70 5.79 0.5
Ca 20 K-series 5.06 5.38 2.73 0.3
Fe 26 K-series 4.06 4.32 1.57 0.2
Mg 12 K-series 2.33 2.48 2.07 0.2
C 6 K-series 1.89 2.01 3.40 3.4
Na 11 K-series 1.81 1.93 1.70 0.2
K 19 K-series 1.74 1.85 0.96 0.2
Ag 47 L-series 1.64 1.75 0.33 0.2
Ti 22 K-series 0.95 1.02 0.43 0.1
Total: 93.91 100.00 100.00
Sample Taken from Reactor E-I
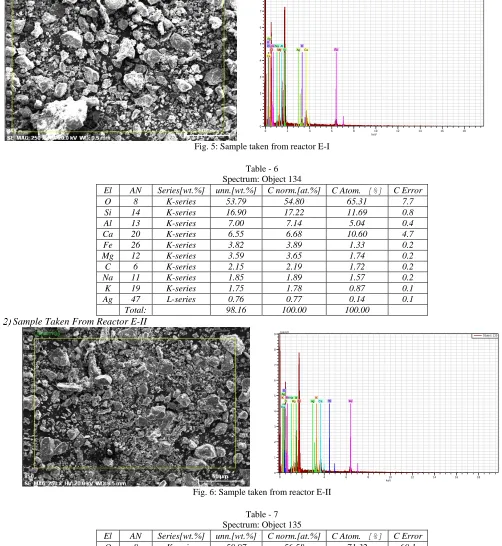
Fig. 5: Sample taken from reactor E-I Table - 6
Spectrum: Object 134
El AN Series[wt.%] unn.[wt.%] C norm.[at.%] C Atom. [%] C Error
O 8 K-series 53.79 54.80 65.31 7.7
Si 14 K-series 16.90 17.22 11.69 0.8
Al 13 K-series 7.00 7.14 5.04 0.4
Ca 20 K-series 6.55 6.68 10.60 4.7
Fe 26 K-series 3.82 3.89 1.33 0.2
Mg 12 K-series 3.59 3.65 1.74 0.2
C 6 K-series 2.15 2.19 1.72 0.2
Na 11 K-series 1.85 1.89 1.57 0.2
K 19 K-series 1.75 1.78 0.87 0.1
Ag 47 L-series 0.76 0.77 0.14 0.1
Total: 98.16 100.00 100.00
Sample Taken From Reactor E-II
Fig. 6: Sample taken from reactor E-II Table - 7
Spectrum: Object 135
El AN Series[wt.%] unn.[wt.%] C norm.[at.%] C Atom. [%] C Error
O 8 K-series 50.97 56.58 71.32 60.1
Si 14 K-series 17.94 19.91 14.30 0.8
Al 13 K-series 6.95 7.71 5.77 0.4
Ca 20 K-series 3.46 3.85 1.93 0.2
Fe 26 K-series 3.32 3.68 1.33 0.2
Mg 12 K-series 2.22 2.47 2.05 0.2
K 6 K-series 1.78 1.97 1.02 0.1
Na 11 K-series 1.77 1.97 1.73 0.2
Ag 47 L-series 0.87 0.96 0.18 0.1
0 2 4 6 8 10 12 14 16 18
keV 0 1 2 3 4 5 6 7 8 9 cps/eV
O Si C Al
Fe Fe
Ca Ca
Mg Na K K
Ag Ag
Ag
Object 134
0 2 4 6 8 10 12 14 16 18
keV 0 1 2 3 4 5 6 7 8 9 cps/eV
O Si Al Ca Ca Fe Fe Mg K K Na
Ti 22 K-series 0.80 0.89 0.37 0.1
Total: 90.09 100.00 100.00
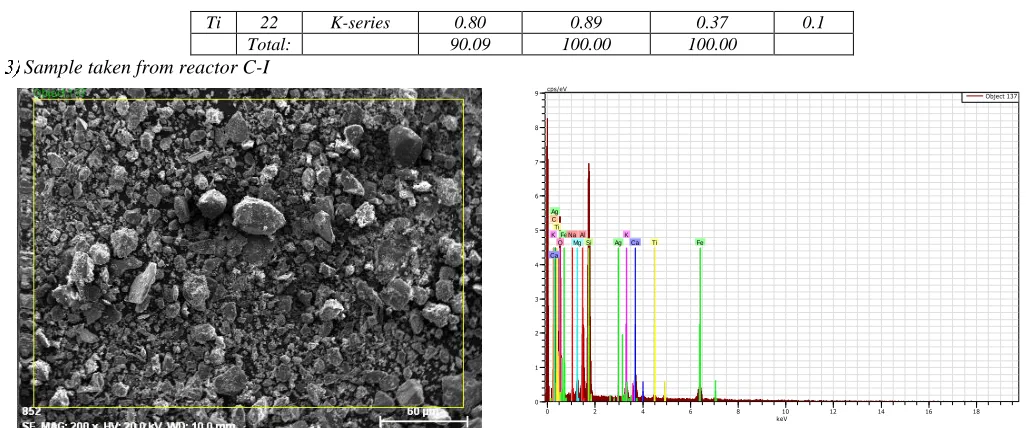
Sample taken from reactor C-I
Fig. 7: Sample taken from reactor C-I Table - 8
Spectrum: Object 137
El AN Series[wt.%] unn.[wt.%] C norm.[at.%] C Atom. [%] C Error
O 8 K-series 51.59 55.34 69.04 67.9
Si 14 K-series 16.91 18.14 12.89 0.8
Al 13 K-series 6.72 7.21 5.33 0.4
Fe 20 K-series 4.62 4.95 1.77 0.2
Ca 26 K-series 3.43 3.68 1.83 0.2
C 12 K-series 2.36 2.53 4.20 4.1
Mg 6 K-series 2.02 2.17 1.78 0.2
K 11 K-series 1.77 1.90 0.97 0.1
Na 19 K-series 1.58 1.70 1.48 0.2
Ag 47 L-series 1.14 1.23 0.23 0.2
Ti 22 K-series 1.07 1.15 0.48 0.1
Total: 93.91 100.00 100.00
Sample taken from reactor C-II
Fig. 8: Sample taken from reactor C-II Table - 9
Spectrum: Object 138
El AN Series[wt.%] unn.[wt.%] C norm.[at.%] C Atom. [%] C Error
O 8 K-series 51.52 55.94 67.95 74.4
Si 14 K-series 14.25 15.47 10.71 0.7
Al 13 K-series 6.53 7.09 5.11 0.4
C 6 K-series 4.46 4.84 7.83 7.7
Fe 26 K-series 4.13 4.49 1.56 0.2
0 2 4 6 8 10 12 14 16 18
keV 0 1 2 3 4 5 6 7 8 9 cps/eV
O Si Al Fe Fe Ca Ca Mg K K Ti Ti C Na Ag Ag Ag Object 137
0 2 4 6 8 10 12 14 16 18
keV 0 1 2 3 4 5 6 7 8 9 cps/eV
Mg 12 K-series 2.01 2.18 1.74 0.2
K 19 K-series 1.84 2.00 0.99 0.2
Na 11 K-series 1.46 1.59 1.34 0.2
Ti 22 K-series 1.05 1.14 0.46 0.1
Ag 47 L-series 0.86 0.94 0.17 0.2
Cl 17 K-series 0.34 0.37 0.20 0.2
Total: 92.10 100.00 100.00
IV.
C
ONCLUSIONThe research work presented in this report is dealt with the natural transport of metal ions through filters. The study had been focused on identifying the effects of soil characteristics on the transport of Ag ions though the filter beds. And also to study the impact of added biomass concentration on Ag ion transport. The following conclusions were drawn based on the analysis of results of the research.
1) Soil and sand we have used in this study have got pH of 8.0 initially, which were found decreased during at the end of experimentation.
2) EDX analysis for silver ion indicates that there is a considerable reduction in silver ion concentration from initial to till the experiment completion.
3) Porosity of soil and sand also found to be decreased at the end of experimentation. 4) The concentration of silver in all most all the reactors has become 0.
5) The concentration of silver ion in soil and sand is also getting reduced towards the end of the experiments.
REFERENCES
[1] Linlin Hou, Kaiyang Li, Yuanzhao Ding, Yan Li, Jian Chen, Xiaolei Wu,Xiqing Li, 2012. “Removal of silver nanoparticles in simulated wastewater treatment processes and its impact on COD and NH4 reduction”.Chemosphere 87 (2012) 248–252.
[2] Igboro S.B, Adeogun B.K, Saulawa, S. B and Adie D. B, 2010. “DESIGN AND CONSTRUCTION OF A DOMESTIC SLOW SAND FILTER USING THEKUBANNI RIVER SAND AS A FILTER MEDIU”. 6th Edition of the Material Society of Nigeria, Zaria Branch Book of Proceedings.
[3] Joan E. McLean* and Bert E. Bledsoe.“Behavior of Metals in Soils”.EPA ground water issue EPA/540/S-92/018, 1992.
[4] Yuan Tian, Bin Gao, Silvera Batista, Kirk J. Ziegler, 2010 “ Transport of engineered nanoparticles in saturated porous media”. J Nanopart Res 12:2371 - 2380.