University Optical Fibre Network Access
Optimisation: A Case Study
Christian A. Bolu,*, Ademisoye O. Tolulade**, Alimi Adeshina***
Department of Mechanical Engineering, Covenant University, Ota, Ogun State, Nigeria *[email protected]
**[email protected] ***[email protected]
Abstract-- For network access, it is always desired that a fibre optic network connectivity be the major area of cost minimization, while keeping quality of service as high as possible. This is because overall cost of setting up a fibre optic cable route is usually very high in relation to other components of the network.
In this study, three buildings clusters were mapped to the University Network Operating Center, and the network was developed as a fail-safe network, so that in the case of damage to a cable or connecting component, users are not cut out.
The problem was formulated as a Mathematical Programming problem and solved the resulting transportation problem using MATLAB linear programming solution. Results from the mathematical model shows an optimized cost for which a fibre Optic network connectivity can be further developed.
Index Term-- Optimisation Optical Fibre Cabling Access Network Dynamic Programming Linear Programming
I. INT RODUCT ION
The rapidly changing face of data communications and telecommunications has seen a continued growth in the need to transfer enormous amounts of information across large distances. Technologies such as coaxial cable, satellite and microwave radio are in use but optical fibre cabling is gaining ground as internet network backbone.
There is a growing requirement to provide a communications medium that is more suitable to the noisy industrial environment where the need for data integrity is paramount. Optical fibre is simply a very thin piece of glass which acts as a pipe, through which light can pass. The light that is passed down the glass fibre can be turned on and off to represent digital information or it can be gradually changed in amplitude, frequency, or phase to represent analog information. (David Bailey & Edwin Wright 2003)
II. FIBRE OPT ICS BASICS
a. Fibre Optics is a branch of optics dealing with the transmission of light through hair-thin, transparent fibres. It is also known as the technology of using “waveguides” to transport information from one point to another in the form of light. It is characterized as follows:
Optical Fibre: Thin strands of highly transparent glass or sometimes plastic that guide light.
Core: The centre of the fibre where the light is transmitted.
Cladding: The outside optical layer of the fibre that traps the light in the core and guides it along through curves.
Buffer Coating or Primary Coating: A hard plastic coating on the outside of the fibre that protects the glass from moisture or physical damage.
Mode: A single electromagnetic field pattern (think of a ray of light) that travels in fibre.
b. Optical Fibre Cabling can be classified as follows:
Multimode step and graded index fibres - The term „multimode‟ generally applies to fibres with a diameter of 50 micrometers or greater. Because of the relatively wide diameter of the core, multiple modes of light are able to travel down the fibre core. The modal dispersion that occurs in a multimode fibre affects or is affected by a number of operating parameters of the fibre. They are:
o Attenuation: Multimode fibres have a maximum operating distance of approximately 5km.
o Bandwidth: Multimode fibres have maximum operating data speed of approximately 2-300 Mbps
o Wavelength: They generally operate at wavelength of 850 nm or 1300 nm. The wide diameter of the multimode makes it suitable for LED light sources.
Single mode Fibres - A single mode fibre (or sometimes referred to as a single mode cable) is basically a step index fibre with a very small core diameter. In theory, because the cores are so small only a few modes of light can travel down the fibre. They have a very small core causing light to travel in a straight line and typically has a core size of 8 or 10 microns. It has unlimited bandwidth that can go unrepeated for over 80km, depending on the type of transmitting equipment. Single mode fibre has enormous information capacity, more than multimode fibre.
III. LIT ERAT URE REVIEW
Designing minimum-cost transport network for fibre optical network access has been in the literature on for over a decade now. Optical ring networks are widely regarded as essential to serve the unprecedented growth in demand for data transport capacity, largely driven by internet applications. Fibre optic cables are widely used in Access Networks. In other to determine a suitable „ring route‟ a network planner must specify its logical type, capacity, topological layout.
Dynamic programming principle has been successfully used for Network Planning. Aside from a few specific case studies of optical ring-based networking, most of the relevant literature for ring network optimization is found in the form of mathematical formulations for multi-ring network design problem. Most methods routed the demands using a shortest-path algorithm and select rings using either a heuristic algorithm or integer programming [Morley, 1999, Krendzel, Pirmez, 2010]
(Krendzel, 2012), formulated a routing problem in an Access Network ring structure as a combinatorial-optimization problem and dynamic programming was used to solve it. The problem of cable-laying ring routing between a Local Exchange and its Remote Units is considered. Their objective was to determine the minimum-cost ring route that satisfies the specified constraints which are:
1. To pass over the Local Exchange and all Remote Units,
2. To pass over each Remote unit only once,
3. To begin and to end in the same point corresponding to the Local Exchange,
4. To have no splits.
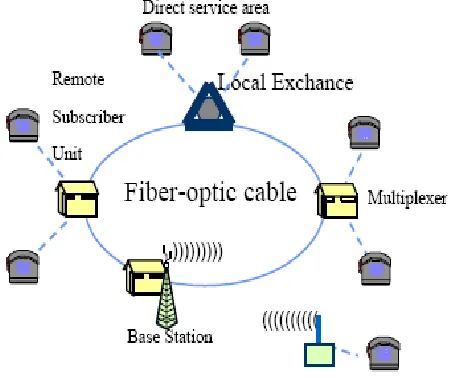
Fig. 1. Model of a perspective Access Network (Krendzel, accessed 2012)
(Kulkarni S. and El-Sayed, M, 2010) discussed some economic, technical and business drivers that impact the selection of the right fibre to the home technology for an operator to deploy. Here they focused on an optimized total cost of ownership (TCO) network model to evaluate different technological choices for new deployment and redeployment for both incumbent telecommunications and cable operators. (Ray, et al 2012), introduced the concept of a fibre aided wireless network architecture, which allows high-speed mobile connectivity by leveraging the speed of optical networks. As a first step towards designing such network architectures, they considered a single-input, single-output (SISO) wireless-optical channel and proposed a scheme in which the wireless signal at the radio-optical converter is sampled and quantized using a fixed-rate, memoryless, vector quantizer, before being sent over the fibre communication link.
IV. MET HODOLOGY
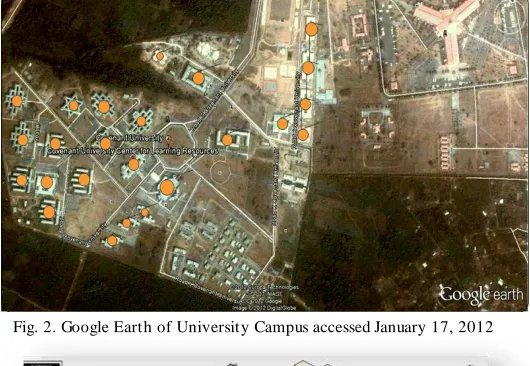
a. Network Representation- The first step in our methodology was to produce the Network Representation of the University showing the access network structure. Network representation provides a powerful visual and conceptual aid for portraying the relationship between the components of systems that is used.
The Access Network (AN) is based on a fibre-optic cable passing over a number of remotes units. The subscribers are connected to the Local Exchange (LE) and the remote units and subscriber lines. By a remote unit (RU) is meant a multiplexer, a remote subscriber unit, a base station (for wireless access) or a combination of these elements. (Krendzel, 2012).
Subscribers: In this case they are the Halls of Residence, Academic buildings, Cafeterias, Workshops, University Chapel, University Library, and Post-Graduate Quarters.
Base Station: Located in each of the subscriber unit, for ease of wireless access in each building and surrounding area.
Multiplexer: For distributing signals usually located in each of the base station.
Subscriber Lines (Indivi dual): Staff and Students .
Fig. 2. Google Earth of University Campus accessed January 17, 2012
Fig. 3. Network Representation of the University Network, using Microsoft Visio 2007
b. The Transportation Problem.
1. Known Capacity of Internet Bandwidth is available from three Bandwidth Supply Companies.
2. In the University, Known quantity of Bandwidth is distributed to a number of users in Academic, Administrative and Residential Buildings for use by staff and students.
3. The academic, administrative and residential buildings are interconnected to each other using Optical Fibre Cabling (OFC) with associated costs with respect to material, technology and logistics. The transportation problem is to determine the Bandwidth size to move from each Bandwidth Supply source to the various academic, administrative and residential buildings to
minimise the overall cost while satisfying the constraint of demand from staff and students in the University over a given period of time.
c. Supply Side (Internet Service Providers)
There are three supply companies which are:
ISP-1 provides the University with 25 Mbps (Megabyte) of internet data.
ISP-2 provides the University with 30 Mbps (Megabyte) of internet data.
ISP-3 supplies the University 30 Mbps (Megabyte) of internet data.
d. Formulation of the Problem
Here we will be formulating the transportation problem as linear programming problem.
Let = amount of bandwidth routed from ISP to cluster
Let = cost to route bandwidth 1 from ISP to user cluster
Let = required number of units at user cluster
Let = capacity of ISP
The problem can be formulated as a linear model,
namely (Gillett, 1979).
Minimize:
Subject to:
Equation 1: Supply Capacity Constraint
Equation 2: Bandwi dth Demand Constraint
all
Equation 3: Bandwi dth Non negativity Constraint
If at least one feasible solution exists, then there exists an optimal solution where all the values are integer or zero. The simplex method will produce this integer optimal solution If equation 1 is summed up over all , then
Likewise if equation 2is summed over all , then
Thus from equations 1 and 2,
Suppose
Minimize:
Subject to:
all
Where
Assumptions
a. Objective function will be: [(The cost of fibre per metre) x (the distance to run through) + (cost of mbps/annum) x (amount of mbps)]
b. 48 core single mode fibre optic cable at N450/m c. Taking 1mbps/month = $350
d. Exchange rate is NGN/US$ 170 e. Demand Nodes:
Academic Building/Administrative (A) using College of Development studies CDS as our point of reference.
Non Academic (B) using the University Chapel as our reference point
Residential/Non-Academic (C) using Cafeteria 2 as our reference point.
f. Based on preliminary demand analysis done (Bolu, 2010) we assume the following:
Point A needs 40Mbps due to:
o The high degree of work being done in the Building by the lecturers, Administrative staff, students in class who also use the e-learning portal and other internet activities.
o Population will be averagely highest here during the day except for lecture free day or public holidays.
Point B needs 25Mbps due to:
o Being a non-academic area, less work will be done here compared to the college/department buildings and student population will be randomly high.
Point C needs 20Mbps due to:
o Being residential - activities that will be done here will not be as intensive as at Point A. Activities like; Webinar (occasionally), Online conference meeting (occasionally), checking of mails, watching of academic videos online, and other social and academic download.
o Students/Staffs will only be at their residence in the evening or lecture free day or a general public holiday. During the day not many activities will take place.
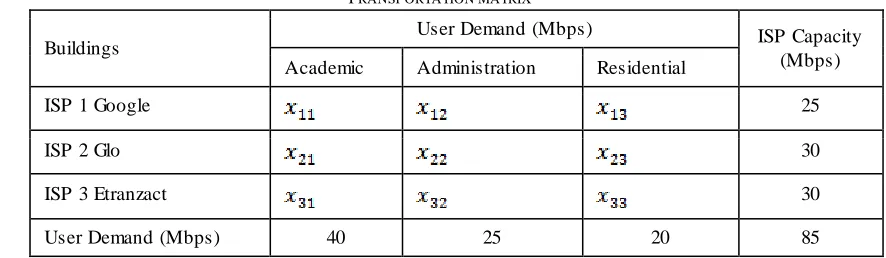
The transportation matrix is shown below:
TABLE I TRANSP ORTATION MATRIX Buildings
User Demand (Mbps) ISP Capacity
(Mbps) Academic Administration Residential
ISP 1 Google 25
ISP 2 Glo 30
ISP 3 Etranzact 30
User Demand (Mbps) 40 25 20 85
V. RESULT S AND ANALYSIS
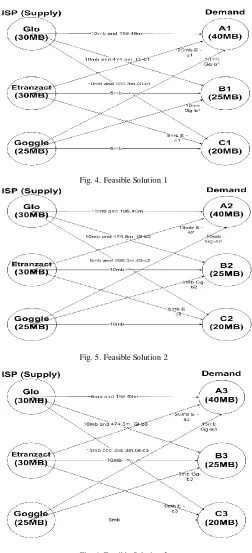
Note 1: ISP Globacom, Etranzact and Google are all in the
same point (Network Operating Center, CUNOC). That means they have the same distance to the demand points.
Note 2: Representations are: „E‟ represents Etranzact „Gl‟ represents Globacom „Gg‟ represents Google
Note 3: Distance from points obtained from Google Earth and some confirmed by physical measurement (Bolu, 2011).
Fig. 4. Feasible Solution 1
Fig. 5. Feasible Solution 2
Fig. 6. Feasible Solution 3
Solution
Minimise z = 2643900𝒳11 + 2643900𝒳12 + 2643900𝒳13 + 2128075𝒳21 + 2128075 𝒳22 + 2128075𝒳23 + 1671005𝒳31 + 1671005𝒳32 + 1671005𝒳33
Subject to:
3 1 1 3 2 1 3 3 1
40 Academic/Administrative Building
25 Non-Academic Building
20 Residential Building
j j j j j jx
x
x
And 3 1 1 3 2 1 3 3 130 Glo
30 Etranzact
25 Goggle, all
0
i i i i i ij ix
x
x
x
all
x
ij
0
1 1 1 0 0 0 0 0 0
0 0 0 1 1 1 0 0 0
0 0 0 0 0 0 1 1 1
11 12 13 21 22 23 31 32 33x
x
x
x
x
x
x
x
x
40
25
20
30
30
25
Using the MATLAB Linear Programming module, the following solution diagrammatically shown below was obtained.
Through linear programming we have optimized the cost. The resulting objective function is N184, 930,000.00k
VI. CONCLUSION
We have been to determine the bandwidth size to be supplied and the minimised cost of distribution using linear programming.
The final outcome of using a linear program in generating a model to solve the access network problem of connecting buildings across the University is one that can be deployed for use in other models. Though other forms of costs might arise during the process of construction and laying the cables, the final cost used is accurate and would be very close to the actual cost to be spent depending on the amount of miscellaneous expenses that arise during actual cable laying.
Also, though this model has been developed for a specific location, the steps followed can be useful as a guideline for modeling another Access Network for a different location having Network (communications) problems.
determine the cost of meeting the demand of the three main locations with a supply of 85 Mbps.
VII. RECOM M ENDATIONS
In line with all that has been done, there are still some improvements that can be made to the model and this can model can serve as a guideline for whatsoever would be done. Such additions and/or improvements could be:
Use of Integer or Dynamic Programming for a better bandwidth allocation and adequate Network Planning.
Expansion of this model to encompass other buildings being in Covenant University Network.
It should be noted that this model was
simplified by clustering the users. This should be un-clustered for future work.
ACKNOWLEDGEM ENT
The authors acknowledge the laboratory investigation contribution of the Innovation Centre, University of Nigeria, Nsukka and the Department of Mechanical Engineering, Covenant University, Ota for the provision of computing facilities for this work.
REFERENCES
[1] Ab-Rahman, M. S., (2011), T he Extension of OXADM Survivability Scheme to Fibre-to-the Home Wavelength Division Multiplexing (FT T H-WDM) Network. Journal of Applied Sciences Research, 8(6): 880-884
[2] Ab-Rahman, M. S., et al, (2009), Transmission surveillance and self-restoration against fibre fault for time division multiplexing using passive optical network by ISSN 1751-8628, 2nd April 2009. [3] Bailey, D., and Wright, E., (2003), Practical Fibre Optics - ISBN:
0750658002.
[4] Bolu, C. A, (2011), Modeling and Sim ulation in Mechanical Engineering in Principles of Mathemat ical Modeling, Lecture note (MCE 414), Covenant University, Ota, Ogun State. Nigeria. 2011, pp 3-7
[5] Bolu, C. A., (2011), Fibre Optics Network Optim isation as a Transportation Problem, [Lecture Note in Engineering Mathematics], Department of Mechanical Engineering Covenant University, Nigeria. [6] Gillett, B. E.,(1979), Introduction to Operations Research: A
Computer Oriented Algorithmic Approach, New Delhi: T ata McGraw-Hill Publishing Company LtdKrendzel, A. V., Access Network Planning: Minim isation of Construction Cost, Dept., of Network Planning, St. Petersburg Research Institute of T elecommunications (LONIIS) 11, Warshawskya Str.196128 [7] Kulkarni, S. and El-Sayed, M., (2010), FTTH-Based Broadband
Access Technologies: Key Param eters for Cost Optim ized Network Planning by. Bell Labs T echnical Journal 14(4), pp 297–310 Alcatel-Lucent, Wiley Inc.
[8] Morley, G.D, Grover, W.D, (1999), Com parison of Mathem atical Programming Approaches to Optical Ring Network Design T R Labs and University of Alberta, Dept., of Elect rical and Computer Engineering, Edmonton, T 6G2EI, Canada.
[9] Pfarrhofer, R.,et al, (2012), Distributed Optim ization of Fibre Optic Network Layout Using MATLAB, [email protected] – htt p://www.cti.ac.at/ accessed January 28, 2012
[10] Pirmez L., et al, (2010, September 15), Network Selection Based On Utility Function and Integer Linear Programming, Journal of Com puter Networks, Volume 54 (13), ISSN 1389-1286.