ISSN (e): 2250-3021, ISSN (p): 2278-8719
Vol. 09, Issue 1 (January. 2019), ||V (III) || PP 55-62
Model Development of Procurement Performance Measurement
on EPC Contractor by Using Bayesian Network Modelling
Bimbi Suharyanti
1, Suparno
21,2,3
Department of Industry Management, Sepuluh Nopember Institute of Technology, Surabaya, Indonesia Corresponding Author: Bimbi Suharyanti
Abstract:
In engineering, procurement, and construction (EPC) business process, procurement process is a process that greatly influences the success of getting projects and completing projects that have been acquired in addition to the engineering, construction and commissioning processes. To find out whether a procurement organization in EPC contractors has performed its function properly, a method of performance measurement is needed by establishing Key Performance Indicator and by performing performance measurements on predetermined indicators. The method used is Bayesian Network Modelling by selecting experts as respondents for the questionnaire, determining the Key Performance Indicator, collecting data and forming cycles and links between nodes so that the Bayesian Network Modelling construction is formed. The next step is calculating the probability of each node which can then form a performance measurement model, and a suitability test was done by using the chi-square test.The result of the model development was that the procurement performancemeasurement based on the Key Performance Indicator was good with a percentage of 52.06% with the largest influence of Tender Support node with a probability of 0.70 or having a percentage of 70% in influencing the procurement performancemeasurement. On the other hand, the relation to the external viewpoint influenced the procurement performancemeasurement was not good that was as much as 60.29%, with the greatest influence of nodes regarding the company’s web maximized for integrated procurement and accelerating the procurement process had a probability of 0.60 or has a percentage of 60% in influencing procurement performancemeasurement which was not good. The model suitability test by using the chi-square test can be concluded that Bayesian Network model on Key Performance Indicator corresponded to the significance level of 0.184 and Bayesian Network model on Key Result Indicator was in accordance with the significance level of 0.852.
Keywords:
EPC, Procurement, Key Performance Indicator, Key Result Indicator, Bayesian Network Modelling.--- --- Date of Submission: 13-01-2019 Date of acceptance: 29-01-2019 ---
---I.
INTRODUCTION
Engineering, Procurement and Construction (EPC) project is a process-based project with the scope of responsibility for Engineering, Procurement and Construction activities carried out by contractors. The contractors are responsible for completing the project in accordance with the technical and performance specifications set by the project owner (Hosen, 2007). In EPC business process, the procurement process is a process that greatly influences the success of getting a project and completing a project that has been obtained in addition to the process of engineering, construction and commissioning. To find out whether a Procurement organization in EPC Contractors has performed its function properly, a method of performance measurement is needed by establishing a Key Performance Indicator and performing measurements of performance on predetermined indicators. Currently, the EPC Procurement Department of PT. X already has a Key Performance Indicator, but the Key Performance Indicator that currently exists has undergone many changes and still has many weaknesses that the determination of Key Performance Indicator has not used a proven method or frame works, the Key Performance Indicator has not been able to categorize the staff procurement expertise level (scale), lack of measurable parameters as procurement performance indicators, and lack of an integrated approach to the procurement process.
proposed based on the BN model that is able to capture and integrate various Key Performance Indicators with four scenarios presented to show how the proposed BN model can be used further for analysis and decision making in organization.
In this study, the researcher presented how the Key Performance Indicator of Procurement division organization is planned, determined, and measured by using Bayesian Network (BN) Modeling. The performance measurement results were expected to be able to know the overall performance of the organization, which performance needed to be improved, produce recommendations and policies, and the Key Performance Indicator will be used as the official Key Performance Indicator of EPC Procurement Department of PT. X.
II.
METHODOLOGY
This research was conducted through four stages. The first stage was the preparation stage including the problem identification process, literature study, and problem formulation by determining the objectives of the research based on the background of the problem. The second stage was the stage of data collection including determining the type of research data, making observations of respondents, and distributing questionnaires. The third stage was the data analysis phase which consists of recapitulation of questionnaire data, model building, and model suitability test with chi-square test by using Minitab 17 software. For model development, it is done by forming a cycle and constructing Bayesian Network Modelling, calculating the probability of each node and conditional probability using Bayes theorem, and model formation by using Bayes Server software. The formula used in Bayes theorem is as follows:
𝑃 𝐴 𝐵 𝑃 𝐵 = 𝑃 𝐴, 𝐵 = 𝑃 𝐵 𝐴 𝑃 𝐴 (1)
Where 𝑃 𝐴, 𝐵 is Joint Probability Distribution (JPD) 𝐴, 𝑃 𝐴 𝐵 is the joint probability of events 𝐴 and 𝐵 or Conditional Probability 𝐴. By dividing both sides with 𝑃 𝐵 or Prior Probability 𝐵, the following formula can be obtained:
𝑃 𝐴 𝐵 =𝑃 𝐵 𝐴 𝑃 𝐴
𝑃 𝐵 (2)
In general, the Bayes theorem can be written as follows:
𝑃 𝐴𝑖 𝐵 = 𝑃 𝐵 𝐴𝑖 𝑃 𝐴𝑖 𝑃 𝐵 𝐴𝑖 𝑃 𝐴𝑖
(3)
The fourth stage was the stage of model interpretation of the model that has been formed and conclusion.
III.
RESULT
Formulation of Key Performance Indicator, Key Result Indicator,and Expert Identification
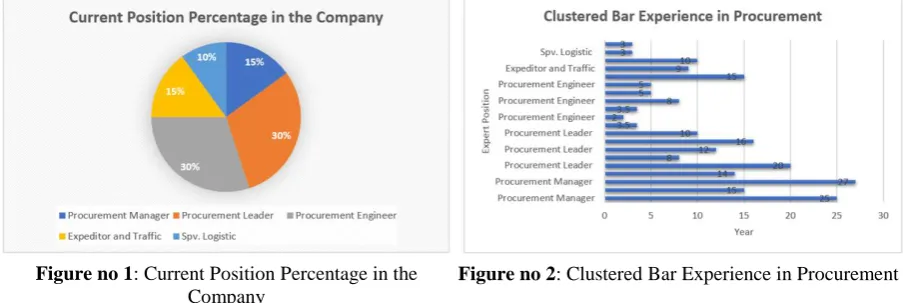
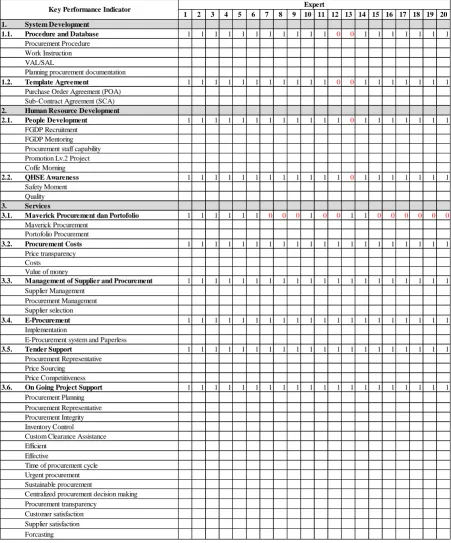
This study used questionnaires as the research instrument that were delivered directly to the respondents or, in this study, were called as experts. The indicators listed in the questionnaire consist of 10 indicators that form the Key Performance Indicator and 10 indicators related to the external point of view that forms the Key Result Indicator. The experts in this study were employees of the EPC Procurement Department of PT. X who had experience in EPC Procurement on Purchasing & Sub-Contracting (PSC) sub-division or Procurement Planning & Control (PPC) for at least 2 years and handled a project running and/or tenders. The number of experts in this study were 20 people. The identification of the experts was based on their current position in the company and their experience in procurement with the grouping of positions in the company at the time the research was conducted that can be seen through the pie chart and clustered bar as follows.
Data Analysis
The data collected was obtained from distributing questionnaires to the experts to combine knowledge from various expertise used in the elicitation process and developing a single level of confidence for certain BN
Figure no 1: Current Position Percentage in the Company
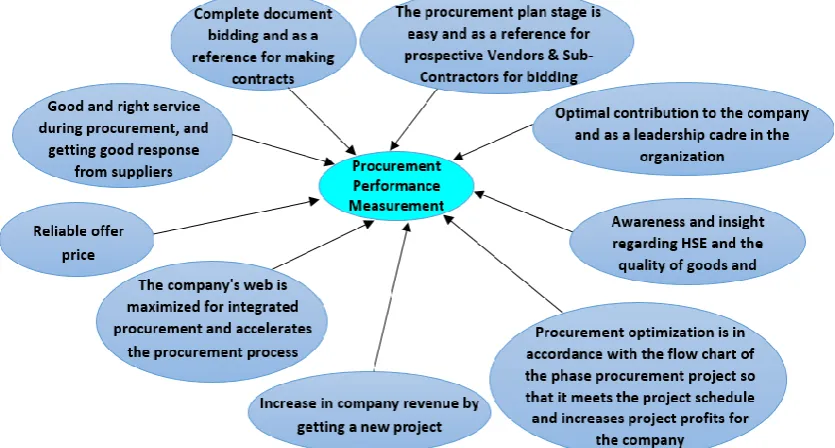
nodes. There were as many as 10 Key Performance Indicators which were used as data for determining Procurement performance measurements that included three major groups, namely system development, human resource development, and services. After the recapitulation of the indicators chosen by the experts, then the next selection of indicators with opportunities 0.5 or more was based on the contents of the questionnaires chosen to be considered as the measurement of Procurement performance.
Table no 1: Key Performance Indicator Score Summary Table selected by the Experts
Based on Table no 1, indicator 3.1. Maverick Procurement and Portfolio were eliminated and not included in the subsequent data processing because they did not match the opportunity criteria 0.5 or more based on the questionnaire result.
1 2 3 4 5 6 7 8 9 10 11 12 13 14 15 16 17 18 19 20
1. System Development
1.1. Procedure and Database 1 1 1 1 1 1 1 1 1 1 1 0 0 1 1 1 1 1 1 1
Procurement Procedure Work Instruction VAL/SAL
Planning procurement documentation
1.2. Template Agreement 1 1 1 1 1 1 1 1 1 1 1 0 0 1 1 1 1 1 1 1
Purchase Order Agreement (POA) Sub-Contract Agreement (SCA)
2. Human Resource Development
2.1. People Development 1 1 1 1 1 1 1 1 1 1 1 1 0 1 1 1 1 1 1 1
FGDP Recruitment FGDP Mentoring Procurement staff capability Promotion Lv.2 Project Coffe Morning
2.2. QHSE Awareness 1 1 1 1 1 1 1 1 1 1 1 1 0 1 1 1 1 1 1 1
Safety Moment Quality
3. Services
3.1. Maverick Procurement dan Portofolio 1 1 1 1 1 1 0 0 0 1 0 0 1 1 0 0 0 0 0 0
Maverick Procurement Portofolio Procurement
3.2. Procurement Costs 1 1 1 1 1 1 1 1 1 1 1 1 1 1 1 1 1 1 1 1
Price transparency Costs
Value of money
3.3. Management of Supplier and Procurement 1 1 1 1 1 1 1 1 1 1 1 1 1 1 1 1 1 1 1 1
Supplier Management Procurement Management Supplier selection
3.4. E-Procurement 1 1 1 1 1 1 1 1 1 1 1 1 1 1 1 1 1 1 1 1
Implementation
E-Procurement system and Paperless
3.5. Tender Support 1 1 1 1 1 1 1 1 1 1 1 1 1 1 1 1 1 1 1 1
Procurement Representative Price Sourcing
Price Competitiveness
3.6. On Going Project Support 1 1 1 1 1 1 1 1 1 1 1 1 1 1 1 1 1 1 1 1
Procurement Planning Procurement Representative Procurement Integrity Inventory Control Custom Clearance Assistance Efficient
Effective
Time of procurement cycle
Sustainable procurement
Centralized procurement decision making Procurement transparency
Customer satisfaction Supplier satisfaction Forcasting
Expert
Urgent procurement
The Establishment of Bayesian Network Modelling Cycle and Construction
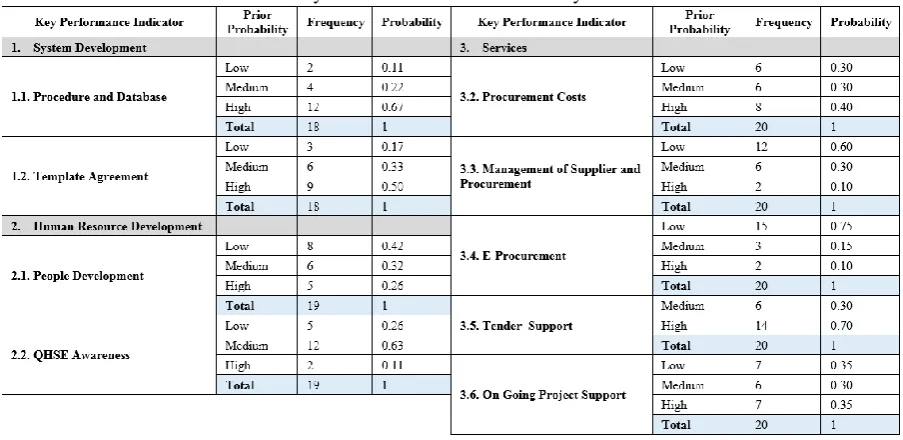
The relationship between nodes were formed based on the previous research or prior knowledge related to the indicators used as measurements of Procurement performance. All indicators that have been chosen by the experts and become final sets of Key Performance Indicators and final set of Key Result Indicators then became nodes that have correlations so that they can be said to be interconnected by ignoring the strength of the relationship between indicators.
Figure no 3:Acyclic Graph of Key Performance Indicator and Procurement Performance Measurement
Based on Figure no 3, Directed Acyclic Graph (DAG) was formed or can be called as an acyclic graph that can connect links between nodes. All these node pairs have been considered against the Procurement performancemeasurement. The pair of nodes that have formed a link can form a BN construction. Likewise with the indicators found in the Key Result Indicator, the node relationship found in the Key Result Indicator also formed a DAG that connected it to the Procurement performancemeasurement.
Figureno 4: Acyclic Graph of Key Result Indicator and Procurement Performance Measurement
Calculating the Probability of Each Node
Calculating the probability of each node was done to determine the probability of a joint occurrence for all possible values contained in a variable, including the probability of linking the prior probability results of the Key Performance Indicator and Key Result Indicator.
Table no 2: Probability Table for Each Node in the Key Performance Indicator
While the probability calculation table for each node on the Key Result Indicator, can be seen as follows: Table no 3: Calculation of Probability of Each Node on Key Result Indicator
Key Performance Indicator State of Key Result Indicator Key Result Indicator Frequency Probability
1. System Development
Low 3 0.17
Medium 6 0.33
High 9 0.50
Total 18 1
Low 2 0.12
Medium 8 0.44
High 8 0.44
Total 18 1
2. Human Resource Development
Low 6 0.31
Medium 10 0.53
High 3 0.16
Total 19 1
Low 4 0.21
Medium 13 0.68
High 2 0.11
Total 19 1
3. Services
Low 5 0.25
Medium 9 0.45
High 6 0.30
Total 20 1
Low 9 0.45
Medium 10 0.50
High 1 0.05
Total 20 1
Low 12 0.60
Medium 6 0.30
High 2 0.10
Total 20 1
Medium 12 0.60
High 8 0.40
Total 20 1
Low 3 0.15
Medium 10 0.50
High 7 0.35
Total 20 1
3.3. Management of Supplier and Procurement
3.4. E-Procurement
3.5. Tender Support
3.6. On Going Project Support 1.1. Procedure and Database
1.2. Template Agreement
2.1. People Development
2.2. QHSE Awareness
3.2. Procurement Costs
Good and right service during procurement, and getting good response from suppliers.
The company's web is maximized for integrated procurement and accelerates the procurement process.
Increase in company revenue by getting a new project.
Procurement optimization is in accordance with the flow chart of the phase procurement project so that it meets the project schedule and increases project profits for the company. The procurement plan stage is easy and as a reference for prospective Vendors & Sub-Contractors for bidding.
Complete document bidding and as a reference for making contracts.
Optimal contribution to the company and as a leadership cadre in the organization.
Awareness and insight regarding HSE and the quality of goods and services.
Table no 4: Conditional Probability Template Agreement
Table no 5: Conditional Probability People Development
Company
Next is calculating Conditional Probability for each node that was affected by other nodes, including Template Agreement affected by Procedure and Database as system development, People Development was affected by QHSE Awareness as human resource development, and On Going Project Support was affected by Tender Support as services in procurement performance measurement.
Key Performance Indicator
Freq. Probability
Key Performance Indicator
Freq. Probability Procedure
and Database
Template Agreement
QHSE Awareness
People Development
Low Low 0 0 Low Low 1 0.20
Low Medium 2 1 Low Medium 2 0.40
Low High 0 0 Low High 2 0.40
Medium Low 0 0 Medium Low 6 0.50
Medium Medium 3 0.75 Medium Medium 4 0.33
Medium High 1 0.25 Medium High 2 0.17
High Low 3 0.25 High Low 1 0.50
High Medium 1 0.08 High Medium 0 0
High High 8 0.67 High High 1 0.50
Table no 6: Conditional Probability on Going Project Support Key Performance Indicator
Freq. Probability Tender
Support
On Going Project Support
Medium Low 1 0.17
Medium Medium 2 0.33
Medium High 3 0.50
High Low 6 0.42
High Medium 4 0.29
High High 4 0.29
Model Formation
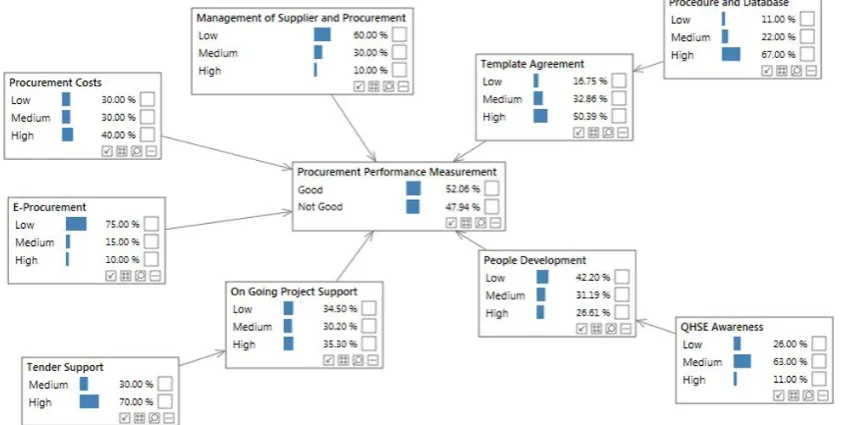
After calculating the probability, the calculation results were then included into the Procurement Performance Measurement Model, so that the probability of the occurrence of Procurement Performance Measurement was obtained based on the influence of the Key Performance Indicator shown in the figure below.
Based on the above model, 20 experts said that the procurement performance measurement obtained was good with the performance measurement result of 52.06% based on the questionnaire survey or around 11 experts who stated that the procurement performance measurement was good, while 47.94% of the procurement performance measurement was not good which means that around 9 experts stated that it was not good at procurement performance measurement.
Based on the model formed in Figure no 5, it can be seen that the measurement of procurement performance at this time has been good with a percentage of 52.06%, affected by several indicators on the Key Performance Indicator, including:
1. Procedure and Database 2. Template Agreement 3. On Going Project Support 4. Tender Support
5. Procurement Costs
The measurement of procurement performance is good, but there are still things that need to be corrected with indicators that have a high percentage of parameters that are quite high, which means that the indicator that causes the measurement of procurement performance is not good. The parameter percentage is not good for measuring procurement performance by 47.94%. Even though the percentage is below 50%, it is still quite high, therefore an evaluation and improvement must be made on the Key Performance Indicator indicators. The percentage of 47.94% is influenced by several indicators on the Key Performance Indicator, including: 1. People Development
2. QHSE Awareness 3. E-Procurement
4. Management of Supplier and Procurement
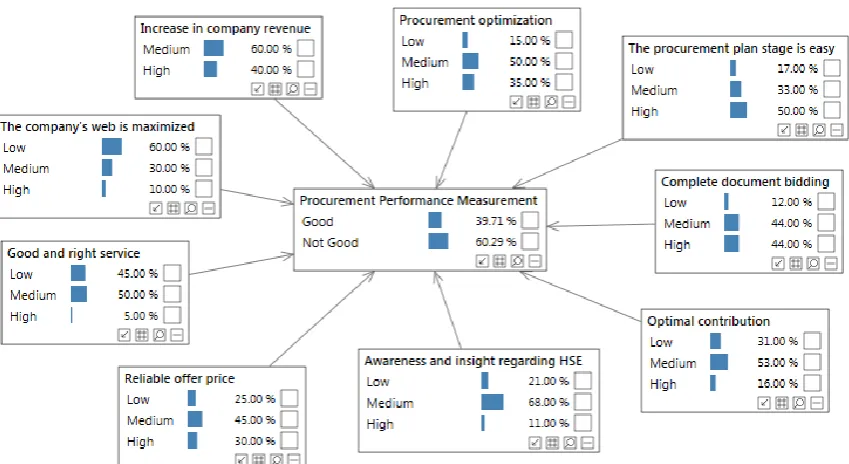
Figure no 6: Bayesian Network Model Testing on Procurement Performance Measurement based on the Effect of Key Result Indicator
According to the above model, 20 experts said that the procurement performance measurement from an external point of view was good with the result of 39.71% obtained from the questionnaire survey or 8 experts stated that the procurement performance measurement from external perspective was good, while the procurement performance measurement from external point of view in Procurement performance with the results of unfavorable performance measurement of 60.29% means that around 12 experts stated that it was not good at measuring procurement performance from an external perspective.
The model formed on the Key Result Indicator in Figure no. 6, results that the procurement performance measurement from an external viewpoint is currently not good with a percentage of 60.29% affected by several indicators on the Key Result Indicator, including:
1. The company's web is maximized for integrated procurement and accelerates the procurement process 2. Increase in company revenue by getting a new project
International organization of Scientific Research
62 | Page
4. Reliable offer price
5. Awareness and insight regarding HSE and the quality of goods and services 6. Optimal contribution to the company and as a leadership cadre in the organization
7. Procurement optimization is in accordance with the flow chart of the procurement phase project
While the model formed on the Key Result Indicator in Figure no. 6 for measuring procurement performance with good results has a percentage of 39.71% and is influenced by several indicators on the Key Result Indicator, including:
1. The procurement plan stage is easy and as a reference for prospective Vendors & Sub-Contractors for auction
2. Complete document bidding and as a reference for making contracts
Model Suitability Test
The result of Bayesian Network model test on measuring Procurement performance based on the influence of Key Performance Indicators based on Minitab software output 17 produced a significance level of 0.184 greater or equal to 0.05 (p-value≥0.05). Likewise with the results of testing Bayesian Network model on measuring Procurement performance based on the effect of the Key Result Indicator based on Minitab software output 17 resulted a significance level of 0.852 greater or equal to 0.05 (p-value ≥0.05). The test results of the two models indicated that H0 was accepted, it can be concluded that Bayesian Network model on Key Performance Indicator was appropriate, as well as Bayesian Network model on the corresponding Key Result Indicator.
V.
CONCLUSION
The indicators contained in Key Performance Indicator influenced the measurement of procurement performance, the result was good that the percentage was 52.06% with the contribution of 5 nodes which can affect good results and 4 nodes that affect the other way. Whereas the indicators contained in Key Result Indicator to see the relevance of the external point of view had an effect on the measurement of procurement performance which resulted not good, as much as 60.29%, with the contribution of 7 nodes which can affect bad results and 2 nodes which affect good results.
The nodes that produced the greatest probability that influenced the measurement of procurement performance which result were good based on the indicators contained in the Key Performance Indicator was the Tender Support node with a percentage of 70%. While the nodes that produce the greatest probability that influenced the measurement of procurement performance was not good based on the indicators found in the Key Result Indicator were the company’s web for integrated procurement and speeding up the procurement process with a percentage of 60%.
Procurement Division of PT. X can focus more on performance from an external perspective for improvement, and can indicate whether the direction of the procurement organization's performance is appropriate. In addition, indicators that influence the measurement of procurement performance whose results are not good, including indicators that have a large percentage of low and medium parameters can be immediately evaluated and corrected, and taken into consideration for improving the performance of the procurement organization.
REFERENCES
[1]. Abolbashari, M. H., Chang, E., Hussain, O. K., & Saberi, M. (2017). Smart Buyer: A Bayesian Network Modelling Approach for Measuring and Improving Procurement Performance in Organisations. Knowledge-Based Systems, 142, 127–148.
[2]. Hosen, R. Z. (2007). Presentasi EPC Project Overview.
[3]. Parmenter, D. (2007). Key Performance Indicator, PT Elex Media Komputindo, Jakarta.
[4]. PMI. (2013). A Guide to the Project Management Body of Knowledge. Project Management Institute (Vol. 5).
[5]. Reh, F. J. (2007). Key Performance Indicators. Retrieved from
http://management.about.com/cs/generalmanagement/a/keyperfindic.htm
[6]. Rizki, N. A., & Wahyuningsih, S. (2012). Model Multinomial Bayesian Network pada Data Simulasi Curah Hujan, 12(2), 61–75.
[7]. Wibowo. (2008). Manajemen Kinerja, Jakarta. Rajagrafindo Persada.
[8]. Yahdin, S., Syamsuriadi, & Rinni, Y. E. (2008). Aplikasi pengambilan keputusan pada perencanaan produksi berdasarkan teorema bayes, 6 (1), 25–38.