ISSN (Online) 2347-3207
A Comparative Study of Classification Methods in Data Mining
using RapidMiner Studio
Vishnu Kumar GoyalDept. of Computer Engineering
Govt. R.C. Khaitan Polytechnic College, Jaipur, India [email protected]
Abstract—Data mining is the knowledge discovery process which analyses the large volumes of data from various aspects and summarizing it into useful information; data mining has become an essential and important component in various fields of daily life. It is used to identify hidden patterns in a large data set. Classification is an important data mining technique with broad applications to classify the various kinds of data used in nearly every field of human life. In this paper we have worked with different data mining applications and various classification algorithms, these algorithms have been applied on different dataset to find out the efficiency of the algorithm This paper analyze the five major classification algorithms: k-nearest neighborhood (KNN), Naive Bayes (NB), Decision Tree (DT), Decision Stump (DS) and Rule Induction (RI) and compare the performance of these major algorithms. The results are tested on five datasets namely Weighting, Golf, Iris, Deals and Labor using Rapid Miner Studio.
Index Terms—Data Mining, Classification, Rapid Miner.
I. INTRODUCTION
Classification is a classic machine learning data mining technique. Basically classification is used to classify each item in a set of data into one of predefined set of classes or groups [2]. The Classification methods use mathematical techniques such as decision trees, linear programming, neural network and statistics. In classification, we develop the software that can learn how to classify the data items into groups [3]. For example, we can apply classification in application that “given all records ofstudents who left the college; predict who will probably leave the collegein a future period.” In this case, we divide the records ofstudents
into two groups that named “leave” and “stay”. And then we can ask our data mining software to classify the students into separate groups.
II. METHODOLOGY
In this paper the RapidMiner Studio 6[8] was used to perform experiments by taking the past project data from the repositories. Five well known and important classification algorithms k-nearest neighborhood (KNN), Naive Bayes (NB), Decision Tree(DT), Decision Stump(DS) and Rule Induction(RI) were applied on the Weighting, Golf, Iris, Deals and Labor datasets and the outputs were tabulated and plotted in a 2 dimensional graph. Then one by one these datasets are evaluated and their accuracy was evaluated. Amount of correctly classified instances and incorrectly classified instances have been recorded. Each algorithm is run over five predefined datasets and their performance in terms of accuracy was evaluated.
III. THERAPIDMINERTOOL
For a successful classification implementation, RapidMiner Studio 6 was used to perform experiments. RapidMiner is one of the world’s most widespread and most used open source data mining solutions [8]. The project was born at the University of Dortmund in 2001 and has been developed further by Rapid-I GmbH since 2007. With this academic background, RapidMiner continues to not only address business clients, but also universities and researchers from the most diverse disciplines.
ISSN (Online) 2347-3207 RapidMiner has a comfortable user interface (Fig.1), where analyses are configured in a process view. RapidMiner uses a modular concept for this, where each step of an analysis (e.g. a pre-processing step or a learning procedure) is illustrated by an operator in the analysis process. These operators have input and output ports via which they can communicate with the other operators in order to receive input data or pass the hanged data and generated models over to the operators that follow.
Fig.2. A RapidMiner process with of operators for model production
Thus a data flow is created through the entire analysis process, as shown in fig. 2.
The most complex analysis situations and needs can be handled by so-called super-operators, which in turn can contain a complete sub process. A well-known example is the cross-validation, which contains two sub processes. A sub process is responsible for producing a model from the respective training data while the second sub process is given this model and any other generated results in order to apply these to the test data and measure the quality of the model in each case. A typical application is shown in fig. 3.
Fig. 3. The internal sub processes of a cross-validation
IV. DATASET
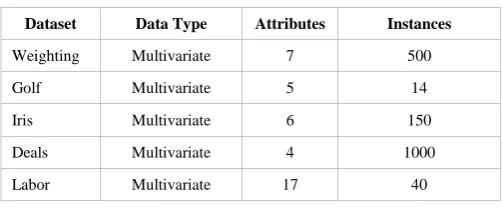
For performing the comparison analysis we need the past project datasets. A number of data sets were selected for running the test. For bias issues, some data sets have been downloaded from the UCI repository [6] and some were taken from RapidMiner Studio. Table I shows the selected and downloaded data sets for testing purposes. As shown in the table, each dataset is described by the data type being used, the number of instances stored within the data set, the number of attributes that describe each dataset.
These data sets were chosen because they have different characteristics and have addressed different areas. These datasets have been taken from RapidMiner Studio and UCI machine learning repository system.
TABLE I. DATASETS DESCRIPTION
Dataset Data Type Attributes Instances
Weighting Multivariate 7 500
Golf Multivariate 5 14
Iris Multivariate 6 150
Deals Multivariate 4 1000
Labor Multivariate 17 40
V. EXPERIMENTAL STUDY AND RESULTS
ISSN (Online) 2347-3207 TABLE II. PERFORMANCE OF KNN ALGORITHM
Datasets
Correctly Classified Instances
Incorrectly Classified Instances
Accuracy
Weighting 444 56 88.80
Golf 6 8 42.86
Iris 144 6 96.00
Deals 973 27 97.30
Labor 34 6 85.00
Fig. 4. KNN Algorithm: Percentage Accuracy
The KNN algorithms performed well for Iris and Deals dataset. It is also performed well for weighting and Labor datasets, but for the Golf dataset, the accuracy is low.
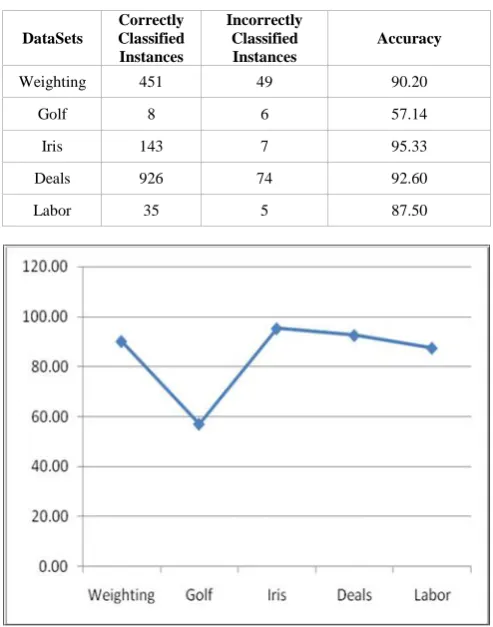
TABLE III. PERFORMANCE OF NAIVE BAYES ALGORITHM
DataSets
Correctly Classified Instances
Incorrectly Classified Instances
Accuracy
Weighting 451 49 90.20
Golf 8 6 57.14
Iris 143 7 95.33
Deals 926 74 92.60
Labor 35 5 87.50
ISSN (Online) 2347-3207 As shown in the Fig. 5 the Naive Bayes algorithm perform well for Weighting, Iris, Deals, and Labor dataset. The accuracy is slightly low Golf dataset.
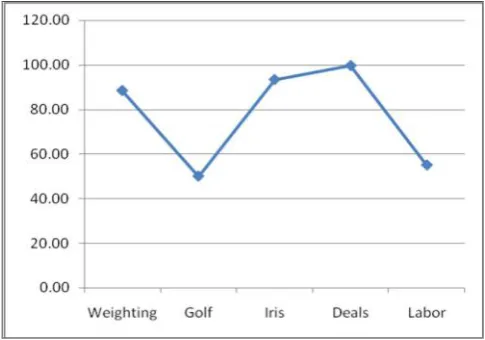
TABLE IV. PERFORMANCE OF DECISION TREE ALGORITHM
DataSets
Correctly Classified Instances
Incorrectly Classified Instances
Accuracy
Weighting 442 58 88.40
Golf 7 7 50.00
Iris 140 10 93.33
Deals 996 4 99.60
Labor 22 18 55.00
As shown in the Fig. 6 the Decision Tree algorithm performed well for weighting, Iris and Deals dataset, but for the Golf and Labor datasets, the accuracy is low.
As shown in the Fig. 7 the Decision Stump algorithm the accuracy is good for weighting and Deals, average for Golf, Iris and Labor datasets.
Fig. 6. Decision Tree Algorithm: Percentage Accuracy
TABLE V. PERFORMANCE OF DECISION STUMP ALGORITHM
DataSets
Correctly Classified Instances
Incorrectly Classified Instances
Accuracy
Weighting 407 93 81.40
Golf 9 5 64.29
Iris 100 50 66.67
Deals 732 268 73.20
ISSN (Online) 2347-3207
Fig. 7. Decision Stump Algorithm: Percentage Accuracy
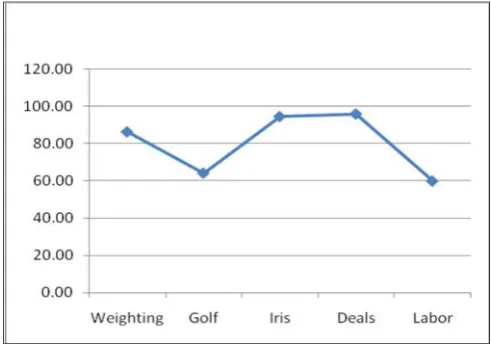
TABLE VI. PERFORMANCE OF RULE INDUCTION ALGORITHM
DataSets
Correctly Classified Instances
Incorrectly Classified Instances
Accuracy
Weighting 432 68 86.40
Golf 9 5 64.29
Iris 142 8 94.67
Deals 960 40 96.00
Labor 24 16 60.00
As shown in the Fig. 8 the Rule Induction algorithm performed well for Iris and deals dataset, average for Golf, and Labor datasets.
Fig. 8. Rule Induction Algorithm: Percentage Accuracy
VI. COMPARISON
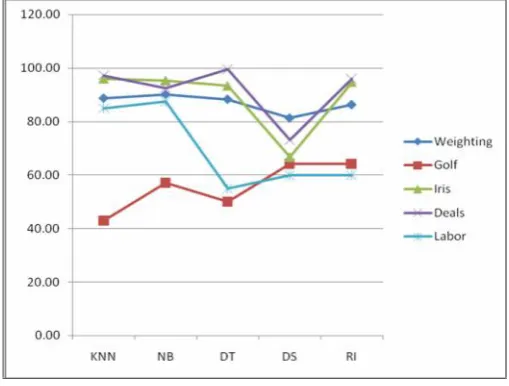
The k-nearest neighborhood (KNN), Naive Bayes (NB), Decision Tree (DT), Decision Stump (DS) and Rule Induction (RI) classification techniques were used on the Weighting, Golf, Iris, Deals and Labor datasets using Rapid Miner Studio and the Consolidated outputs are tabulated (Table VII) and plotted in a 2 dimensional graph as shown in fig. 9.
TABLE VII. PERFORMANCE COMPARISON
Dataset KNN NB DT DS RI
Weighting 88.80 90.20 88.40 81.40 86.40
Golf 42.86 57.14 50.00 64.29 64.29
Iris 96.00 95.33 93.33 66.67 94.67
Deals 97.30 92.60 99.60 73.20 96.00
ISSN (Online) 2347-3207
VII. CONCLUSION
For Weighting dataset, the all the algorithms performed well. For Golf dataset, Naive Bayes, Decision Stump and Rule Induction performed average, but for the KNN and Decision Tree the accuracy is low. For Iris KNN, Naive Bayes, Decision Tree and Rule Induction performed well, and Decision Stump performed average. For Deals dataset KNN, Naive Bayes, Decision Tree and Rule Induction performed well, and Decision Stump performed average. For Labor dataset KNN and Naive Bayes performed good and Decision Tree, Decision Stump and Rule Induction performed average. For the given datasets, Decision Stump algorithm is performing worst and Naive Bayes is performing average. The Decision Tree shows some improvement over these two.
Fig. 9. Classification Algorithms: Percentage Accuracy
The KNN and Rule Induction are performing well among the all algorithms, but the KNN can be considered as the best among these algorithms for these datasets.
REFERENCES
[1] MacQueen J. B., "Some Methods for classification and Analysis of Multivariate Observations", Proceedings of 5thBerkeley Symposium on Mathematical Statistics and Probability.University of California Press. 1967, pp. 281–297.
[2] Jiawei Han and Micheline Kamber, “Data Mining: Concepts and Techniques”, Morgan KaufmannPublishers,second Edition, (2006). [3] Margaret H. Danham,S. Sridhar,”Data mining, Introductory and Advanced Topics”, Person education , 1st ed., 2006.
[4] Anshul Goyal, Rajni Mehta,“Performance Comparison of Naive Bayes and J48 Classification Algorithms”, IJAER, Vol. 7, No. 11, 2012.
[5] Milan Kumari, Sunila Godara, “Comparative Study of Data Mining Classification Methods in cardiovascular Disease Prediction”, IJCST, Vol. 2, Issue 2, 2011, pp. 304-308.
[6] UCI Machine Learning Repository Irvine, CA: University of California, School of Information and Computer Science. http://www.ics.uci.edu/~mlearn/MLRepository.html.
[7] Surjeet Kumar Yadav and Saurabh Pal:” Data Mining: A Prediction for Performance Improvement of Engineering Students using Classification”World of Computer Science and Information Technology Journal(WCSIT) Vol. 2, No. 2, 2012.
[8] RapidMiner is an open source-learning environment for data mining and machine learning. https://rapidminer.com
[9] Sanjay D. Sawaitul, Prof. K. P. Wagh, Dr. P. N. Chatur,” Classification and Prediction of Future Weather by using Back Propagation Algorithm-An Approach”,International Journal of Emerging Technology and Advanced Engineering Website: www.ijetae.com (ISSN 2250-2459, Volume 2, Issue 1, 2012)