e-ISSN: 2278-067X, p-ISSN: 2278-800X, www.ijerd.com
Volume 14, Issue 3 (March Ver. II 2018), PP.22-28
Basicstudy on Effects of Dimensions on Heat Transfer
Enhancement around Heating Components by Pulsating Airflow
Jun Suzuki
1, Nobuaki Suzuki
2, Koichi Hirose
3,Takashi Fukue
3,
1
Department of Mechanical Engineering, Civil and Environmental Engineering, Iwate University, Iwate 020-8551, Japan
2Department of Mechanical Engineering,Graduate School of Iwate University, Iwate 020-8551, Japan 3Department of Systems Innovation Engineering, Iwate University, Iwate 020-8551, Japan 4Department of Mechanical Systems Engineering, National Institute of Technology, Toyama College,
Toyama 939-8630, Japan Corresponding Author: Jun Suzuki
Abstract: This study describes a possibility of a development of the heat transfer enhancement technique on heating components such as electrical devices mounted in electronic enclosure by applying the pulsating airflow through 3D-CFD (Computational Fluid Dynamics) analysis. We especially investigated the effects of the dimensions of the heating prism mounted in the enclosure on the heat transfer performance of the pulsating airflow. It was found that the level of the heat transfer enhancement was dependent on the dimensions of the heating object. Information about doing the optimization of the condition of the flow pulsation for increasing the level of the heat transfer enhancement by the pulsating airflow.
Keywords: Rectangular Duct, Heat Transfer Enhancement, Heating Component, Pulsating airflow, Thermal Equipment, Thermal Design
--- --- Date of Submission: 12 -03-2018 Date of acceptance: 27-03 2018 --- ---
I.
INTRODUCTIONIn thermalequipment such as heat exchangers, air conditioning systems electronic equipment andthe like, it is an important task to achieve both improvement of heat exchange performance and reduction of energy used for operating fluid machineries such as fans and pumps. For example, in recent data center equipment, about 40% of the power consumption is currently being used for heat dissipation [1]. In general, heat transfer performance of forced convection can be improved by increasing the flow rate of the fluid by increasing the rotational speed of the fans or the pumps. However of course the power consumption also increases. Development of an innovative heat transfer system to break down this trade-off is strongly needed.
The authors came up with an application of the pulsating flow to the thermal problem from pulsation phenomena widely seen in living things and nature, such as blood flow of living beings. Compared with the case where conventional steady flow is applied, cases in which heat transfer is promoted much when pulsating flow is supplied on a flat plate mounted in the rectangular duct have been reported [2]. Therefore, we considered whether or not both reduction of power consumption and improvement of heat exchange performance in the thermal equipment can be compatible by the application of pulsating flow.In our previous research, we have reported that the heat transfer performance on the cylindrical or the square prism obstructions have been increased by the pulsating flow regardless of the shape of the obstruction while decreasing the time-averaged supply flow rate [3] [4]. However, the dimensions of the cooling targets such as fins, ribs and electrical componentsmounted in each thermal equipment are generally dependent on the design of the equipment. Therefore, it is necessary to grasp a relationship between the dimension of the cooling targets and the change of both the heat transfer characteristics and the flow pattern aroundthe cooling targets by the pulsating flow. However, an experimental investigation of the pulsating flow with high accuracy becomes difficult. As an preliminary investigation of the pulsating flow, an investigation of flow and heat transfer of the pulsating flow using a 3D-CFD (Computational Fluid Dynamics) is effective in order to observe the qualitatively characteristics.
passage of a rectangular cross section simulating enclosure of a thermal equipment. The working fluid was air. Air flows in from the upstream side of the flow passage and flows out to the downstream via the installed component. The height of the component was set to be the same as the height of the flow passage and heat dissipates from the surface of the component under the constant heat flux condition. The superiority of the pulsating flow was evaluated by comparing the cooling performance of the component.
(a) Whole schematic (b) Definition of dimensions Fig.1 Schematic of test enclosure with square prism.
III.
NUMERICAL ANALYSIS METHODUnsteady thermal fluid analysis was performed usingOpenFOAM ver 2.3.1, which is an open-source CFD toolbox, as an analytical code. The governing equations are the following continuous equation, Navier-Stokes equation, Energy equation, which was analysed without considering the buoyancy effect.
U
0 (1)
1 2U
UU p U
t
(2)
2T
T U T
t
(3)
The pulsation phenomenon and the generated heat transfer phenomenon were analysed for 20 seconds from the application of pulsating flow and the start of heating. As a boundary condition of the flow, velocity boundary conditions are given to the inlet of the channel, and pulsating flow is expressed by changing the flow velocity at each time. At the exit we adopted the Sommerfeldradiation condition which allows free flow. The surfaces of the casing and the component were subjected to no-slip conditions. Next, as a boundary condition of heat, the constantheat flux boundary condition was given to the surface of the heat generating member. Also, the temperature of the incoming air was fixed at 25 deg. C.
IV.
DIMENSION CONDITION OF FLOW PASSAGE AND HEATING COMPONENTTable 1 shows the conditions of the dimensions verified in this paper. The definition of the parameters is shown in Fig. 1. The standard flow passage was a rectangular duct with a width of 80 mm and a height of 40 mm. The dimensions of the rectangular duct in the case of thermal equipment were determined with reference to the commercial power supply and the like [6] [7]. A heating component with a square cross section with half the width, 40 mm, as one side length was installed in this duct. Therefore, lo as shown in Fig. 1 is the same as bo.
In order to verify the heat transfer promoting effect of the pulsating flow when the scale is smaller than the dimension of the flow channel and the reference size, an analysis model in which each dimension is reduced to about 1/2 times and 1/4 times was prepared. Hereafter, the reference model is referred to as "Base Model", the 1/2 times model as "1/2 Scale Model", and the 1/4 times model as "1/4 Scale Model". In addition, only the size of the component of the 1/4 model is prepared as 1/3. The total length of each model was assumed to be the same. The total mesh number of each model is also shown in Table 1.
Air Flow
Test section Heating Components
x y z
Air Flow
bd
ld
lo
65
hd
Air Flow Air Flow
V.
FLOW RATE AND PULSATION CONDITIONTable 2 shows the conditions of the time averaged flow rate introduced into the test section.The time-averaged Reynolds number was defined as the following formula.
(4)
The hydraulic diameter of the flow passage and the time-averaged bulk mean velocity at the inlet of the duct was set as characteristic length and characteristic velocity. The Reynolds number wasset 250, 500, 1000, 1500.Figure2 shows the flow waveform of the pulsating flow used in this paper.In the paper, a trapezoidal wave close to a rectangular wave was adopted as the pulsation waveform.The frequency of pulsation was 1 Hz. This is intended to rapidly change the flow around the heating component by rapidly decreasing the speed to the deceleration cycle. Considering the stability of calculation, it is assumed that the acceleration start from 0 sec to 0.05 sec is the acceleration period, 0.05 sec to 0.5 sec is the holding time at the maximum flow rate, the above is referred to as acceleration period, From 0.5 sec to 0.55 sec is the deceleration period, From 0.55sec to 1.0 secis the holding time at the zero flow rate, the above is referred to as the deceleration period, is defined as a period from 0 sec to 1.00 sec.The maximum flow rate Vmax was determined so that the time average flow rate was equal
to the steady flow of the same Reynolds number.
Table 2 Condition of time-averaged supply flow rate in test section.
Time-averaged Reynolds number : Red [-] 250,500,1000,1500
Time-averaged flow rete [×10-5 m3/s]
Base Model 1/2Scale Model 1/4Scale Model
15.0~121 7.6~60.6 3.78~30.4
Fig. 2 Time variation of flow rate of pulsating flow in this report. Fig. 3 Positon of temperature evaluation point.
VI.
EVALUATION METHOD OF HEAT TRANSFER PERFORMANCEThe following local Nusselt number Nuibased on cut off time averaged for 5 sec after the flow was
stabilized, analysis start from 15 sec to 20 sec, and evaluated with the average Nusselt number Num. First, Nui
was calculated from the dimensionless temperature gradient in the normal direction at the temperature evaluation point, total of 8 points from N1 to N8, on the surface of the heat generating component shown in Fig.
3. Then we calculatedNum by averaging Nui.
n
T
Nu
i (5)in
o in
T
T
T
T
T
VII.
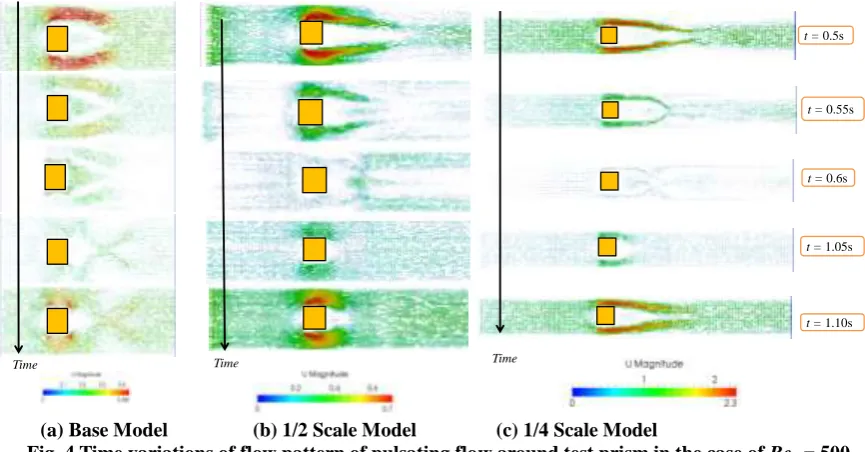
RESULTSANDDISCUSSIONFirst, we check changes in flow around parts generated by the induction of pulsation. Fig. 4 shows the velocity vector distribution obtained at Red = 500 in each model. Here, for t = 0.55 sec to 0.6 sec, the
deceleration process during pulsation, t = 1.05 sec to 1.10 sec shows the change in acceleration process during pulsation. Just before deceleration at t = 0.5 s, a separation area is formed behind and on the side of the part under any condition. It is found that entrainment due to back flow from the main flow occurs in this separation area in the deceleration process. This is because the static pressure of the mainstream air increases due to the restoration of the static pressure during deceleration with respect to the air in the detachment zone under negative pressure, so that a flow is formed from the main flow area to the separation area. As a result, heat transfer performance is usually extremely low in the separation area, heat transfer promotion is performed on the downstream side of the parts, so the cooling performance of the whole parts can also be improved [3] [4]. However, what I want to focus on here is that the level of backflow velocity seen at t = 0.6 sec differs from the maximum flow velocity, clearance between parts and flow wall, of each scale model. The base model shows the strongest backflow, whereas in other models the backflow velocity decreases as the scale decreases. It is thought that the inertial force of the flow is dominant due to the increase of the flow velocity of the clearance, and the force pulled in by the negative pressure behind the part is losing.
Next, confirm the actual heat transfer performance. Fig. 5 shows the relationship between Num and Red,
and Fig. 6 shows the increase rate of Num for the pulsatile flow with respect to the steady flow Num. In both Base
Model and 1/2 Model, the heat transfer performance of the pulsating flow tends to be the same as the steady flow or higher than the steady flow regardless of Red. Especially the increase rate between Red = 500 and 1500
was remarkable. On the other hand, as a result of the 1/4 model, superiority of pulsating flow heat transfer performance was not seen.
(a) Base Model (b) 1/2 Scale Model (c) 1/4 Scale Model
Fig. 4 Time variations of flow pattern of pulsating flow around test prism in the case of Red = 500.
Time Time
t = 0.5s
t = 0.55s
t = 0.6s
t = 1.05s
t = 1.10s
Fig. 5 Relationship between Num and Red. Fig. 6 Comparison of average Nusselt number
between pulsating flow and steady flow.
(a) Base Model (b) 1/4Scale Model
(c)Evaluation point of air temperature
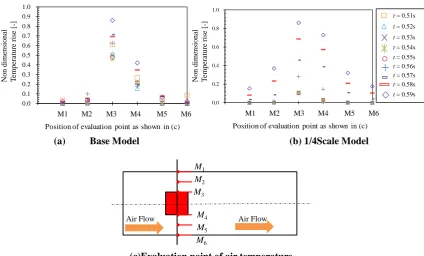
Fig. 7 Relationship between temperature rise and time in the case of Red = 1500.
Regarding the condition where the superiority of the heat transfer characteristic due to the pulsating flow was not observed, in the flow with the low Reynolds number, the influence of the viscosity in the flow is strong and a flow along the part is formed, so induction of the flow due to the pulsation It is considered that there is a possibility that the flow is formed to some extent behind the part even though it is not necessary. On the other hand, for the flow with high Reynolds number and the 1/4 Scale Model, the effect of involving the reverse flow does not work sufficiently due to the increase in the dominance of the inertia force as described above, so the heat transfer performance did not appear remarkably. Also, for models with a small scale like the 1/4 Model, the heat conduction at the deceleration period is also considered to be affected. Fig. 7 shows the temperature rise of the air that could be confirmed in the flow path at the deceleration period of from 0.51 sec to 0.60 sec. The positions of the evaluation points, from M1 to M6, are as shown in Fig. 7 (c). M2 and M5are the
center of the flow path are normalized by the maximum temperature of the part surface observed at the end of the deceleration period, respectively. From this result, it can be seen that by reducing the size, the heat conduction in the flow path progresses faster in the 1/4 Scale Model than in the base model. This is believed to
Position Position No n dim ensional T em per at ure ri se [-] Non dim ensi onal T em per at ure ri se
[-] t = 0.51s
t = 0.52s t = 0.53s t = 0.54s t = 0.55s t = 0.56s t = 0.57s t = 0.58s t = 0.59s 0.0 0.1 0.2 0.3 0.4 0.5 0.6 0.7 0.8 0.9 1.0
0 1 2 3 4 5 6
0.0 0.2 0.4 0.6 0.8 1.0
0 1 2 3 4 5 6
M1 M2 M3 M4 M5 M6
Position of evaluation point as shown in (c)
M1 M2 M3 M4 M5 M6
Position of evaluation point as shown in (c)
Air Flow Air Flow
were obtained.
In base model and 1/2 scale model, clear heat transfer promotion effect due to pulsation could be confirmed. Especially in the base model in the range of 500 <Red<1500, heat transfer promotion effect of 50%
or more was obtained. This is due to the backflow from the main stream flowing into the negative pressure area behind the part and the side part generated in the deceleration period at the time of pulsating flow induction. Although it is necessary to ensure reliability by experiments, it is expected that both heat transfer acceleration and reduction in time average flow rate are expected to be compatible.
On the other hand, even in the 1/4 model or the above model, the heat transfer promoting effect of pulsating flow could not be obtained depending on the conditions. This is thought to be due to the fact that the flow inductive effect to the negative pressure area around the part is reduced due to the inertial force of the flow being too large or too small. In addition, in the 1/4 model, it is also considered to be due to the small size and the inhibition of heat conduction caused by the small heat capacity of air.
NOMENCLATURE
Ad : cross section area of duct, m2
bd : width of duct, m
bo : width of obstruction, m
dd : hydraulicdiameter of duct cross section, m
hd : height of duct, m
ho : height of obstruction, m
ld : length of duct, m
lo : length of obstruction, m
n : mesh height, m
n+ : non-dimensional height from surface of test prism
Nui : local Nusselt number
Num : average Nusselt number
Red : Reynolds number with hydraulic diameter at enclosure cross section as refelence diameter
T : temperature of the air around heating components, K
Tin : inlet temperature, K
To : temperature of heating conponent,K
ud : time-averaged bulk flow velocityat duct inlet, m/s
Vmax : maximum flow late in the case of pulsating flow, m3/s
Vs :flow rate in the case of steady flow (= time averaged flow rate of pulsating flow), m3/s
T+ : non-dimensional temperature rise at surface of prism
: kinematic viscosity, m2/s
REFERENCES
[1]. Emerson Electric Co., “Energy Logic: Reducing Data Center Energy Consumption by Creating Savings that Cascade Across Systems”, On the Web, http://www.emersonnetworkpower.com/documentation/en-US/Brands/ Knurr/Documents/Shared/Energy Logic – Reducing Data Center Energy Consumption by Creating Savings that Cascade Across Systems.pdf, accessed on Jun. 13th, 2016.
[2]. Saitoh, H, and Uchida, K., “Heat and Mass Transport Characteristics of Pulsating Flow in Rectangular Duct Part1. Effect of Pulsating Frequency on Heat Transfer of a Flat Plate Installed in the Duct (in Japanese)”, Thermal Science & Engineering, Vol. 15, No. 4 (2007), 211-221.
[3]. Fukue, T., Hirose, K. and Yatsu, N., “Basic Study on Flow and Heat Transfer Performance of Pulsating Air Flow for Application to Electronics Cooling”, Transactions of the Japan Institute of Electronics Packaging, 7-1 (2015), 123-131.
[4]. Fukue, T., Yatsu, N., Hirose, K. and Shirakawa, H., “Heat Transfer Characteristic of Pulsating Flow around Components in Thermal Equipment (Effects of Shapes of Components on Heat Transfer Coefficient) (in Japanese)”, Proceedings of the 20th JSME National Symposium on Power and Energy Systems (2016), F132.
[5]. Kasuga, Y., “OpenFOAM Note (in Japanese)”, available from <www.geocities.jp/penguinitis2002/study/note/ OpenFOAM.pdf>, (accessed on Jul. 29, 2016).
[7]. Koizumi, K., Hatakeyama, T., Fukue, T. and Ishizuka, M., “MRF Modeling of Axial Fan for Thermal Simulation of Electronic Equipment”, Transactions of The Japan Institute of Electronics Packaging, 7-1 (2014), 58-64.