ARTICLE
Racial/Ethnic Differences in Breastfeeding Initiation
and Continuation in the United Kingdom and
Comparison With Findings in the United States
Yvonne J. Kelly, BSc, PhD, Richard G. Watt, BDS, PhD, James Y. Nazroo, MBBS, MSc, PhD
Department of Epidemiology and Public Health, University College London, London, United Kingdom
The authors have indicated they have no financial relationships relevant to this article to disclose.
ABSTRACT
OBJECTIVE.Patterns of breastfeeding vary considerably across different racial/ethnic
groups; however, little is known about factors that might explain differences across and within different racial/ethnic groups. Here we examine patterns of breastfeed-ing initiation and continuation among a racially/ethnically diverse sample of new mothers and compare this with patterns seen in the United States. The effects of demographic, social, economic, and cultural factors on racial/ethnic differences in breastfeeding practices are assessed.
METHODS.The sample includes all singleton infants whose mothers participated in
the first survey of the United Kingdom Millennium Cohort Study. Missing data reduced the sample to 17 474 (96%) infants with complete data.
RESULTS.After adjustment for demographic, economic, and psychosocial factors,
logistic regression models showed that Indian, Pakistani, Bangladeshi, black Ca-ribbean, and black African mothers were more likely to initiate breastfeeding compared with white mothers. Further adjustment for a marker of cultural tradi-tion attenuated these relatradi-tionships, but all remained statistically significant, sug-gesting that some of the difference was a consequence of cultural factors. After adjustment for demographic, economic, and psychosocial factors, Indian, Paki-stani, Bangladeshi, black Carribbean, and black African mothers were more likely to continue breastfeeding at 3 months compared with white mothers. Additional adjustment for a marker of cultural tradition attenuated the relationship for Indian, Pakistani, Bangladeshi, and black African mothers, but all remained sta-tistically significant. Models run for breastfeeding continuation at 4 and 6 months were consistent with these results.
CONCLUSIONS.We have shown that in the United Kingdom the highest breastfeeding
rates are among black and Asian mothers, which is in stark contrast to patterns in the United States, where the lowest rate is seen among non-Hispanic black mothers. The contrasting racial/ethnic patterns of breastfeeding in the United
www.pediatrics.org/cgi/doi/10.1542/ peds.2006-0714
doi:10.1542/peds.2006-0714
Key Words
race, ethnicity, breastfeeding, psychosocial
Abbreviations
MCS—Millennium Cohort Study OR— odds ratio
Kingdom and United States necessitate very different public health approaches to reach national targets on breastfeeding and reduce health disparities. Those who implement future policies aimed at increasing breast-feeding rates need to pay attention to different social, economic, and cultural profiles of all racial/ethnic groups.
C
OMPELLING EVIDENCE HIGHLIGHTS the benefits of breastfeeding for infants, mothers, and wider soci-ety.1–6These advantages include health, nutritional,im-munologic, developmental, psychological, social, eco-nomic, and environmental aspects.7 Despite these
considerable benefits, breastfeeding rates in the United Kingdom are relatively low and have remained stable in recent years. The latest Infant Feeding Survey revealed that only 69% of UK infants were initially breastfed,8
whereas more recent data from the Millennium Cohort Study (MCS) estimated the rate at 71%.9In the United
Kingdom, breastfeeding rates decline sharply within 3 months of the birth and are significantly lower among younger, less-educated, primiparous, and lower-income mothers.8,9 These socioeconomic patterns of
breastfeed-ing are very similar to those found in the United States.10,11However, stark differences are seen in racial/
ethnic variations in breastfeeding rates between the United Kingdom and United States. In the United King-dom, breastfeeding-initiation rates are highest among black (95%) and Asian (87%) mothers compared with white mothers (67%).8,12In contrast, US data uniformly
demonstrate the lowest rate of breastfeeding among non-Hispanic black mothers.10,11,13–16 Indeed, the most
recent US data from the 2002 National Immunization Survey indicate that the highest rates of breastfeeding initiation are found among Hispanic mothers (80%) compared with white (72%) and non-Hispanic black (51%) mothers.11These data show similar variations in
exclusive breastfeeding rates according to racial/ethnic group.11
Although there is some speculation, little is known about the factors that might explain differences in breastfeeding across and within different racial/ethnic groups in the United Kingdom and United States. The MCS provides an opportunity to assess infant-feeding practices among racial/ethnic minority groups and fac-tors underlying any differences in a contemporary UK setting and to contrast this with the findings in the United States. Our objective for this article was to exam-ine patterns of breastfeeding initiation and continuation among a racially/ethnically diverse sample of new moth-ers and to assess the effects of demographic, economic, psychosocial, and cultural factors on racial/ethnic differ-ences in breastfeeding practices.
METHODS
The MCS
The MCS sample was drawn from infants born in the United Kingdom during a 12-month period spanning the years 2000 –2001. The survey design, recruitment pro-cess, and fieldwork have been described in detail else-where.17Briefly, 18 553 households agreed to participate
in the first (cross-sectional) sweep of this survey, an overall response rate of 68%. Households were identi-fied through the Department of Work and Pensions Child Benefit system and were selected on the basis of where the family resided shortly after the time of birth. All parents of children up to the age of 16 years are eligible to receive Child Benefit, a welfare benefit paid every 4 weeks, which is equivalent to approximately $30 for first-born children and $20 for subsequent children. Uptake of this welfare benefit is almost universal (98%). The sample has a probability design and is clustered at the electoral ward level, with disadvantaged residential areas being overrepresented. The survey involved home visits by interviewers when the cohort member was aged, on average, 9 months. During the interview, ques-tions were asked about infant feeding and health, socio-economic circumstances, a marker of cultural tradition, and household composition. The sample on which this analysis is based includes all singleton infants whose mothers participated in the first survey of the MCS (n⫽
18 247). Missing data on the questionnaire items of in-terest reduced the sample to 17 446 (96%).
Ethical approval for the MCS was gained from the relevant ethics committees, and parents provided in-formed consent before the interviews took place.
Race/Ethnicity
Data on mother’s self-assigned race/ethnicity were col-lected by using the 2001 UK census categories, and the following groups were used for analysis: white, Indian, Pakistani, Bangladeshi, black Caribbean (including mixed/biracial white and black Caribbean), black Afri-can (including mixed/biracial white and black AfriAfri-can) and other. To prevent problems with small cell sizes, mothers who were mixed/biracial black Caribbean and white were categorized as black Caribbean, mothers who were mixed/biracial black African and white were cate-gorized as black African, and mothers who were mixed/ biracial South Asian and white were categorized as other because they could not be categorized into any of the other defined groups. Initial analysis indicated that these aggregations have not affected the conclusions drawn in this article.
the 1960s and 1970s, the Bangladeshis migrated in the 1980s, and the black Africans migrated in the 1990s.
Breastfeeding
Breastfeeding initiation was assessed by the question “did you ever try to breastfeed?” Continuation during the first 9 months was computed on the basis of ques-tions about the age of the infant when last given breast milk and when formula or other types of milk or solids were first given. Predominantly breastfed infants were identified as those who received only breast milk; how-ever, the infant may also have been given water and water-based drinks, fruit juice, oral rehydration salts solution, drop and syrup forms of vitamins, minerals, and medicines, and ritual fluids.18
Explanatory Factors
The explanatory effects of demographic, economic, and psychosocial factors and a marker of cultural tradition were assessed. Demographic, economic, and psychoso-cial variables were gender of infant, mother’s age at time of birth, parity (1, 2, 3 or more children), house-hold income (less than £10 400 to equivalent to the poverty line, £10 400 –£20 800, £20 801–£31 200, £31 201–£52 000, more than £52 000, or “refusal and don’t know”), housing tenure (own/mortgage, rent, or other arrangement), mother’s education level (degree or higher, advanced level or General Certificate of Second-ary Education or overseas equivalent, no qualifications), mother’s occupation (National Statistics Socioeconomic Classification categories: managerial and professional, intermediate, small employer and self-employed, super-visory and technical, semiroutine and routine, or unclas-sifiable), cigarette smoking (never, stopped during preg-nancy, 1–10 per day, or ⱖ11 per day), employment status (working full-time, working part-time, or not working), childcare arrangements (parent, relative, nursery, or other), and lone parenthood. The marker of cultural tradition was language spoken at home (English only, English plus another language, or another lan-guage only).
Statistical Methods
We investigated the relative importance of demographic, economic, psychosocial, and cultural factors in the pre-diction of breastfeeding initiation and continuation at 3 months across racial/ethnic groups by using nested lo-gistic-regression models. Model A shows the odds ratios (ORs) across racial/ethnic groups adjusted for demo-graphic, economic, and psychosocial measures, and model B additionally adjusts for cultural tradition. We chose to report models for continuation at 3 months because 40% of all mothers continued to breastfeed their infant and 17% did so predominantly at this time, whereas the proportions being predominantly breastfed at 4 and 6 months were 3.2% and 0.3% respectively.
However, models were run for breastfeeding continua-tion at 4 and 6 months, and the results were consistent with those for continuation at 3 months (data not shown). Models were also run to investigate the explan-atory effect of income on breastfeeding initiation within each racial/ethnic group.
All analyses, which were based on participants with complete data, allowed for the clustered stratified sample using the “survey” commands in Stata 8.2.19
RESULTS
Data are shown for white (n ⫽ 14 635), Indian (n ⫽
417), Pakistani (n⫽742), Bangladeshi (n⫽283), black Caribbean (n⫽240), black African (n⫽321), and other (n⫽836) mothers of cohort members. The mean age of the infants at the time of interview was 9.2 months (SD: 0.53 months). Breastfeeding initiation and continuation over time shows a pattern of consistently higher rates for black African mothers and consistently lower rates for white and Pakistani mothers (Fig 1), whereas predomi-nant breastfeeding shows black Caribbean and other mothers with consistently high rates, Indian mothers in the middle, and all of the other groups with low rates (Fig 2). Of those mothers who were breastfeeding their infant at 3 months, the largest proportion who did so predominantly were Pakistani (49%) and black Carib-bean (44%) mothers, and the lowest proportions were among Bangladeshi (29%) and black African (24%) mothers.
Table 1 shows the distribution of demographic, psy-chosocial, economic, and cultural explanatory factors according to the mother’s racial/ethnic group. It is worth noting that across all racial/ethnic groups breastfeeding initiation was more common among mothers who spoke a language other than English (82%) or in addition to English (82%) compared with English only (63%) at home.
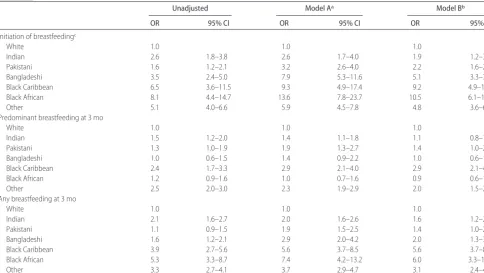
The odds of breastfeeding initiation, any breastfeed-ing at 3 months, and predominant breastfeedbreastfeed-ing at 3 months, with the largest group (white mothers) as the reference category, are shown in Table 2. In the unad-justed model, the odds of breastfeeding initiation among black African, black Caribbean, Bangladeshi, Indian, and Pakistani mothers were 8.1, 6.5, 3.5, 2.6, and 1.6, re-spectively, compared with white mothers. Adjustment for demographic, economic, and psychosocial factors (model A) increased the odds for the Pakistani, Bang-ladeshi, black Caribbean, and black African mothers. Additional adjustment for language spoken at home (model B) attenuated the relationship for black African, Indian, Pakistani, and Bangladeshi mothers, but all dif-ferences remained statistically significant.
economic, and psychosocial factors strengthened the re-lationship among black African, black Caribbean, and Bangladeshi mothers, and Pakistani mothers also
be-came significantly more likely to breastfeed their infants compared with white mothers. Additional adjustment for language spoken at home attenuated the relationship FIGURE 2
Proportion of infants predominantly breastfed during the first 6 months of life according to ethnic group.
FIGURE 1
TABLE 1 Demographic, Economic, Social, and Cultural Factors According to Ethnic Group White
(n⫽14 635), %
Indian (n⫽417),
%
Pakistani (n⫽742),
%
Bangladeshi (n⫽369),
%
Black Caribbean (n⫽240),
%
Black African (n⫽321),
%
Other (n⫽836),
%
Mother’s age at time of birth, y
13–19 9.3 1.5 6.1 4.9 9.2 3.5 6.1
20–24 18.2 21.8 34.9 40.7 18.1 13.6 15.0
25–29 27.3 37.9 31.4 33.3 22.7 24.3 25.7
30–34 29.5 25.2 19.7 14.9 21.5 34.1 33.9
35–39 13.6 12.3 5.8 4.9 24.6 19.9 16.9
ⱖ40 2.1 1.3 1.7 1.1 3.8 4.6 2.3
Unknown 0.0 — 0.3 0.3 — — 0.1
Parity, No. of children
1 42.6 38.8 28.6 21.4 36.2 27.8 44.6
2 34.6 30.1 23.2 20.1 31.9 26.2 27.5
ⱖ3 21.5 20.6 33.3 35.8 26.2 33.5 17.1
Unknown 1.3 10.6 3.5 22.8 5.8 12.5 10.9
Household income, British pounds (£)
0–10 400 23.8 20.3 38.4 41.5 44.2 41.4 26.8
10 400–20 800 30.7 30.3 34.5 28.7 21.2 23.7 25.6
20 800–31 200 19.5 15.9 5.6 2.7 12.3 7.9 15.3
31 200–52 000 14.1 12.5 3.1 1.6 5.8 7.4 14.5
ⱖ52 000 5.1 5.5 0.8 0.3 1.2 2.2 5.6
Unknown 6.8 15.5 17.7 25.2 15.4 17.4 1.7
Housing tenure
Owns or mortgage 60.9 66.5 55.7 30.9 26.5 12.5 49.8
Rents private or council 33.8 18.9 22.9 53.9 65.4 85.3 43.9
Lives with parents or other arrangement
5.2 14.2 20.6 14.9 7.3 2.2 5.7
Unknown 0.1 0.4 0.8 0.3 0.8 — 0.5
Mother’s occupational social class
Managerial and professional 28.0 19.7 6.1 5.7 25.0 15.8 27.2
Intermediate 17.7 18.9 7.9 6.5 24.2 10.6 12.4
Small employer and self-employed 3.6 2.5 2.0 0.3 2.3 2.2 5.4
Low supervisory and technical 5.9 2.3 3.1 1.6 5.8 4.1 4.0
Semiroutine and routine 38.2 35.6 29.7 24.4 30.0 29.2 26.6
Unclassifiable 6.5 21.0 51.1 61.5 12.7 38.1 24.4
Mother’s education
First or higher degree 15.6 21.8 6.7 3.0 10.8 18.8 26.5
A, AS, or HE diploma 18.4 16.7 9.5 10.0 16.9 16.6 16.3
GCSE grades A–C 36.7 20.6 17.2 19.0 38.1 13.6 14.3
GCSE grades D–G 11.6 7.8 7.9 8.7 12.7 4.6 3.6
Other academic qualifications including overseas
1.0 10.2 12.2 13.0 2.7 9.5 14.3
No academic qualifications 16.4 22.9 45.8 46.1 18.1 36.5 24.8
Unknown 0.2 — 0.6 0.3 0.8 0.3 0.3
Employment status of mother
Not working 48.6 57.4 88.2 90.0 52.7 65.4 62.9
Part-time 33.6 25.4 6.1 5.1 19.2 10.6 18.7
Full-time 17.6 16.7 5.3 4.6 28.1 24.0 18.1
Unknown 0.2 0.4 0.3 0.3 — — 0.3
Smoking status
Non smoker 59.1 94.1 95.4 97.3 60.8 94.8 73.6
Smoked before pregnancy and stopped 14.1 3.6 1.1 0.8 17.3 3.3 12.5
up to 10 per day 20.1 2.1 2.9 1.9 17.7 1.9 12.0
ⱖ11 per day 6.3 0.2 0.5 0.0 2.3 0.0 1.8
Unknown 0.3 — 0.1 — 1.9 — 0.1
1-parent household 17.3 4.7 8.3 6.5 50.8 43.9 15.2
Language spoken at home
English only 97.6 15.9 5.0 1.6 96.5 33.0 42.6
English and other 2.0 67.6 69.0 63.4 3.1 51.8 41.6
Other only 0.5 16.5 26.0 35.0 0.4 15.3 15.8
for Indian, Bangladeshi, black African, and Pakistani mothers (for Pakistani mothers, differences lost statisti-cal significance). Black Caribbean, Indian, and black Af-rican mothers were more likely to predominantly breast-feed their infants at 3 months compared with white mothers. After adjustment for demographic, economic, and psychosocial factors, the odds were significantly higher for Pakistani compared with white mothers, whereas further adjustment for language spoken at home reduced the odds for all groups compared with white mothers except for the black Caribbean mothers. Table 3 shows the relative unadjusted effect of in-come on the odds of breastfeeding initiation within ra-cial/ethnic groups. For the white and Asian mothers, higher income levels were associated with increased
odds of breastfeeding initiation with the exception of the Indian mothers. The association between income and breastfeeding initiation was less consistent for those in the black groups.
DISCUSSION
In this large national UK study, black African, black Caribbean, Bangladeshi, Pakistani, and Indian mothers were more likely to initiate breastfeeding compared with white mothers. Continuation of breastfeeding at 3 months was more likely for black Caribbean, black Af-rican, Indian, and Bangladeshi compared with white mothers. Black Caribbean mothers were more likely to predominantly breastfeed at 3 months compared with white mothers.
TABLE 2 ORs and 95% Confidence Intervals for Effect of Ethnicity on Initiation and Continuation of Breastfeeding
Unadjusted Model Aa Model Bb
OR 95% CI OR 95% CI OR 95% CI
Initiation of breastfeedingc
White 1.0 1.0 1.0
Indian 2.6 1.8–3.8 2.6 1.7–4.0 1.9 1.2–3.0
Pakistani 1.6 1.2–2.1 3.2 2.6–4.0 2.2 1.6–2.9
Bangladeshi 3.5 2.4–5.0 7.9 5.3–11.6 5.1 3.3–7.9
Black Caribbean 6.5 3.6–11.5 9.3 4.9–17.4 9.2 4.9–17.3
Black African 8.1 4.4–14.7 13.6 7.8–23.7 10.5 6.1–18.2
Other 5.1 4.0–6.6 5.9 4.5–7.8 4.8 3.6–6.6
Predominant breastfeeding at 3 mo
White 1.0 1.0 1.0
Indian 1.5 1.2–2.0 1.4 1.1–1.8 1.1 0.8–1.5
Pakistani 1.3 1.0–1.9 1.9 1.3–2.7 1.4 1.0–2.1
Bangladeshi 1.0 0.6–1.5 1.4 0.9–2.2 1.0 0.6–1.7
Black Caribbean 2.4 1.7–3.3 2.9 2.1–4.0 2.9 2.1–4.0
Black African 1.2 0.9–1.6 1.0 0.7–1.6 0.9 0.6–1.4
Other 2.5 2.0–3.0 2.3 1.9–2.9 2.0 1.5–2.6
Any breastfeeding at 3 mo
White 1.0 1.0 1.0
Indian 2.1 1.6–2.7 2.0 1.6–2.6 1.6 1.2–2.1
Pakistani 1.1 0.9–1.5 1.9 1.5–2.5 1.4 1.0–2.0
Bangladeshi 1.6 1.2–2.1 2.9 2.0–4.2 2.0 1.3–3.1
Black Caribbean 3.9 2.7–5.6 5.6 3.7–8.5 5.6 3.7–8.4
Black African 5.3 3.3–8.7 7.4 4.2–13.2 6.0 3.3–10.8
Other 3.3 2.7–4.1 3.7 2.9–4.7 3.1 2.4–4.0
CI indicates confidence interval.
aModel A plus gender of baby, parity, age of mother, housing tenure, household income, mother’s education, mother’s occupational social class, smoking status, mother’s employment status, 1 or 2 parent household, child care arrangements.
bModel B plus gender of baby, parity, age of mother, housing tenure, household income, mother’s education, mother’s occupational social class, smoking status, mother’s employment status, 1 or 2 parent household, child care arrangements, language spoken at home.
cChild care arrangements not included in these models.
TABLE 3 ORs and 95% Confidence Intervals for Effect of Income on Breastfeeding Initiation Within Ethnic Groups
White Indian Pakistani Bangladeshi Black
Caribbean
Black African Other
Below poverty line (less than £10 400) 1 1 1 1 1 1 1
Above poverty line but below average (£10 400–£20 800)
2.0 (1.8–2.2) 0.9 (0.4–2.2) 1.4 (0.9–2.1) 3.3 (0.7–15.1) 2.8 (0.5–17.6) 0.5 (0.1–2.2) 1.7 (1.0–3.0)
Average or above (more than £20 800)
5.1 (4.7–5.6) 1.5 (0.6–3.6) 2.6 (1.2–5.7) 2.5 (0.2–28.8) 0.9 (0.3–3.0) 6.4 (0.2–195.4) 4.1 (2.2–7.5)
Adjustment for psychosocial, economic, and demo-graphic factors increased the breastfeeding advantage of racial/ethnic minority groups with the exception of the Indian group. This is not surprising, given the socioeco-nomic gradient in breastfeeding shown in Table 3, with mothers from advantaged backgrounds more likely to breastfeed their infants8,9and the economic disadvantage
of racial/ethnic minority groups compared with the white group in the United Kingdom (with the exception of the Indian group, which Table 1 shows has a similar economic profile to the white group). We also examined the possibility that differences in breastfeeding across racial/ethnic groups reflected differences in cultural tra-dition by using (as a crude marker) language spoken at home. This correlated with breastfeeding within racial/ ethnic groups: those who spoke English only at home were less likely to breastfeed, and adjustment for this in the models reduced the advantage for those racial/ethnic minority groups (Indian, Pakistani, Bangladeshi, and black African) in which a significant number of respon-dents did not speak English at home. This suggests that the lower breastfeeding rate in the white group is at least partly a reflection of cultural difference and that more “traditional” mothers within racial/ethnic minority groups are more likely to breastfeed. A concern, then, is that “integration” into dominant cultural practices may reduce breastfeeding in racial/ethnic minority groups.
Few studies have assessed breastfeeding rates among representative samples of different racial/ethnic minor-ity groups. Our results, however, are in support of the findings from the UK Infant Feeding Survey in 2000 and descriptive analysis of the MCS, both of which showed higher rates of breastfeeding among the black and Asian mothers compared with the white mothers.8,12The
con-trasting racial/ethnic patterns of breastfeeding in the United Kingdom compared with those in the United States raises important questions about the varying na-ture of racial/ethnic disadvantage. In a recent national US survey, initiation rates were highest among the mothers of Hispanic (80%) compared with non-Hispanic white (72%) and non-Hispanic black (51%) infants.11At
6 months only 20% of black infants were breastfed compared with 37% of white and 40% of Hispanic in-fants. The higher rates of breastfeeding among, perhaps less culturally integrated, Hispanic families reflects those found among racial/ethnic minority groups in the United Kingdom. The differences between black Amer-icans and Hispanics on the one hand and between black Americans and the black groups in the United Kingdom on the other hand are puzzling, particularly because overall rates of breastfeeding in the United States and United Kingdom are remarkably similar. In contrast, broader investigations of racial/ethnic disparities in health have revealed great similarities between black Caribbean people in the United Kingdom and black Americans for a range of health outcomes, findings that
are not surprising given their similar contemporary so-cioeconomic positions, as well as their shared historical trajectories.20 That the advantage shared by black and
other racial/ethnic minority groups in the United King-dom in breastfeeding, despite their socioeconomic disad-vantage, is not shared by black Americans with other racial/ethnic minority groups in the United States is of great public health significance and merits additional investigation. That evidence from the United Kingdom suggests that a more-traditional cultural location corre-lates with increased rates of breastfeeding suggests pos-sible lines of investigation. Another pospos-sible explanation could relate to the different barriers that may hinder a mother’s breastfeeding decisions and practices. A range of social, economic, employment, and environmental factors have been identified as influential on breastfeed-ing patterns. These factors may operate differently in the United Kingdom and United States and, therefore, partly explain the differing racial/ethnic patterns of breastfeed-ing between the 2 countries. Also, both health care systems and public health programs differ greatly be-tween the United States and United Kingdom.
More positively, although similar racial/ethnic differ-ences in breastfeeding in the United States have been shown by Ryan et al10using the Ross Laboratories
Moth-ers Surveys, trend data from these surveys suggest that the racial/ethnic disadvantage is decreasing over time. For example, using estimates provided in Table 1 of the Ryan et al article, the relative risk of initiating breast-feeding for the mothers of black infants compared with mothers of white infants increased from 0.58 to a still-significant 0.73 between 1996 and 2001. Trends in av-erage rates of breastfeeding, as well as differences in these trends across racial/ethnic groups, suggest that additional success in reducing disparities in this area can be obtained through public health initiatives.
One possible limitation of our study is that the data were collected when the infants were 9 months old and, thus, could potentially be affected by recall bias. Previous studies have shown that the recall of breastfeeding ini-tiation and duration are more accurate than recall of when complementary feeding commenced.21,22
CONCLUSIONS
We have shown that rates of breastfeeding initiation and continuation in the United Kingdom are higher among black and Asian mothers compared with white mothers. These findings are in stark contrast to US data, which show the lowest rates of breastfeeding among non-His-panic black mothers. The contrasting racial/ethnic pat-terns of breastfeeding in the United Kingdom and United States necessitate very different public health ap-proaches to reach national targets on breastfeeding and reduce health disparities. Those who implement future policies aimed at increasing breastfeeding rates need to pay attention to the different social, economic, and cul-tural profiles of all racial/ethnic groups.
REFERENCES
1. British Paediatric Association. Is breastfeeding beneficial in the UK? Statement of the standing Committee on Nutrition of the British Paediatric Association.Arch Dis Child.1994;71:376 –380 2. Howie PW, Forsyth JS, Ogston SA, Clark A, Florey CD. Protec-tive effect of breast feeding against infection.BMJ.1990;300: 11–16
3. Kramer MS, Chalmers B, Hodnett ED, et al. Promotion of Breastfeeding Intervention Trial (PROBIT): a randomized trial in the Republic of Belarus.JAMA.2001;285:413– 420 4. Wilson AC, Forsyth JS, Greene SA, Irvine L, Hau C, Howie PW.
Relation of infant diet to childhood health: seven year follow up of cohort of children in Dundee infant feeding study.BMJ.
1998;316:21–25
5. Collaborative Group on Hormonal Factors in Breast Cancer. Breast cancer and breastfeeding: collaborative reanalysis of individual data from 47 epidemiological studies in 30 countries, including 50302 women with breast cancer and 96973 women without the disease.Lancet.2002;360:187–195
6. Gwinn ML, Lee NC, Rhodes PH, Layde PM, Rubin GL. Preg-nancy, breast feeding, and oral contraceptives and the risk of epithelial ovarian cancer.J Clin Epidemiol.1990;43:559 –568 7. Gartner LM, Morton J, Lawrence RA, et al. Breastfeeding and
the use of human milk.Pediatrics.2005;115:496 –506 8. Hamlyn B, Brooker S, Oleinikova K, Wands S. Infant feeding
2000. London, United Kingdom: Stationery Office; 2002 9. Kelly Y, Watt R. Breast-feeding initiation and exclusive
dura-tion at 6 months by social class: results from the Millennium Cohort Study.Public Health Nutr.2005;8:417– 421
10. Ryan AS, Wenjun Z, Acosta A. Breastfeeding continues to increase into the new millennium. Pediatrics. 2002;110: 1103–1109
11. Li R, Darling N, Maurice E, Barker L, Grummer-Strawn L. Breastfeeding rates in the United States by characteristics of the child, mother or family: the 2002 National Immunization Sur-vey.Pediatrics.2005;115(1). Available at: www.pediatrics.org/ cgi/content/full/115/1/e31
12. Griffiths LJ, Tate AR, Dezateux C. The contribution of parental and community racial/ethnicity to breastfeeding practices: ev-idence from the Millennium Cohort Study. Int J Epidemiol.
2005;34:1378 –1386
13. Wiemann CM, DuBois JC, Berenson AB. Racial/ethnic differ-ences in the decision to breastfeed among adolescent mothers.
Pediatrics. 1998;101(6). Available at: www.pediatrics.org/cgi/ content/full/101/6/e11
14. Timbo B, Altekruse S, Headrick M, Klontz K. Breastfeeding among black mothers: evidence supporting the need for pre-natal intervention.J Soc Pediatr Nurs.1996;1:35– 40
15. Kurinij N, Shiono PH, Rhoads GG. Breastfeeding incidence and duration in black and white women. Pediatrics. 1988;81: 365–371
16. Rassin DK, Richardson CJ, Baranowski T, et al. Incidence of breastfeeding in a low socioeconomic group of mothers in the United States: racial/ethnic patterns. Pediatrics. 1984;73: 132–137
17. Dex S, Joshi H, eds.Millennium Cohort Study: First Survey—A User’s Guide to Initial Findings.London, United Kingdom: Centre for Longitudinal Studies, University of London; 2004 18. World Health Organization. WHO global data bank on
breast-feeding. Available at: www.who.int/nutrition/databases/ infantfeeding/en/index.html. Accessed August 4, 2006 19. Stata Statistical Software[computer program]. Release 8.2.
Col-lege Station, TX; Stata Corporation; 2004
20. Nazroo JY, Williams DR. The social determination of racial/ ethnic/racial inequalities in health. In: Marmot M, Wilkinson RG, eds.Social Determinants of Health. 2nd ed. Oxford, United Kingdom: Oxford University Press; 2005:238 –266
21. Eaton-Evans J, Dugdale AE. Recall by mothers of the birth weights and feeding of their children. Hum Nutr Appl Nutr.
1986;40:171–175
DOI: 10.1542/peds.2006-0714
2006;118;e1428
Pediatrics
Yvonne J. Kelly, Richard G. Watt and James Y. Nazroo
United Kingdom and Comparison With Findings in the United States
Racial/Ethnic Differences in Breastfeeding Initiation and Continuation in the
Services
Updated Information &
http://pediatrics.aappublications.org/content/118/5/e1428
including high resolution figures, can be found at:
References
http://pediatrics.aappublications.org/content/118/5/e1428#BIBL
This article cites 15 articles, 7 of which you can access for free at:
Subspecialty Collections
http://www.aappublications.org/cgi/collection/nutrition_sub Nutrition
following collection(s):
This article, along with others on similar topics, appears in the
Permissions & Licensing
http://www.aappublications.org/site/misc/Permissions.xhtml
in its entirety can be found online at:
Information about reproducing this article in parts (figures, tables) or
Reprints
http://www.aappublications.org/site/misc/reprints.xhtml
DOI: 10.1542/peds.2006-0714
2006;118;e1428
Pediatrics
Yvonne J. Kelly, Richard G. Watt and James Y. Nazroo
United Kingdom and Comparison With Findings in the United States
Racial/Ethnic Differences in Breastfeeding Initiation and Continuation in the
http://pediatrics.aappublications.org/content/118/5/e1428
located on the World Wide Web at:
The online version of this article, along with updated information and services, is
by the American Academy of Pediatrics. All rights reserved. Print ISSN: 1073-0397.