Available online on 30.08.2019 at http://jddtonline.info
Journal of Drug Delivery and Therapeutics
Open Access to Pharmaceutical and Medical Research
© 2011-18, publisher and licensee JDDT, This is an Open Access article which permits unrestricted non-commercial use, provided the original work is properly cited
Open Access
Research Article
Simultaneous Estimation and Validation of Multicomponent Formulation in
Tablets by Spectrophotometric Method
Rupali S. Joshi*, Deepali S. Sanap and Surekha M. Sase
Dr. Vithalrao Vikhe Patil Foundation’s College of Pharmacy, Vilad Ghat, Ahmednagar, 414 111, India
ABSTRACT
Two methods for the simultaneous estimation of atorvastatin calcium, glimepiride and metformin hydrochloride in three-component solid dosage forms have been developed. First method involved solving simultaneous equations based on measurement of absorbance at three wavelengths, 247.2 nm, 224.8 nm and 236 nm as the λmax of atorvastatin calcium, glimepiride and metformin hydrochloride respectively while in the second method the instrument is preprogrammed to collect and compile the spectral data from the scan of standards and produces the result by matrix calculations. The linearity for three drugs was in the range of 5-30 μg/ml. The procedures were successfully applied for the simultaneous determination of three drugs in laboratory prepared mixtures and commercial tablet preparation. High recovery and low % COV revealed the reliability of the methods indicating proposed methods are accurate and precise for the simultaneous estimation of three drugs in pure and tablet formulation.
Keywords: Atorvastatin calcium, Glimepiride, Metformin hydrochloride, Simultaneous equation method. Multiwavelength Spectroscopy
Article Info:Received 11 July 2019; Review Completed 14 August 2019; Accepted 19 August 2019; Available online 30 Aug 2019 Cite this article as:
Joshi RS, Sanap DS, Sase SM, Simultaneous Estimation and Validation of Multicomponent Formulation in Tablets by Spectrophotometric Method, Journal of Drug Delivery and Therapeutics. 2019; 9(4-A):48-52
http://dx.doi.org/10.22270/jddt.v9i4-A.3399
*Address for Correspondence:
Rupali S. Joshi, Dr. Vithalrao Vikhe Patil Foundation’s College of Pharmacy, Vilad Ghat, Ahmednagar, 414 111, India
1.
INTRODUCTION
Chemically, atorvastatin calcium is [R-(R*,R*)-2-(4-fluorophenyl)-β -dihydroxy-5-(1-methylethyl)-3-phenyl-4-[(phenylamino)carbonyl]-1H-pyrrole-1-heptonic acid-calcium salt (2:1) trihydrate used as a synthetic cholesterol-lowering agent. Glimepiride is a sulphonylurea antidiabetic drug and is chemically 3-ethyl-2,5-dihydro-4-methyl-N-[2-[4-[[[(trans-ethyl
cyclohexyl)amino]carbonyl]amino]sulphonyl]ethyl]2-oxo-1H-pyrrole-1-carboxamide Metformin hydrochloride is an oral antidiabetic drug and is chemically N, N-dimethyl imidodicarbonimidic diamide Analytical methods, such as RP- HPLC [1], and HPTLC [2] have been reported for the estimation of atorvastatin calcium from its formulations. UHPLC-MS/MS method for determination of atorvastatin calcium in human plasma is also reported [3]. A literature study found that HPLC [4], LC-MS/MS [5] techniques are recorded for the assessment of glimepiride. RP HPLC [6] and stability indicating HPTLC [7] method for estimation of glimepiride and metformin hydrochloride is reported. UV Spectrophotometric [8] method for estimation of metformin alone is reported. Simultaneous estimation of metformin, glimepiride and atorvastatin in combined tablet dosage form by UPLC [9] and Stability Indicating RP-HPLC are also
reported [10]. A combination of atorvastatin calcium, glimepiride, and metformin hydrochloride is commercially available in a tablet dosage form. Literature shows that there is no technique of analyzing these three drugs in combination at the same time by spectrophotometry. So we communicate here rapid and cost-effective quality-control tool for routine quantitative analysis of all three drugs in their combined dosage forms by spectrophotometry.
2.
EXPERIMENTAL
2.1. Materials
UV-visible double beam spectrophotometer, Shimadzu model 1700 with 1 nm spectral bandwidth, ± 0.3 nm wavelength precision and a couple of 10 mm matching quartz cells were used. The commercially available tablet, cdpro 2 (Label claim: atorvastatin calcium 10 mg, glimepiride 2 mg and metformin hydrochloride 500 mg) was procured from the local market.
2.2. Selection of common solvent
after assessing the solubility of three drugs in different solvents.
2.3. Preparation of standard stock and calibration curve The standard stock solutions of atorvastatin calcium, glimepiride, and metformin hydrochloride were prepared by dissolving 10 mg of each drug in 10mL of methanol in 10 mL of the volumetric flask to get a solution containing 1000 µg/mL of each drug. From the above solution, 0.1 ml solution was taken and diluted to 10 ml with methanol to get a solution containing 10 µg/ mL.
Working standard solutions of 10 µg/mL were scanned in the entire UV range of 400-200 nm to determine the λmax of these drugs. The λmax of atorvastatin calcium, glimepiride, and metformin hydrochloride was found to be 247.2 nm, 224.8 nm, and 236 nm respectively (Figure-1). Six working standard solutions for three drugs having concentration 5, 10, 15, 20, 25, 30 µg/mL was prepared in methanol from the stock solution. The absorbance of resulting solutions for three drugs were measured at their respective λmax and a calibration curve was plotted against concentration to get the linearity and regression equation of three drugs.
Figure 1. Overlain spectra of atorvastatin calcium, glimepiride and metformin hydrochloride
2.4 Method I: Simultaneous equation method
Simultaneous equation method of analysis was based on the absorption of drugs (atorvastatin calcium, glimepiride, and metformin hydrochloride) at the wavelength maximum of each other. Three wavelengths selected for the development of the simultaneous equations were 247.2 nm, 224.8 nm, and 236 nm λ max of atorvastatin calcium, glimepiride, and metformin hydrochloride respectively. The absorbance of
three drugs was measured at 247.2 nm, 224.8 nm, and 236 nm. The absorptivity values determined at 247.2 nm, 224.8 nm and 236 nm for atorvastatin were 0.0457 (ax1), 0.0342 (ax2), 0.0418 (ax3); for glimepiride 0.0142 (ay1), 0.0633 (ay2), 0.0409 (ay3); for metformin hydrochloride 0.0438 (az1), 0.0621 (az2), 0.0931 (az3). These values are means of six estimations. Thus absorptivity coefficients were substituted in the following equations to obtain the concentration of three drugs.
MH Gl
AC
xC
xC
xC
A
1
0
.
0457
0
.
0142
0
.
0438
…...Eqn.1MH Gl
AC
xC
xC
xC
A
2
0
.
0342
0
.
0633
0
.
0621
……...Eqn. 2MH Gl
AC
xC
xC
xC
A
3
0
.
0418
0
.
0409
0
.
0931
………..Eqn.3Where CAC, CGl, and CMH are concentration the of atorvastatin,
glimepiride and metformin hydrochloride respectively. A1,
A2, and A3 are the absorbance of the mixture at 247.2 nm,
224.8 nm, and 236 nm respectively and concentration of three drugs in the sample were determined using Eqn.1, 2 and 3.
2.6. Method II: Multiwavelength Spectroscopy
In this method, the instrument is preprogrammed to collect and compile the spectral data from the scan of standards and produces the result by matrix calculations. Five mixed standards of atorvastatin calcium, glimepiride and metformin hydrochloride having concentrations in µg/mL 0.1:0.02:5, 0.2:0.04:10, 0.3:0.06:15, 0.4:0.08:20 and
Table1. Analysis data of tablet formulation
Method Drug
Label claim mg/tab
Amount found* mg/tab
Label claim (%)
S.D.* % COV S.E*.
I
AC 10 9.980 99.80 0.9894 0.9913 0.4039 Gl 2 2.0034 100.17 0.3771 0.3764 0.1539 MH 500 500.65 100.13 0.7527 0.7517 0.3072
II
AC 10 9.985 99.85 0.5471 0.5479 0.2233 Gl 2 2.011 100.56 0.6521 06484 0.2662 MH 500 502.1 100.43 0.4781 0.4760 0.1951
AC: Atorvastatin Calcium, Gl: Glimepiride, MH: Metformin hydrochloride, S.D.: Standard deviation, COV: Coefficient of variation, S.E.: Standard error, *Average of six estimation of tablet formulation
Figure 2. Overlain Spectra of Mixed Standard of Atorvastatin Calcium, Glimepiride and Metformin Hydrochloride
2.5. Analysis of the tablet formulations
Twenty tablets of marketed formulation were accurately weighed and powdered. A standard addition method has been used for drug assessment. A quantity of powder equivalent to 5 mg of metformin hydrochloride was weighed and dissolved in 10mL of methanol Then the solution was filtered through Whatman filter paper no 41. From the above solution, 0.2 mL of solution was taken and diluted to 10 mL with the same solvent to get a solution containing 10 µg/mL of metformin hydrochloride and the corresponding concentration of atorvastatin calcium and glimepiride. To this, 0.05mL of stock solution (1000 µg/mL) of pure atorvastatin calcium and glimepiride was added and volume was made up to the mark with methanol. The purpose of this addition was to bring the concentration of atorvastatin calcium and glimepiride in the linearity range. With this addition, the concentration of atorvastatin calcium, glimepiride and metformin hydrochloride in the samples was brought to 5.2, 5.04 and 10 µg/mL respectively. Analysis
operation with tablet formulation was repeated six times. The result of the analysis of tablet formulation was reported in Table 1.
2.7. Validation11 2.7.1 Accuracy
Table 2. Result of recovery studies
Tablet Brand Method
Recovery level (Added amount)
Percent recovery+ SD#
AC Gl MH
cdpro 2 (Label claim: atorvastatin calcium 10 mg, glimepiride 2 mg and metformin hydrochloride 500 mg)
I
80% 100.20 +0.342 100.45+0.457 99.50+0.453 100% 99.50+ 0.571 100.1+0.742 100.54+0.462 120% 98.50+0.457 100.84+0.561 99.47+0.471
II
80% 98.56+0.354 98.40+0.483 101.45+0.542 100% 100.40+0.451 98.50+0.561 100.20+0.562 120% 98.50+0.587 101.60+0.874 99.30+0.541 AC: Atorvastatin Calcium, Gl: Glimepiride, MH: Metformin hydrochloride, S.D.: Standard deviation,
# Average of three estimation at each level of recovery 2.7.2. Precision
By studying repeatability and intermediate precision, precision was determined.
2.7.2.1. Repeatability
The result of repeatability indicates the accuracy over a short time and inter-assay precision under the same operating conditions. The standard deviation, coefficient of variance and standard error were calculated for three drugs. Repeatability with tablet formulation was conducted six times. The statistical assessment findings are presented in Table 1.
2.7.2.2. Intermediate Precision (Inter-day and Intra-day precision)
Intermediate precision was carried out by doing intra and inter-day precision study. In intraday study concentration of three drugs was calculated on the same day at an interval of one hour. In the inter-day study, the concentration of drug content was calculated on three different days. Study expresses within laboratory variation on different days. In both intra- and inter-day precision study for methods percentage of COV was not more than 1.0 % indicates good intermediate accuracy (Table 3).
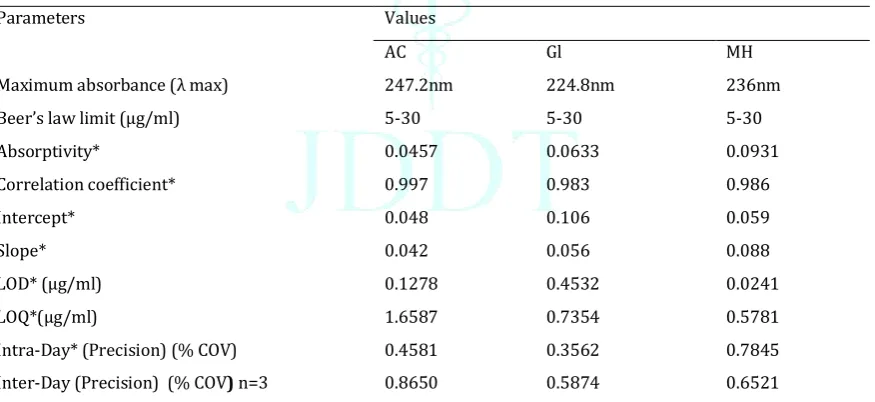
Table 3. Optical characteristics data and validation parameters Parameters Values
AC Gl MH
Maximum absorbance (λ max) 247.2nm 224.8nm 236nm Beer’s law limit (µg/ml) 5-30 5-30 5-30 Absorptivity* 0.0457 0.0633 0.0931 Correlation coefficient* 0.997 0.983 0.986 Intercept* 0.048 0.106 0.059 Slope* 0.042 0.056 0.088 LOD* (µg/ml) 0.1278 0.4532 0.0241 LOQ*(µg/ml) 1.6587 0.7354 0.5781 Intra-Day* (Precision) (% COV) 0.4581 0.3562 0.7845 Inter-Day (Precision) (% COV) n=3 0.8650 0.5874 0.6521
AC: Atorvastatin Calcium, Gl: Glimepiride, MH: Metformin hydrochloride, S.D.: Standard deviation, COV: Coefficient of variation, * Average of six determination.
2.7.3. Linearity
Appropriate dilutions of standard stock solutions have been tested according to the techniques established for each drug. The Beer- Lambert’s concentration range was found to be 5-30 µg/mL for atorvastatin calcium, glimepiride, and metformin hydrochloride. The linearity data for both methods are presented in Table 3.
2.7.4. Limit of Detection (LOD) and Limit of Quantitation (LOQ)
3.
RESULTS AND DISCUSSION
The Beer- Lambert’s concentration range was found to be 5-30 µg/mL for atorvastatin calcium, glimepiride, and metformin hydrochloride at 247.2 nm, 224.8 nm and 236 nm wavelengths and coefficient of correlation were found 0.997, 0.983 and 0.986 respectively. All three drugs showed good regression values at their respective wavelengths and the results of the recovery study revealed that any small change in the drug concentration in the solution could be accurately determined by the proposed methods.
Percentage estimation of three drugs found in tablet dosage form were 99.80, 100.17 and 100.13 as per method I while 99.85, 100.56, 100.43 as per method II for atorvastatin calcium, glimepiride, and metformin hydrochloride respectively with standard deviation <2 (Table 1).
In method II five mixed standard and three sampling wavelengths were selected through rational experimentation keeping in view the number of drugs in the formulation and molar absorptivity coefficients of all three drugs (Fig. 2). The method requires no manual calculations, produces comparable results to the first method and is more suitable as compared to the method I.
The validity and reliability of the proposed methods were assessed by recovery studies. Sample recoveries for both the methods are in good agreement with their respective label claims, which suggested non-interference of formulation additives in estimation (Table-2).
Precision was determined by studying the repeatability and intermediate precision. Repeatability result indicates the precision under the same operating conditions over a short interval time and inter-assay precision. The standard deviation, coefficient of variance and standard error were calculated for atorvastatin calcium, glimepiride, and metformin hydrochloride (Table 1). The intermediate precision study expresses within laboratory variation on different days. In both intra and inter-day precision studies for both the methods %COV were not more than 1.0 % indicates good intermediate precision (Table 3).
The LOD values were 0.1278, 0.4532 and 0.0241 µg/mL and LOQ values were 1.6587, 0.7354 and 0.5781 µg/mL for atorvastatin calcium, glimepiride and metformin hydrochloride respectively. Low values of LOD and LOQ indicated good sensitivity of proposed methods.
4.
CONCLUSION
The results of the analysis of two drugs from tablet formulation using all the three developed methods were found close to 100% for atorvastatin calcium, glimepiride, and metformin hydrochloride, the standard deviation was satisfactorily low indicating accuracy and reproducibility of the methods. Recovery trials have been satisfactory, showing that excipients are not interfering. The developed methods were found to be simple, rapid, and accurate and can be used
for routine estimation of three drugs from tablet formulations.
REFERENCES
1. Jaiprakash N.Sangshetti, Mohammed Aqeel, Zahid Zaheera, Rana Z Ahmed, M.H.G.Dehghan, Indrajeet Gonjari, Development and validation of RP-HPLC method for determination of Atorvastatin calcium and Nicotinic acid in combined tablet dosage form, Journal of Saudi Chemical Society,2016;20(1); 5328-5333.
2. Nagasarapu Mallıkarjuna Rao, D. Gowri Sankar, Development and Validation of HPTLC Method for the Simultaneous Estimation of Amlodipine Besylate and Atorvastatin Calcium in Combined Dosage Form, Eurasian J Anal Chem, 2016;11(3);155–168.
3. Binbin Xia, Yali Li, Yatong Zhang, Ming Xue, Xiaorong Li, Pingxiang Xu, Tao Xia, Shicai Chena, UHPLC-MS/MS method for determination of atorvastatin calcium in human plasma: Application to a pharmacokinetic study based on healthy volunteers with specific genotype Journal of Pharmaceutical and Biomedical Analysis, 2018; 160(25); 428-435.
4. Mohammed M. Amin, Salah A. Abdel-Aziz,Samia M. Mostafa and Sobhy M. El-Adl, Optimization and Validation of HPLC Method for Simultaneous Determination of Vildagliptin, Pioglitazone Hydrochloride and Glimepiride in Bulk and Tablets, IOSR Journal of Pharmacy and Biological Sciences, 2017;12(2);18-27.
5. Shruti Surendran, David Paul, Ratna Sushmita, Lavanya Krishna, Nirbhay Kumar Tiwari, Sanjeev Giri, Nanjappan Satheeshkumar, A validated LC–MS/MS method for the estimation of glimepiride and pitavastatin in rat plasma: Application to drug interaction studies, Journal of Chromatography B, 2017;1046(1);218-225.
6. Pradnya N. Vaingankar and Purnima D. Amin, Development and Validation of Stability-Indicating RP-HPLC Method for Simultaneous Determination of Metformin HCl and Glimepiride in Fixed-Dose Combination, Insights, 2016; 11; 13–20.
7. Kinnari K. Patel, Vaishali V. Karkhanis and Mrs. Shital S. Gajjar, Development and validation of stability indicating HPTLC method for estimation of glimepiride and metformin hydrochloride International Journal of Pharmaceutical Sciences and Research, 2015; 6(3);1222-1229.
8. Kakade Vrushali B, Lobhe G.A., Gandhat Snehal G., Dhobale S. M., Patel Salim G, Estimation of Metformin Hydrochloride in Bulk and Formulation by UV - Spectroscopic Area Under Curve Method, Journal of Drug Delivery & Therapeutics, 2019; 9(3);163-167.
9. Regalla MR, Ravindranath TD, Method development and validation for simultaneous estimation of metformin, glimepiride and atorvastatin in combined tablet dosage form by UPLC, World journal of pharmacy and pharmaceutical sciences, 2013;2(6):5229-5247.
10. Devi Ramesh and Mohammad Habibuddin, Stability Indicating RP-HPLC Method for the Simultaneous Determination of Atorvastatin Calcium, Metformin Hydrochloride, and Glimepiride in Bulk and Combined Tablet Dosage Form, International Scholarly Research Notices,2014; Article ID 754695; 8.