520
A Hybrid Approach To Evaluate Stock Returns
Using Data Mining Techniques
Sweta Bhattacharya, Rajeswari C, Saugata DeAbstract: The key to success in the field of stock trading depends on the ability of buying and selling stocks at the correct time where decision making skills and predictions play a major role. The objective is to “Sell high and buy low” which sounds easy but is difficult to achieve and errors in assumption can lead to extensive loss of money. Data mining is a popularly used technique which has helped to resolve decision making issues in this field this increasing accuracy in accuracy of predictions in stock trading. In this paper, a comparative analysis of the use of various classification algorithms namely SVM, Naïve Bayes classifier, CART and LAD are explored which have been a popular choice of algorithms in stock exchange data. Finally, a hybrid model is developed considering the pros and cons of Naïve Bayes classifier and SVM algorithm which has been successful in producing enhances accuracy in comparison to the existing approaches.
Index Terms: Classification; Data mining; Feature Selection; Stock return forecasting
I.
INTRODUCTION
In the past decade a lot of work has taken place on the financial domain. In the vast area of the financial domain, stock market is considered to have played most influential and powerful role, since it has its great impact on the country‟s economic condition too. The stock market is undoubtedly a non parametric as well as non linear system [9] which is very hard to provide with exact accuracy. Forecasting stock index is considered to be one of the most popular areas in the financial domain which has attracted researcher‟s attention. It basically takes the past historical data into concern and based on such data‟s, it predicts possible output. The objective of the work is to help the individual investors, stock market traders as well as fund managers in taking accurate decisions. The researchers believe that the fundamental analysis of stock price basically depends on two factors; one is its intrinsic value while the other is return on investment. However according to the hypothesis of market [3] all such attempts at prediction are futile as all such information that could affect the behaviour of stock price or market index must have been already incorporated into current market quotation. There are certain challenges in the work which includes the external factors such as political events or political decisions which are also responsible for the rise and fall of stock price. Hence our aim is to build a model which will be able to provide as much accuracy as possible. Ample amount of research work is done on these filed and certain research used the technical analysis technique [8] in which trading rules were developed based on the historical data of stock trading price and volume. Apart from that Sentimental analysis as stated in [4][11] makes use of [17] text mining, natural language processing (NLP), in order to identify and extract the subjective content by analysing user‟s opinion, evaluation, sentiments, attitudes and emotions. Thus it evaluates the statements of the user‟s based on two parameters namely positive and negative. Recently data mining techniques along with artificial neural network have also been applied [7]. [14] Applying neural networks related approaches in the literature; the decision tree approach is able to provide the explicit classification rules. [15] Classifications are made in terms of input data, forecasting methodology, performance evaluation, and performance measures used. Data mining [5] is the extraction of hidden predictive information from large databases. [5][10] It finds patterns or correlations or relationships in data by using sophisticated techniques for [2]
[16] future stock market investment portfolio. [6] Results show that K means cluster analysis builds the most compact clusters as compared to SOM and Fuzzy C-means for stock classification data. In our research work we plan to develop a hybrid model which will help the investors to decide the correct time of buying and selling stocks thereby reducing the risk of having loss. The paper states a novel approach combining two [18] supervised learning algorithms to predict stock returns using data mining techniques. In order to predict return variables accurately, we need to find out the effective factors. The metrics used here to evaluate the hybrid model are [12][13] Accuracy, Sensitivity, Specificity as well as Kappa. One of the most important issue of stock prediction [1] lies on how to select representative features for prediction. In our research, we have worked with the classification methods. [8] Analysing stock price data over several years involves hundreds, thousands of records but these must be selected from millions. Thus to illustrate the approach and to train data as well as to test, we apply it on the dataset of S&P 500 Index (2001-2005) taken from Yahoo Finance.
II.
RESEARCH METHODOLOGY
The paper contributes to the work of predicting the stock price returns for the investors. The techniques which we will be using to implement our model are the data mining techniques. Our work initially is considered to go through three phases:
A. Data Preparation
In order to predict stock returns, we will be working on the dataset of S&P 500 Index (2001-2005). The attributes for the dataset which needs to be considered are Stock opening Price, Stock highest price of the day, Stock lowest price of the day, Closing Stock price, Volume, Adj. Close. Initially all these attributes will hold numeric value. After confirming the attributes, data transformation will be applied on them to convert the numeric values into discrete value based on the closing stock price of previous day. There will be basically two types of discrete values i.e. UP and DOWN based on which action will be taken as shown in Table 1.
Date Open High Low Close Volume AdjClose
521 2018 1258.17 1260.6 1254.18 1254.42 1382540K 1254.42
2018 1256.54 1261.1 1256.54 1258.17 1422360K 1258.17
2018 1268.66 1271.8 1256.54 1256.54 1540470K 1256.54
2018 1268.12 1260.8 1265.92 1268.66 1285810K 1268.66
2018 1262.79 1268.2 1262.5 1268.12 1888500K 1268.12
2018 1259.62 1269.4 1259.62 1262.79 2065170K 1262.79
2018 1259.92 1263.9 1257.21 1259.62 1996690K 1259.62
2018 1267.32 1270.5 1259.28 1259.92 2208810K 1259.92
Table 1: Primary Dataset
B. Data Pre-Processing
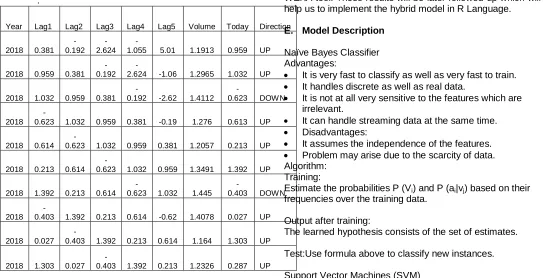
The above primary dataset is being pre processed taking into consideration another one important attribute i.e. „Today‟. The „Today‟ attribute is basically a calculation of the above mentioned five attributes namely high, low, open, close and volume. The „today‟ attribute is the main attribute based on which the decisions are being taken i.e. the direction in which the stock market is moving. The „Direction‟ attribute basically holds two values i.e. „UP‟ and “DOWN‟. If the value of the “Today‟ attribute is higher than yesterday‟s „Today‟ value, then the direction is set as „UP‟ and if less than yesterday‟s „Today‟ attribute then it is set as „DOWN‟ as shown in Table 2.
.
Year Lag1 Lag2 Lag3 Lag4 Lag5 Volume Today Direction
2018 0.381 -0.192
-2.624
-1.055 5.01 1.1913 0.959 UP
2018 0.959 0.381 -0.192
-2.624 -1.06 1.2965 1.032 UP
2018 1.032 0.959 0.381
-0.192 -2.62 1.4112
-0.623 DOWN
2018
-0.623 1.032 0.959 0.381 -0.19 1.276 0.613 UP
2018 0.614
-0.623 1.032 0.959 0.381 1.2057 0.213 UP
2018 0.213 0.614
-0.623 1.032 0.959 1.3491 1.392 UP
2018 1.392 0.213 0.614
-0.623 1.032 1.445
-0.403 DOWN
2018
-0.403 1.392 0.213 0.614 -0.62 1.4078 0.027 UP
2018 0.027
-0.403 1.392 0.213 0.614 1.164 1.303 UP
2018 1.303 0.027
-0.403 1.392 0.213 1.2326 0.287 UP
Table 2: Pre-processed Dataset
C. Feature Selection
Feature Selection is now considered to be the most popular and is widely used in different areas of research for which the datasets is available with thousands of variables. The research domain includes combinatorial chemistry, text processing of various documents available in the internet and gene expression analysis of array. The prime aim of the feature selection is to improve the performance of the prediction and providing more cost beneficial predictors which are quite faster. The feature selection includes a variety range of aspects of the problems like multivariate feature selection as well as feature construction along with the feature ranking. This research work includes the concept of feature selection for increasing the prediction performance there by increasing the accuracy value. The figure includes all the attributes in the dataset which are ranked according to their feature ranking in the decreasing order of their importance. It basically eliminates the unwanted attributes which may reduce the prediction performance. In case of our research work, it asks us to eliminate the „Year‟ or „Lag3‟ or both attribute which has nothing to do with the further procedure.
D. Model Building
After the preparation of the data properly, the followed up step will be to build a classification model using various data mining algorithms. The algorithms taken into concern are Naive Bayes Classifier, CART, LDA and SVM. The decision tree method basically relies on the information gain which further relies on entropy measure. So the attributes will be basically ranked based on gain ratio. The decision trees for the mentioned algorithms will be prepared and based on the results; two algorithms will be chosen which provides us with the best accuracy. These will be initially done using the WEKA tool. These results will be later followed up which will help us to implement the hybrid model in R Language.
E. Model Description
Naïve Bayes Classifier Advantages:
It is very fast to classify as well as very fast to train.
It handles discrete as well as real data.
It is not at all very sensitive to the features which are irrelevant.
It can handle streaming data at the same time.
Disadvantages:
It assumes the independence of the features.
Problem may arise due to the scarcity of data. Algorithm:
Training:
Estimate the probabilities P (Vi) and P (ai|vj) based on their
frequencies over the training data.
Output after training:
The learned hypothesis consists of the set of estimates.
Test:Use formula above to classify new instances.
Support Vector Machines (SVM) Advantages:
522
SVM has a regularization parameter and hence less over fitting.
SVM is very much robust to noise.
SVM uses Kernel trick which can help to make an expert knowledge related to the problem there by engineering the Kernel
Disadvantages:
SVM is said to be a binary classifier and hence to implement a multi class classification, pair wise classification can be taken into consideration.
SVM is computationally very expensive and hence in turn it runs quite slow.
SVM does not produce good results when the data set has a high noise.
SVM does not produce us with the probability estimates, rather we have to calculate it using cross validation.
Algorithm:
Step 1. Normalize the data A = χ ˗ μ/σ
Where μ = ∑ χ / n, σ = √1/n-1 x ∑(xi ₋ μ)
Step 2. Compute Augmented Matrix [A – e]
Step 3. Compute H = D [A – e] and HT
H
Step 4. Compute U = V X [1 – H[1/V + HTH]-1 HT] x e
Step 5. Compute w = ATDU and γ = -eT
DU
Step 6. Compute wTx – γStep 7. Compare the sign (wTx – γ) with input class label
Classification & Regression Tree (CART)
Advantages:
It is nonparametric.
It discovers the interactions among the variables which is good for rule search.
Variable selection is performed automatically.
Missing values are also handled automatically. Disadvantages:
It basically performs a very poor job of modeling the linear structure.
It may need a large tree to get an improved lift which will rather be hard to interpret and data as well gets thinner with every split.
It is not a continuous score but rather a step function and hence it can take only ten possible values from a tree having ten nodes.
Instability of model structures Algorithm:
Step 1: The rules which are responsible for splitting the data at one node depends on the variable value of one
Step 2: Rules for stooping must be there in order to decide that when a branch reaches its end i.e. terminal and cannot be split anymore.
Step 3: Lastly, a prediction needs to be done at each terminal node for the target variable.
Logistical Analysis of Data (LAD) Advantages:
It is more robust
It does not assume a linear relationship between the IV and DV.
There exists no homogeneity of various assumptions.
It may handle nonlinear effects.
Disadvantages:
It may have multi collinearity.
It may over fit the data.
It may miss the chance to find important relationship.
It requires large sample size to achieve stable results.
Algorithm:
Step 1: It builds a classifier which is basically based on the learning of a logical expression for the binary target variable which would be able to distinguish between the positive as well as the negative values in a dataset.
Step 2: Involves large set patterns which then select the subsets and then satisfies the assumption such that every pattern matches certain criteria in terms of prevalence as well as homogeneity.
Hybrid Algorithm:
The hybrid algorithm which has been implemented is basically a hybrid of two data mining algorithms namely Support Vector Machines & Naïve Bayes Classifier. The two algorithms have been combined to get better results in terms of Accuracy as well as Kappa and several other parameters like Precision, Recall, and F-Measure.
Accuracy = (TP+TN)/N (1)
Precision = TP / (TP+FP) (2)
Recall = TP / (TP + FN) (3)
F-Measure = (2 * Precision * Recall)/(Precision + Recall) (4)
where, TP = True Positive, TN = True Negative,
FP = False Positive, FN = False Negative, N = no. of instances
Algorithm:
Step 1: In this step, the data is being taken and prepared.
Step 2: Data is then pre-processed thereby converting the numerical value to discrete value.
Step 3: After pre processing the data, Feature Selection is being applied on the data set to come up with the main attributes.
Step 4: Unimportant attributes are being eliminated from the dataset and then hybrid SVM algorithm is being run on the dataset.
Step 5: SVM initially does the percentage split of the dataset containing more than 1000 rows of values to 80% and 20%.
Step 6: Percentage split will be followed up by 10 fold Cross Validation.
Step 7: Upon successful completion, hybrid Naive Bayes classifier will be applied on the resultant dataset of the hybrid SVM to produce better results.
523
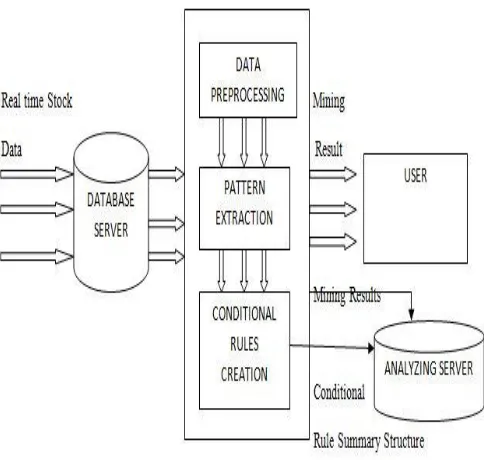
Figure1: System Architecture
III.
RESULTS AND DISCUSSIONS
The relate works in this research area includes raw cost of the securities as the prime and important feature while modelling. But the fact is that the raw cost should never e used to find out the manipulation in the market. The stock price is neither associate with the revenue nor the company size rather it is being suggested by us to use the stock price return 𝑅!=(𝑃t−𝑃t-1)/𝑃t-1 or log(𝑃t/Pt-1) where Rt and Pt
represent return and price of the security at time t respectively.
The supervised learning algorithms are being used here to predict the stock price returns. The section includes the results of the hybrid approach in terms of Accuracy, Kappa, Sensitivity, Specificity, Prevalence and Detection Rate. Initially after the completion of the first phase i.e. after running our hybrid SVM on the dataset, the result obtained are as shown below in Figure 2:
Figure 2: Hybrd SVM Results
Now it can clearly be observed that the Accuracy percentage is 94.38% and the Kappa is 88.71% in case of our stock market dataset after applying Hybrid SVM. Now we have stored the resultant dataset in the backend, upon which the hybrid Naïve Bayes Classifier algorithm will be applied in order to get better results. The result of the Second phase is as shown below in Figure 3.
Figure 3: Hybrid Naive Bayes Classifier Results
The result obtained after applying Hybrid Naive Bayes Classifier on Hybrid SVM is 95.58% in terms of Accuracy and 91.14% in terms of Kappa. The result obtained can be further better if we apply the concept of Feature Selection. Applying feature selection and elimination the „Lag3‟ unwanted attribute from our dataset will give us improved performance prediction. The result after doing feature Selection and applying it on Hybrid SVM is as shown below in Figure 4.
Figure 4: Hybrd SVM Results applying Feaure Selection
524
the back-end will this providing the final result shown in Figure 5.
Figure 5: Hybrid Naive Bayes Classifier Results applying Feaure Selection
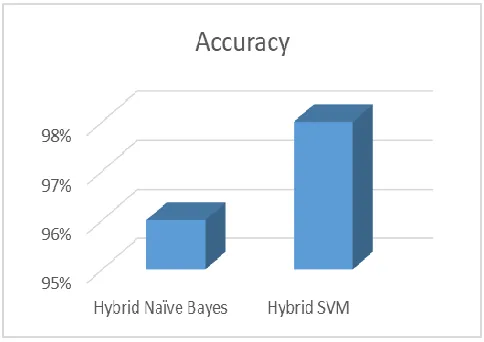
The final obtained result is 97.99% in terms of Accuracy and 95.58% in terms of Kappa which is far superior compared to the results provided individually by the existing algorithms.
Performance Measure
Accuracy is the performance measure considered for this proposed work. Accuracy is derived from the confusion matrix as shown in Table 3 and Table 4 and the comparative accuracy of the models is shown in Table 5 and Figure 2. Accuracy = No. of samples correctly classified in test data/
Total no. of samples in test data
Table 3: Confusion matrix for Hybrid Naïve Bayes Classifier
Table 4: Confusion matrix for Hybrid SVM Classifier
Table 5: Comparative Accuracy of the Hybrid Models
Figure 2. Accuracy comparison
I.
CONCLUSION
Prediction of Stock market is one of the most challenging works because of its complex and undefined nature. The prediction of the movement of the stock price i.e. in which way it is going whether „UP‟ or „DOWN‟ may produce good benefits to the financial traders. There are several “UP‟ and „DOWN‟ going on in the Indian Stock Market. Hence the financial traders need the help of some technology which will help them to avoid losses and gain more and more profits.In this paper, we have shown an hybrid approach to evaluate stock returns using data mining techniques like the supervised learning algorithms. Our approach helps the financial traders to predict the stock returns. The above study attempted to predict the movement of stock price in the S&P 500 Index daily data. Hybrid supervised learning algorithms comprising of both SVM as well as Naive Bayes Classifier are being applied on the daily dataset of S&P 500 Index to measure the prediction performance. It includes the class values as “UP‟ or „DOWN‟ as per „Todays‟ attribute value in the dataset which is being calculated based on the prices of the stock. It clearly signifies that the hybrid algorithm is capable of predicting the movement of the market (with an accuracy of 97.99%) which surely is much better than the results of the existing individual supervised machine learning algorithms.
REFERENCES
[1] Sasan Barak, Mohammad Modarres “Developing an Approach to Evaluate Stocks by Forecasting Effective Features with Data Mining Methods” Expert System with Applications 42(2012), 1325-1339
[2] Preeti Paranjape Voditel, Umesh Deshpande “A Stock Market Portfolio Recommender System Based on Association Rule mining” Applied Soft Computing 13(2013) 1055-1063
[3] Binoy.B.Nair, V.P Mohandas, N.R. Sakthivel “A Desion Tree Rough Set Hybrid System for Stock Market Trend Prediction” International Journal of Computer Applications(0975-8887) Volume: 6, 9 September 2010
[4] Aditya Bhardwaj, Yogendra Narayan, Vanraj, Pawan, Maitreyee Dutta “Sentiment Analysis for Indian Stock Market Prediction Using Sensex and Nifty” Procedia Computer Science 70(2015), 85-91
Down Up
Down 112 3
Up 8 126
Down Up
Down 116 1
Up 4 126
Model Accuracy
Hybrid Naïve Bayes 96%
525
[5] D. Venugopal Setty, T.M Rangaswamy, K.N. Subramanya “A Review on Data Mining Applications to the Performance of Stock Marketing” International Journal of Computer Applications(0975-8887) Volume: 1, 2010
[6] S.R. Nanda, B. Mahanty, M.K. Tiwari “Clustering Indian Stock Market Data for Portfolio Management” Expert System with Applications 37(2010), 8793-8799
[7] David Enke, Suprahan Thawornwong “The use of Data Ming and Neural Network for Forecasting Stock Market Returns” Expert System with Applications 29(2005), 927-940
[8] Qasem A. Al-Radaideh, Adel Abu Assaf, Eman Alnagi “Predicting Stock Prices using Data Mining Techniques” The International Arab Conference on Information Technology, 2013
[9] Sadegh Bafandeh Imandoust, Mohammad
Bolandraftar “Forecasting the direction of stock market index movement using three data mining techniques: the case of Tehran Stock exchange” International Journal of Engineering Research and Applications(2248-9622), Vol. 4, Issue 6(Version 2), June 2014, pp.106-117
[10]Dietmar H.Dorr, Anne M. Denton “Establishing relationships among patterns in stock market data” Data & Knowledge Engineering 68(2009), 318-337 [11]Nuno Oliveira, Paulo Cortez, Nelson Areal “Stock
market sentiment lexicon acquisition using microblogging data and statistical measures” Decision Support Systems 85(2016) 62-73
[12]Asil Oztekin, Recep Kizilaslan, Steven Freund, Ali Iseri “A data analutic approach to forecast daily stock returns in an emerging market” European Journal of Operational Research 253(2016), 697-710
[13]Chi-Chen Lin, An-An chiu, Shaiyo Yan Huang, David C. Yen “Detecting the financial statement fraud: The analysis of the differences between data mining techniques and expert‟s jidgements” Knowledge Based Systems 89 (2015), 459-470 [14]Chi-Lin Tu, Ta-Cheng Chen “A study of applying
data mining approach to the information disclosure for Taiwan‟s stock market investors” Experts System with Applications 36(2009) 3536-3542
[15]George S Atsalakis, Kimon P Valavanis “Surveying Stock market forecasting techniques” Expert System with Applications 36(2009) 5932-5941
[16]Shu Hsien Laio, Shan Yuan Chou “Data mining investigation or co-movements on the Taiwan and China Stock market for future investment portfolio” Expert System with Applications 40(2013) 1542-1554
[17]Arman Khadjeh Nassirtousi, Saeed Aghabozorgi, Te Ying Wah, David chek Ling Ngo “Text mining for market prediction: A systematic review” Expert System with Applications 41(2014) 7653-7670 [18]Koosha Golmohammadi, Osmar R. Zaiane, David
Diaz “Detecting stock market manipulation using
Supervised Learning Algorithms”