Research article
Available online www.ijsrr.org ISSN: 2279–0543
International Journal of Scientific Research and Reviews
Multilevel Thresholding for Video Segmentation Using Cuckoo Search
Algorithm
Durga R.*
1and Yamuna G.
21Department of ECE, Annamalai University, Tamil Nadu,India
Email: [email protected], Mobile: +91 97872 13522
2
Department of ECE, Annamalai University, Tamil Nadu,India Email: [email protected], Mobile: +91 98423 99987
ABSTRACT
Nowadays Video Segmentation plays crucial role in the Image Processing domain. A new multilevel thresholding based color video segmentation approach using an objective function named Kapur’s entropy. In this paper, segmentation process incorporates two types of cues, i.e., inter-frame consistency, and a cross-video similarity into an optimization using Cuckoo Search (CS) algorithm and motion model, and it does not require objects to be visible in all frames. The Motion Pixel Expectation Maximization (MPEM) and a spatio-temporal Scale-Invariant Feature Transform (SIFT) flow descriptor is introduced to detect the motion pixels and to reduce the probability of disruption by occlusion, clutter, or noise. The spatio-temporal SIFT flow originates reliable estimation of common foregrounds over the entire video dataset. In this paper, Cuckoo Search (CS) optimization algorithm with different parameter analysis has been used for solving the color video multilevel thresholding problem. For this method, CS algorithm is achieved the best solution as fitness function using Kapur’s entropy for optimal multilevel thresholding. Segmentation results show that the proposed CS-Kapur’s segmentation provides best segmentation results.
KEYWORDS:
Video Segmentation, Optimization, Cuckoo Search algorithm, Scale-Invariant Feature Transform (SIFT), Motion Pixel Expectation Maximization (MPEM)*Corresponding Author:
R. Durga
Assistant Professor, Department of ECE, Annamalai University,
Annamalai Nagar – 608 002, Tamil Nadu,India
INTRODUCTION
The image segmentation plays a vital role in digital image processing. The combination of a finite
number of elements, each of which has a particular location and values is known as a digital image.
and these elements are called image elements. The term pixel is most widely used to denote the
elements/components of a digital image. Advantage of Digital Image Processing,
It allows a wide range of algorithms to be applied to the input data.
It avoids noise and signal distortion problems.
Video segmentation has been a key technique for semantic object extraction and plays an
important role in digital video processing, pattern recognition, and computer vision. The task of
segmenting/tracking a video object emerges in many applications, such as bank transactions
monitoring, surveillance and video conferencing.
Image Segmentation1 is defined as the process of partitioning or subdividing an image into its constituent region or objects (homogeneous region like color, contour, etc.). In case of color video
multilevel thresholding, 3 color bands such as red, green, and blue frames has been considered to
obtain the segmented color videos. Thresholding plays a very effective and notable role in the field
of segmentation. The most leading problem in thresholding based approach is to select the
appropriate (best) threshold value. Thus, many entropy based thresholding techniques have been
developed.
R
ELATEDW
ORKAt present days, many researchers had done work towards video segmentation, and motion
detection scheme. The entropy based segmentation is widely adopted by the research in the
multilevel thresholding technique. The following paragraphs given the brief survey of literatures
based on segmentation techniques,
S. Pare et al.2, described the color image segmentation technique based on a cuckoo search algorithm and energy curve. They compared two algorithm named Cuckoo Search algorithm (CS)
and Egg Laying Radius Cuckoo Search (ELR-CS) algorithm. They applied the CS algorithm using
Levy based Kapur’s entropy to obtain optimal thresholding values and to improve the accuracy of an
image. The energy function method was introduced to extract the Red, Blue, Green channel color
space in a curve model. They compared three well known objective functions named Kapur’s
entropy, between class-variance, Tsalli’s entropy. Kapur’s entropy gives more accuracy, PSNR
in this method, i.e. 3, 5, and 8 levels of threading. The Author of this method proved that the
performance of CS algorithm is more efficient than the ELR-CS method.
Ashish Kumar Bhandari et al.3 described the Cuckoo Search and Wind Driven Optimization algorithm (WDO) using satellite image segmentation. They applied these two algorithms (CS and
WDO algorithms) for multilevel thresholding using Kapur’s entropy by selecting best optimal
threshold values. These algorithms used to obtain the best solution or best fitness value of the initial
random threshold value. They also measured the quality factors such as accuracy, PSNR value,
SSIM, and FSIM values.
Mohamed Abdel Baset et al.4 used the Cuckoo Search (CS) and Genetic Algorithm (GA) for optimization problems. The authors proposed the collaborative combination of two algorithms (like
CS-GA and GA-CS). They validated these algorithms by using 15 benchmark mathematical
functions. In their method, they explained the two algorithms, the CS and GA are more accurate,
reliable and efficient at finding a global optimal solution than the other algorithms.
K. Suresh Manic et al.5, described the multi-thresholding for image segmentation based on Kapur’s and Tsalli’s entropy. The multi-thresholding is applied for grayscale images (named test
images) using Firefly Algorithm (FA) and Kapur’s/Tsalli’s entropy function. The authors used this
algorithm to discover the optimal threshold value. The Kapur’s entropy estimated the better quality
of an image and Tsalli’s entropy reduced the CPU timing.
Peng Yeng Yin6 described the Minimum Cross Entropy Threshold (MCET) selection method and particle swarm optimization method. The particle swarm optimization was used to derive multiple
MCET. They introduced the MCET in bi-level thresholding case. The main drawback of the MCET
is it could be very time consuming in the multilevel thresholding (for a complex image).
Erik Cuevas et al.7 presented a multi-threshold segmentation based on the Artificial Bee Colony (ABC). The ABC algorithm assumed the existence of a set of operations that may resemble some
features of the honey bee behavior. For instance, each solution within the search space comprises a
parameter set representing food source locations. They produced the fitness value, that is refers to the
food source quality. The process mimics the bee’s search for valuable food sources yielding an
analogous process for finding the optimal solution. The ABC-based method shows fast convergence
and low sensitivity to initial conditions. It also improved the complex time consuming computations
that required by gradient-based methods. But the drawback of this algorithm is time consuming when
compared to Cuckoo Search algorithm.
M. Mary Synthuja Jain Preetha et al.8 described the region based segmentation using a Cuckoo Search algorithm. In that, the initial seeds are selected using histogram analysis and regions are
growing was optimized by using a cuckoo search algorithm. NPR (Normalized Probabilistic Rand
Index), GCE (Global Consistency Error) and VOI (Variation of Information) are calculated to find
the ground truth images, consistency error, information loss and information gain respectively.
From the above mentioned literature survey, it is proved that the CS algorithm performs better than
the other optimization techniques for segmentation scheme. Many of them introduced a CS algorithm
for image segmentation whereas in this paper, we proposed a CS algorithm for video segmentation
scheme.
METHODOLOGY
Video Segmentation
The video segmentation refers to decomposing a video data into meaningful elementary parts. The
result of video segmentation is a set of segments that collectively cover the real entire video data.
Video segmentation plays an important role in the video processing. Video Segmentation
decomposes image frames into background and foreground.
Figure1. Basic Block Diagram of Video Segmentation
Video segmentation is considered as a clustering process that classifies one video succession into
several objects/ frames.
Cuckoo Search Algorithm
In the proposed method, the segmentation task is combined with an optimization technique; video
segmentation based on the Cuckoo Search algorithm is applied. Cuckoo Search Algorithm is based
on the brood parasitism of some cuckoo species The CS algorithm is improved by using Levy flights,
rather than by using plain isotropic random walks. The Cuckoo Search algorithm was motivated by Input
Video Pre-Processing
Estimate the Intensity
Difference
Segmentation
Process
Fix the
Threshold Level
Frame Change
Detection
Segmented
the cuckoo species (some of them laying their eggs in the host bird’s nest). Some of the cuckoos
have evolved in a way that, the female parasitic cuckoos can have some similarities in colors and
patterns on the eggs of a few chosen host species. This reduces the probability of the eggs being
abandoned by the host birds and, it increases their re-production of new ones. The several host birds
engage direct conflict with intruding cuckoos.
The first impressions about the cuckoos are their beautiful tone. But independently of their sound,
they have a spectacular intrusion reproductive strategy. This is known as brood parasitism. The
brood parasitism of cuckoo bird is of two types: non-obligatory and obligatory. Cuckoo lays eggs in
the nest of co-specifics (i.e., same species), is then on-obligatory brood parasitism. Examples: Bank
Swallows, African Weavers. The cuckoos lay eggs in the nest of hetero-specifies, and do not require
building the nest of their own and protects the eggs, this is in obligatory brood parasitism. Examples:
Brown-Headed Cowbirds and European Cuckoos. There are different types of brood parasitism, they
are: intra specific brood parasitism, cooperative breeding, and nest takeover.
For simplicity in describing the cuckoo search, consider the following three idealized rules:
(1) Each cuckoo sets one egg at a time and dumps its egg in the randomly chosen nest
(2) The best nests with high quality of eggs will carry-over to the next generations
(3) The number of available host nests is fixed and if the egg laid by a cuckoo is discovered by the
host bird, then the host bird will abandon the nest or built a new nest.
Based on the above mentioned rules, basic steps of cuckoo algorithm are:
Step 1:Set the number of nests. In this problem, it is taken as 20. Set the discovery rate (probability)
and the stopping criteria,which are either fixed number of iterations. Set dimension of the
problem, the number of dimensions is the threshold level (here such as 5).
Step 2: Randomly initializes the solution (nest) by generating n different nest for acquiring n
different solutions.
Step 3: Evaluate fitness for each of the obtained solutions and find the best nest corresponding to
objective function criterion.
Step 4: Start iterations, generate a new nest by Levy flight, but keep the current best nest. A Levy
flight is performed through Eq. (1).
For generating new solution, a Levy flight is performed as (1), xi (t+1) for cuckoo i.
where, α > 0 is the step size, which is related to the scales of the problem of interests. In most
cases, we can use ˛α = 1. The product⊕ deals with entry-wise multiplication process, where,
represents a scaling parameter. In this problem, is selected in the range between 1 <
the Levydistribution, which has an infinite variance with an infinite mean. Levy distribution
is given by Eq. (2). Levy flights offers random walk whereas their random step lengths are
taken from the Levy distribution for large steps given by, (2)
(1)
Levy () = t where 1 < ≤ 3 (2)
Step 5: Evaluate (eq. (1) and (2)) set of solutions and obtain the new fitness value. Compare the old
fitness with this new fitness and replace old fitness; if a new fitness value is better than the
old one, update the best nest corresponding to fitness (updating the membership matrix).
Step 6: Repeat the above steps until stopping criteria is achieved (by giving the best fitness and
corresponding best nest). According to application, Levy flight can be modified. Levy flight
has an infinite variance with an infinite mean. The variance of Levy flight can be expressed
as,
where, 1 ≤ β ≤ 2 (3)
Here, the CS algorithm is used to determine the global optimal threshold value. The main advantage
of the Cuckoo Search algorithm is that, it reduces the computational time. In this proposed method,
different videos are taken as the input videos. The input video is processed and displayed. Then, the
short length video is converted into frames and the intensity variation of the each frame is estimated.
The Cuckoo Search algorithm initialization is started by applying a 5th level thresholding to each frame and the thresholding values are discovered in the upper and lower bound segmentation.
Thresholding value varies from 0.1 and above, that depends on the videos. The motion pixel in the
videos is discovered by the Motion Pixel Expectation Maximization (MPEM) algorithm. By using
Levy flights, the step size, current place and transition probability of the next state is estimated. )
( Lévy )
( ) 1 (
t
i t
i X
X
2 2
-t ~ )
Figure2. Flowchart of Cuckoo Search Algorithm
The overall flowchart of the proposed method is given in Fig.2 and the overall block diagram of
the proposed method is given in Fig.3.
Figure3. Block Diagram of Proposed Method Initialization Random Initial Solution
Get the Current Best Nest START
While (fmin > fmax)
Generation
Get the Cuckoo value by Random Walk
Evaluate the Quality Fitness and find the Current Best Nest
STOP
Levy Flights
Video Acquisition Video to Frame Conversion
Estimate the Intensity difference between
Frames
Motion Pixel Estimation
Lower and Upper Bound Segmentation
Cuckoo Search Initialization Map New Nest
using Levy Flights
Feature Extraction using SIFT
Descriptor
Single Map Segmentation using
Cuckoo Search
Segmented Output Object Partitioning Object
Refinement
Estimate Accuracy Input
SIFT algorithm is used to extract the local features (foreground object shape). This algorithm only
maps the moving object from the video. Single mapping process, that will only extract the
foreground object edge points. Then the object refinement process is applied to eliminate the
unnecessary pixels from a frame. If the refinement process is satisfied, then the object partitioning
process will perform. If it’s not satisfied, then it performs the Cuckoo Search initialization process
again until the refinement process satisfied. Then the object is partitioned, an accurate object is
obtained at the output. After that the accuracy is calculated from the confusion matrix.
EXPERIMENTAL RESULTS
This section describes the simulation results. In this proposed method, Levy flights which are used
in the CS algorithm have been exploited for multilevel thresholding. In this method, threshold levels
(m): 3, 5, and 8 level thresholding have been found for the purpose of multilevel thresholding,
fidelity assessment, and for visual perception. For all the considered images, the population size (or
total number of iterations) of the CS algorithm have been varied. A significant benefit of this
algorithm is its easiness. In CS algorithm, discovery rate has been varied at 0.25, and 0.5, where the
value of pa= 0.25 gave superior results. The number of repeats has been 10 times while simulating
the results. The best of 10 times is selected as the optimum value for segmentation. The total length
of the videos is 3 secs only. Because increasing the video length, increases the computational time.
Then the video is converted into frames.
Four different videos such as Giraffe, Horse Riding, Car, Parrot are used for video segmentation
method is shown in figure 4. For CS algorithm, the number of iteration steps obtained for the
objective function is shown in figure 5.
(a) (b) (c) (d)
(a) (b)
(c) (d)
Figure5. Graphical Representation of Iteration Steps for CS Objective Function (a) Giraffe (b) Horse Riding (c) Car and (d) Parrot
(a)
(b)
(c)
Figure6. (a) Input Sequences, (b) Object Refinement, (c) Multi-Class Video Co-Segmentation for Giraffe Video
(b)
(c)
Figure7. (a) Input Sequences, (b) Object Refinement, (c) Multi-Class Video Co-Segmentation for Horse Video
(a)
(b)
(c)
Figure8. (a) Input Sequences, (b) Object Refinement, (c) Multi-Class Video Co-Segmentation for Car Video
(a)
(b)
(c)
The figure 6, 7,8 and 9 shows the input sequence of the Giraffe, Horse Riding, Car, Parrot videos,
refinement process is used to extract the foreground and background information. And then
Multi-class video co-segmentation is applied to addresses the multiple object Multi-classes across multiple video
data's. First, the 1st frame is considered as a reference frame. Figure 9 shows the segmentation process of the frame. Then CS Kapur’s entropy is applied to segment the frames by using 5 level
thresholding. The moving pixel from the video is detected by using MPEM algorithm. After
detecting the motion pixels, the foreground object is extracted in order to focus the main moving
object. The intensity variation of the object is observed and then improving the intensity of each
frame by the CS algorithm.
Figure10. Segmentation process of Four Different Videos Such as Giraffe, Horse Riding, Car, Parrot
The video object co-segmentation process is used to segment the common foreground object under
similar background. The SIFT flow descriptor is applied to reduce unnecessary pixels present in the
frames. After applying the SIFT algorithm, single mapping segmentation is applied to obtain the
edge surface of the foreground object. In this proposed method, three different algorithms used to
Input Frame with Object
Cuckoo Kapur Segmentatio
n
Motion Pixel Estimation using MPEM
Intensity Variation of
Object
Video Segmentation using Cuckoo
Search Algorithm
Video Object
Co-Segmentatio
n
Visualization of Cuckoo Search with
SIFT Flow
Single Mapping
Process
Final Accurate
obtain accurate final video. The accuracy and PSNR values are calculated from the final optimized
output. This technique is straight forward models, which can be merely applied to any type of
optimization problem. The CS algorithm controls the boundary conditions in every computation step.
The Levy flights algorithm is more efficient method of discovering the search space.
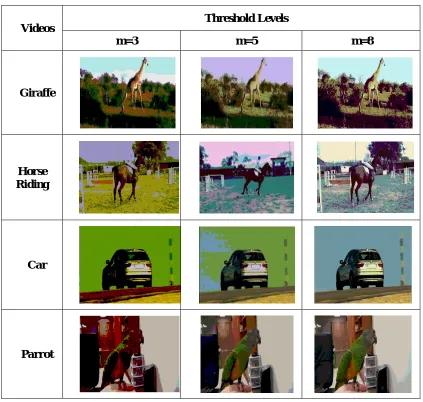
The proposed technique is used to determine the multiple threshold levels (m). The three different
level of thresholds are compared in the Table I is shown below, three threshold levels i.e. m = 3, 5, 8
levels are tested. From this tabulation, the 5th level of threshold gives more accurate results than the other threshold levels.
Table I: Comparison of Four Videos for Multiple Threshold Levels (m)
Videos Threshold Levels
m=3 m=5 m=8
Giraffe
Horse Riding
Car
Parrot
In this experimental section, different well known image processing metrics such as PSNR, MSE,
structural-similarity index (SSIM), and feature similarity index metrics (FSIM) have been used.
PSNR and MSE directly depend on the image intensity values, and usually indicate the strength and
accuracy of final reconstructed signal or image. On the other hand, SSIM and FSIM are exploited to
measure similarity among the segmented images (computed as a result of multilevel thresholding
process carried out by different objective functions) and original images.
Performance of the algorithms has been measured in terms of following significant parameters:
where,
M, N - size of image - Original image and Thresholded image at particular
level
i, j- Pixel range in the rows and Pixel range in the column.
The Peak Signal to Noise Ratio (PSNR) is the proportion between maximum attainable powers
and corrupting noise that influence likeness of image. PSNR is usually précised as decibel scale. The
PSNR is usually used as measure of quality rebuilding of image. The signal in this case is original
data and the noise is the error imported. High value of PSNR signifies the high Quality of image.
Excellent values range of PSNR is from 30 to 50 dB, but the acceptable range is 25dB.
SSIM is an image quality assessment, based on the degradation of structural information. The
SSIM is used to compare the structures of original and thresholded image. The SSIM index is
computed as:
where, x and y stands for mean intensity of image of x and y respectively.
x and y indicates the standard deviations of x and y respectively. xy is the local sample correlation coefficient between x and y.
2 1 1 )] , ( ~ ) , ( [ 1
M i N j j i I j i I MN MSE (4)= 20 (5)
C1and C2are the constants, and are included to avoid instability when are very close to zero. Here,
C1= C2= 0.065.
The SSIM can take the values in [−1, 1] range, and a higher value of SSIM shows better
performance. The SSIM metric can be extended for true color RGB images as following:
(7)
FSIM is used to compute feature similarity between the input and processed frame, which is
formulated as:
(8)
where, represents the entire image,
SL(x) indicates similarity between the threshold image and original image.
The FSIM metric can be extended for true color RGB images as following:
(9)
Here, xc, yc corresponds to cth channel of the original image and multilevel thresholded image; And c stands for channel number (i.e., c = 1, 2, 3 in true color RGB images).
B.Model Calculation
Here, the Giraffe video’s feature values are taken for the model calculation is given below,
TN = 0.8, TP = 0.9, FN = 0.02, FP = 0.04
Accuracy = (TP + TN) / (TP + FP + FN + TN)
= (0.9 + 0.8) / (0.9 + 0.04 + 0.02 + 0.8)
= 0.9659900 x 100
= 96.5910 %
Sensitivity = TP / (TP + FN)
= 0.9 / (0.9 + 0.02)
= 0.978261 x 100
= 97.8261 %
Specificity = TN / (FP + TN)
= 0.8 / (0.04 + 0.8)
C C C Y X SSIMSSIM ( , )
X m m X L X PC X PC X S FSIM ) ( ) ( ) (
C C C Y X FSIM= 0.952385 x 100
= 95.2385 %
where,
TN – True Negative TP – True Positive FN – False Negative FP – False Positive
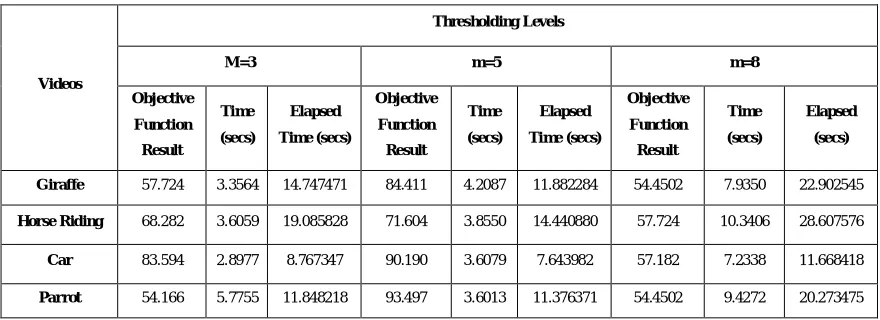
Table II shows the comparison of various fidelity parameters for the discovery rate of pa=0.25
and pa= 0.5, in which 0.25 value gives better results than 0.5 pa value (i.e.) the computational time
of CS and objective function values (pa – Discovery rate of the cuckoo’s egg). Table III shows the
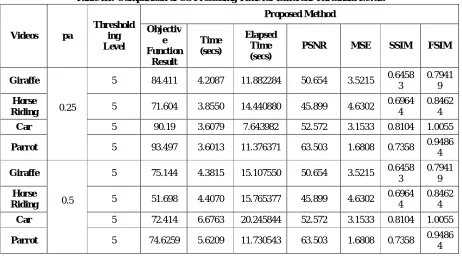
comparison of various fidelity parameters such as PSNR, MSE, SSIM, FSIM, for pa = 0.25. Table
IV shows the comparison of the CS processing time and objective function results for different
threshold levels. This table proved the fact that, the 5th level of threshold gives best output accuracy than other threshold levels.
Table II: Comparison of Various Fidelity Parameters for Different Values of pa Computed
by CS Algorithm Using Kapur’s Entropy
Videos
Thresholding Levels
M=3 m=5 m=8
Objective
Function
Result
Time
(secs)
Elapsed
Time (secs)
Objective
Function
Result
Time
(secs)
Elapsed
Time (secs)
Objective
Function
Result
Time
(secs)
Elapsed
(secs)
Giraffe 57.724 3.3564 14.747471 84.411 4.2087 11.882284 54.4502 7.9350 22.902545
Horse Riding 68.282 3.6059 19.085828 71.604 3.8550 14.440880 57.724 10.3406 28.607576
Car 83.594 2.8977 8.767347 90.190 3.6079 7.643982 57.182 7.2338 11.668418
Table III: Comparison of CS Processing Time for Different Threshold Levels
TABLE IV: Comparison of Various Fidelity Parameters for the value of pa =0.25 by
CS Algorithm using Kapur’s Entropy
CONCLUSION
In this paper, a multilevel thresholding based Cuckoo Search (CS) algorithm is applied in video
segmentation scheme. Here, the Cuckoo Search algorithm is achieved to generate the optimal
thresholding value. In this method, multilevel thresholding based Cuckoo Search algorithm have
been reduced the computation inefficiency. When the number of thresholds increases, the
thresholding performance is qualitatively better. However, the computation time increases is direct Videos pa
Threshold ing Level Proposed Method Objectiv e Function Result Time (secs) Elapsed Time (secs)
PSNR MSE SSIM FSIM
Giraffe
0.25
5 84.411 4.2087 11.882284 50.654 3.5215 0.6458 3
0.7941 9
Horse
Riding 5 71.604 3.8550 14.440880 45.899 4.6302
0.6964 4
0.8462 4
Car 5 90.19 3.6079 7.643982 52.572 3.1533 0.8104 1.0055 Parrot 5 93.497 3.6013 11.376371 63.503 1.6808 0.7358 0.9486
4
Giraffe
0.5
5 75.144 4.3815 15.107550 50.654 3.5215 0.6458 3
0.7941 9
Horse
Riding 5 51.698 4.4070 15.765377 45.899 4.6302
0.6964 4
0.8462 4
Car 5 72.414 6.6763 20.245844 52.572 3.1533 0.8104 1.0055 Parrot 5 74.6259 5.6209 11.730543 63.503 1.6808 0.7358 0.9486
4
For proposed method with pa = 0.25
Videos Cuckoo Search Objective Function Time (secs) CS Threshold values Elapsed time (secs)
PSNR MSE SSIM FSIM Specificity Accuracy Sensitivity
Giraffe 84.411 4.2083 0.8510 11.8823 97.8261 97.8261 97.8261 97.8261 97.8261 97.8261 97.8261
Horse
Riding
97.8263 97.8263 97.8263 97.8263 97.8263 97.8263 97.8263 97.8263 97.8263 97.8263 97.8263
Car 97.8265 97.8265 97.8265 97.8265 97.8265 97.8265 97.8265 97.8265 97.8265 97.8265 97.8265
proportional to the increase in number of thresholds. There are three different levels of thresholds is
applied in the segmentation, they are 3, 5, and 8 level of threshold.
When compared to other levels of thresholding, the 5 level gave an accurate segmented result for
different videos that is clearly showed in the table. To detect the change detection of the inter-frame
differences, MPEM (Motion Pixel Expectation Maximization and SIFT (Scale Invariant Feature
Transform) algorithm is captured the moving pixel and the local feature of each frame. The cuckoo
Search algorithm and SIFT combination have giving the best accurate object segmentation in video.
The results of CS-Levy technique are better in terms of feature.
A review of Tables II,III and IV reveals that CS based video segmentation has obtained the best
CPU time, PSNR, MSE, SSIM, and FSIM values for all the video and also at all threshold levels.
Furthermore, Kapur’s entropy using CS algorithm provides best segmented results for all the test
videos and the discovery rate value of pa = 0.25 have given superior results. The main advancement
of proposed method is the capability to preserve the useful feature after segmentation process.
REFERENCES
1. S. Pare, A. Kumar, V. Bajaj, G.K. Singh, “A Multilevel Color Image Segmentation technique
based on Cuckoo Search Algorithm and Energy Curve”, Applied Soft Computing 2016;
1568-4946.
2. Ashish Kumar Bhandari, Vineet Kumar Singh, Anil Kumar, and Girish Kumar Singh, “Cuckoo
Search Algorithm and Wind Driven Optimization based study of Satellite Image Segmentation for
multilevel thresholding using Kapur’s entropy”,Expert Systems with Applications 2014; 41:
3538–3560.
3. Mohamed Abdel-Baset,and Ibrahim Hezam, “Cuckoo Search and Genetic Algorithm Hybrid
Schemes for Optimization Problems”, Appl. Math. Inf. Sci., 2016; 3:1185-1192.
4. K. Suresh Manic, R. Krishna Priya and V. Rajinikanth, “Image Multi-thresholding based on
Kapur/Tsallis Entropy and Firefly Algorithm”,Indian Journal of Science and Technology 2016;
9 (12).
5. Peng-Yeng Yin, “Multilevel minimum cross entropy threshold selection based on Particle Swarm
Optimization”, Applied Mathematics and Computation 2007; 184: 503–513.
6. Erik Cuevas, Felipe SenciónEchauri, Daniel Zaldivar and Marco Pérez-Cisneros, “A
Multi-threshold Segmentation Approach Based on Artificial Bee Colony Optimization”, Applied
7. Mary Synthuja Jain Preetha M., Padma Suresh . L., and John Bosco M., “Region Based Image
Segmentation using Cuckoo Search Algorithm”, Journal of Chemical and Pharmaceutical
Sciences 2016; 9 (2).
8. Pal N.R. and Pal S.K., “A Review on Image Segmentation Techniques,” Pattern Recognition.