(Received 29 January 2018/Accepted 23 July 2018)
Spatiotemporal structure of fluctuation with 11 kHz excited in a linear magnetized plasma was observed in details by applying pattern recognition method based on statistical averaging. Statistical behaviors of instanta-neous period of the fluctuation and the temporal behavior of the radial profile of the fluctuation are clarified. Two-dimensional structure of the fluctuation is reconstructed and distortion of the wave-front of the fluctuation was inferred.
c
2018 The Japan Society of Plasma Science and Nuclear Fusion Research
Keywords: non-linear wave, plasma turbulence, conditional averaging, phase tracking, spatiotemporal structure DOI: 10.1585/pfr.13.3401105
1. Introduction
Pattern recognition becomes important recently and is used to detect anomaly and to reduce dimensionality in a broad range of fields, e.g. imaging science and weather forecasting. An identification of spatiotemporal patterns of fluctuating structures in magnetized plasma is an im-portant task for plasma turbulence research. When the fluctuation amplitude becomes large, the linear approxi-mation breaks down. While linear theory predicts expo-nential growth of unstable fluctuations, but nonlinear ef-fects cause saturation and limit the fluctuation amplitude at a finite level. In addition, nonlinear processes can distort waveform of waves as observed in ultrasonic waves and shock waves. In fact, density fluctuation in a linear mag-netized plasma saturates and its normalized level reaches up to 30 % [1]. Hence nonlinear effects must be taken into account. Spatiotemporal pattern is an important informa-tion to identify instabilities and nonlinear interacinforma-tions in plasma turbulence [2–4]. The waveform distortion of drift waves in magnetized plasma is related to nonlinear pro-cesses through wave-front twisting, e.g. formation of the zonal flow and streamer [2,5]. Here we described a method to extract the distorted waveform from turbulent fluctua-tion signals measured in a laboratory magnetized plasma for understanding nonlinear mechanisms in plasma turbu-lence.
author’s e-mail: [email protected]
∗)This article is based on the presentation at the 26th International Toki Conference (ITC26).
2. Experimental Setup and
Condi-tional Averaging
We investigate plasma turbulence in a laboratory mag-netized plasma. Turbulence is excited in a linear magne-tized plasma device, PANTA [6]. Argon plasma is pro-duced by helicon wave (Prf =6 kW, 7 MHz) and injected
neutral argon pressure is 3 mTorr. The length of cylindri-cal plasma is 4 m and diameter of quarts tube of the helicon source (=100 mm) determines diameter of plasma of ap-proximately 120 mm. Axial magnetic field isBax=0.15 T.
Central electron density and temperature are 1×10¹⁹m−3
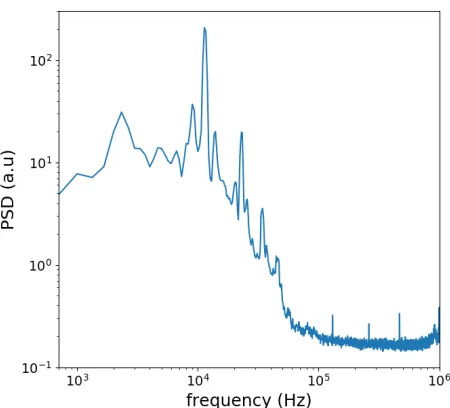
and 3 eV. Under this condition, the 11 kHz fluctuation and its higher harmonics are strongly exited as shown in Fig. 1. Characteristic frequency of fluctuations excited under the standard condition (Prf =3 kW,Bax=0.09 T) is 4 - 6 kHz.
Azimuthal mode number (m) of the 11 kHz fluctuation is found to bem=4 from an azimuthal probe array measure-ment [5]. Radial profile of ion saturation current is mea-sured with a 5-channel radial probe array (r=23, 33, 43, 53, and 63 mm). The azimuthal array and radial array are installed at 1875 mm and 1375 mm in the axial direction from helicon source, respectively. Electron diamagnetic drift velocityv∗and drift frequency f∗are calculated to be v∗=csρs/Ln=7.0×102m/s and f∗=v∗kθ/2π=11.5 kHz, respectively, wherecsis ion sound speed,ρsis gyro-radius
evaluated by the ion sound speed,kθ =m/r =100 rad/m, density gradient scale lengthLn=(∇n/n)−1=2.8×10−2m,
which is evaluated by radial profile of ion saturation cur-rent. The observed frequency of 11 kHz is close to f∗.
c
2018 The Japan Society of Plasma
Fig. 1 Power spectrum density (PSD) of ion saturation current fluctuation atr=44 mm.
Here we neglected Doppler shift due to E×B rotation. The background radial electric field of −1 V/cm can ex-plain observed azimuthal velocity. Unfortunately, errors in evaluation of the radial electric field is large due to large level of potential fluctuation (eVf/Te∼15 %) and thus
con-tribution of the backgroundE×B velocity has not been verified yet. On the other hands experimental observation also indicates that levels of normalized density and poten-tial fluctuations are almost the same at f ∼11 kHz. We hence inferred from these that the observed mode is the drift wave.
There are many analysis techniques for quasi-periodical time series data and they are frequently used in plasma turbulence study to analyze pulse-like signals, e.g. blobs and ELMs [7]. Pulse is one of the most obvi-ous signal patterns and thus it is easy to recognize pulses. When there is no apparent pattern in signals, classification of signal based on amplitude is difficult. We thus apply a new method to extract a pattern in signals. This method is based on a technique, which is widely used for heart-beat fluctuation diagnostic by using electrocardiogram [8, 9]. Temporal evolution of ion saturation current atr=43 mm is shown in Fig. 2 (a). We are interested in a fluctuating structure with time-length of 100µs, which corresponds to high frequency components (≥10 kHz) of fluctuation. First, we need initial template to apply our method. The initial template is determined by f0(τ)= 1n
n
i=0F(τ+iT)
(0 ≤ τ ≤ T), here F(t) is original signal and character-istic periodT is set up by time-scale of interest. In this paper, f0(τ) = sin(2πτ/T) was used for simplicity andT
is determined by frequency of the largest peak in ensem-ble averaged Fourier spectrum. Then we obtained an initial “template” waveform. Next, we calculate cross-correlation coefficient between the template and original signal,Cj(t),
Fig. 2 Typical temporal evolution of ion saturation current atr= 43 mm (a) and trigger function (b). (c) initial template and templates after 1 - 3th iterations.
Cj(t)=
1 σF(t)σf
T/2
−T/2
(F(t−t)−F(t))
·(fj(t)−fj)dt. (1)
Here j denotes number of iterations and fj(τ) is the j-th
template,F(t) and fjare averaged values ofF(t) and f(t)
over the fundamental period and σF(t) and σf are
vari-ances of them. When pattern similar to the template is found in the original signal, Cj(t) becomes large. Thus
the Cj(t) is used as an index of appearance of template
in the original signal. Figure 2 (b) shows theC0(t)
cal-culated by the initial template. In the electrocardiogram analysis, template of heart-beat signal is already known. In plasma turbulence, however, the temporal pattern is gener-ally not known. In our method, the pattern is determined self-consistently by a trial and error manner, and thus itera-tion process is required. We extracted sub-signals for each 100µs from original signal based on peaks (local maxima) ofCj(t) (see Fig. 2 (b)) and averaged them again to obtain
new template. We iterated above process until the template converges. Figure 2 (c) shows templates obtained at diff er-ent iteration loops (f0 denotes the initial template). The
template is converged after 3 iterations. More iterations are required in some cases [10].
We assume that high probability timing of appearance of the template is given by local maximum of theCj(t)
and then the trigger function is given by a delta function (iδ(t−ti), wheretiis the time-to-peak ofCj(t)). In that
case, reconstructed waveform is written ass(t)=i{aiδ(t−
ti−τ)f(τ)+F(t)}by using the template, where−T/2≤τ≤
T/2 andaiis intensity of the template. The trigger function
and reconstructed waveform are shown in Fig. 3.
Fig. 3 (a) trigger function and (b) reconstructed signal. Origi-nal and low-pass-filtered (cut-offfrequency is 30 kHz by using Bessel filter) signals are also shown.
and is similar to sawtooth wave which contains higher har-monics. In the case of extracting a coherent wave which has many higher harmonics, care should be taken when one applies digital filtering to signal. Strong filtering will break phase delay and group delay of higher harmonics. In our method, wave components which have regular phase delay with respect to the template are emphasized while those with random phase delay are canceled out through condi-tional averaging and thus this method realizes strong noise reduction without phase delay and group delay of higher harmonics.
3. Result and Discussion
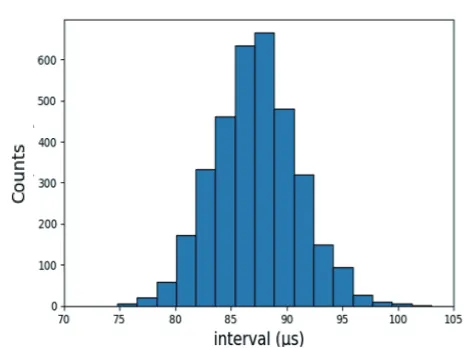
Based on converged trigger function, we obtained statistical features of appearance frequency of the quasi-periodic 11 kHz fluctuation. The instantaneous periods of fluctuation are evaluated by the intervals between two ad-jacent peaks in the trigger function. The histogram of ap-pearance frequency of the instantaneous period is shown in Fig. 4. This clearly demonstrates that the period of fluctu-ation in turbulent plasma varies in time and is distributed. The mean value and standard deviation of the distribution function are 8.73µs and 3.98µs, respectively. These corre-spond to frequency of the fluctuation of 11 kHz. Kurtosis of them is 0.150 which is close to Gaussian, while skew-ness is found to be finite (0.335). Fluctuations in turbulent plasma are considered to be linearly excted and dumped through nonlinear mechanisms. Thus, the appearance fre-quency and its statistical features (e.g. standard deviation) could be related to not only linear instability but also non-linear dumping of fluctuations.
To compare the template method with the traditional conditional averaging method, we have applied the tradi-tional reference time detection method used in blob
analy-Fig. 4 Histogram of instantaneous intervals between peaks of trigger function.
sis [11], in which time-to-peak of pulse (ti) is determined
byF(ti) ≥Fth >F(ti−1), where time series signalF(ti) is
sampled everyδt(ti=ti−1+δt) andFthis a threshold value.
Results are shown in Fig. 5. We have tested 2 threshold values which are indicated as blue and green broken lines in Fig. 5 (a). Determined time-to-peaks are shown as delta function in Fig. 5 (b) as blue and green lines corresponding to each threshold value. Trigger function determined by our method is also indicated (red line). There is a possibil-ity of count error depending on the noise level and thresh-old value. An algorithm avoiding count error due to noise (e.g. smoothing) and suitable threshold value are required. They will be usually determined by a trial and error man-ner. Count error will cause doubling (or tripling) of the period. In fact, histogram of appearance frequency shows the doubling and tripling of period, while our method does not miss the counting as shown in Fig. 5 (c). In the case of pulse-like signals, e.g. blobs and ELMs, the traditional method is very powerful. While the template method is useful to determine a quasi-coherent wave-like pattern in a signal.
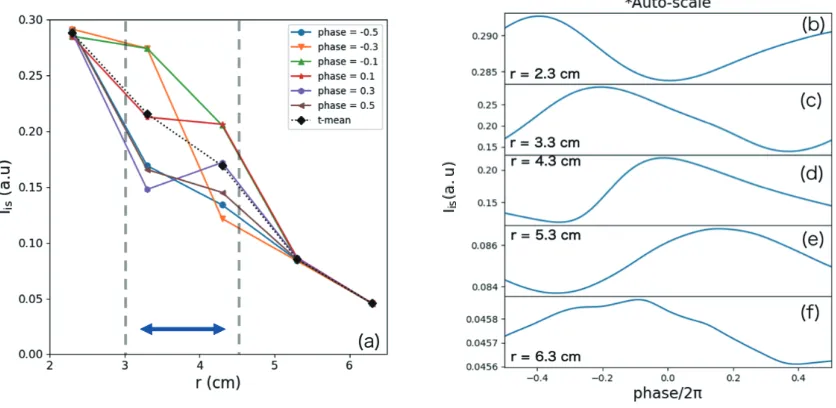
Based on the trigger function obtained atr=43 mm, templates at different radii. can be evaluated from signals of radial probe array. It is found that the 11 kHz fluctuation is large and localized in the narrow radial region (33 -43 mm) as shown in Fig. 6 (a). Extracted templates have phase delay in the radial direction (Figs. 6 (b) - (f)). If we assume thatm = 4 and rigid-body rotation, i.e. the tem-plates at different radii propagate in the azimuthal direc-tion together, we can draw equi-phase lines on azimuthal cross section, i.e. wave-front. Distorted waveforms of tem-plates mean wave-fronts are twisted as shown in Fig. 7 (a). Obtained image is consistent with a result of visible light tomography [12, 13].
Fig. 5 (a) Example of reference time detection by the traditional method with 2 different thresholds of 0.2 (green) and 0.22 (blue). (b) Detected time-to-peak indicated by delta functions. (c) Appearance frequency of the fluctuation pattern with each method.
Fig. 6 Temporal change of radial profile of ion saturation current (a) and phase relation of templates at different radii. (b) - (f).
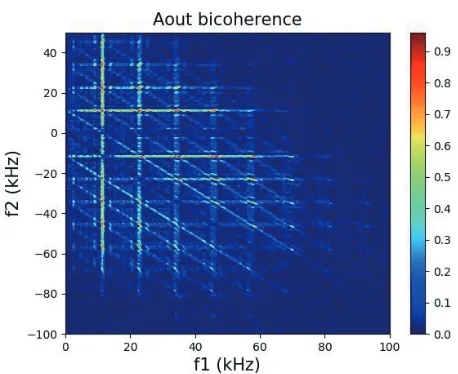
Fig. 8 Auto-bi-coherence of ion saturation current fluctuation at r=43 mm.
of potential fluctuation. We reconstructed a 2-dimentional structure of potential fluctuation with almost the same ex-perimental condition (B =0.13 T,Prf =6 kW). Actually,
we obtained distorted waveform of potential fluctuation as shown in Fig. 7 (b). Wave-front distortion is considered to be related to three-wave coupling [5]. In fact, the auto bi-coherence atr=43 mm demonstrates the strong three-wave coupling involving with 11 kHz mode and its higher harmonics as shown in Fig. 8.
The trigger function is very useful to synchronize other diagnostics. For example, if timings of laser injection of Thomson scattering system are measured together with trigger function, conditional averaging can be performed, to evaluate the electron temperature component of the fluc-tuation synchronous with template. This experiment is in progress and will be reported in near future [14].
4. Summary
To observe the spatiotemporal pattern of newly
ob-for Scientific Research of JSPS of Japan (JP18K03578, JP17H6089, JP15H02155, JP15H02335), the collab-orative Research Program of Research Institute for Applied Mechanics, Kyushu University and of NIFS (NIFS13KOCT001).
[1] H. Arakawaet al., Sci. Rep.6, 33371 (2016).
[2] P.H. Diamond, S.-I. Itoh and K. Itoh, Plasma Phys. Control. Fusion47, R35 (2005).
[3] M. Rosenbluth and F. Hinton, Phys. Rev. Lett. 80, 724 (1998).
[4] S. Champeaux and P.H. Diamond, Phys. Lett. A288, 214 (2001).
[5] T. Yamadaet al., Nature Phys.4, 721 (2008). [6] S. Inagakiet al., Sci. Rep.6, 22189 (2016). [7] C. Theileret al., Phys. Plasmas18, 055901 (2011). [8] J.H. Shinet al., Conf. Proc. IEEE Eng. Med. Biol. Soc.
2008, 1144 (2008).
[9] A.O. Leunget al., Magn. Reson. Med.60, 709 (2008). [10] S. Inagakiet al., Plasma Fusion Res.9, 1201016 (2014). [11] G. Fuchertet al., Plasma Phys. Control. Fusion55, 125002
(2013).