Corresponding author, email:[email protected] (B.O. Isiuku). Tel: +2348 035731300.
Asian Journal of Green Chemistry
Journal homepage: www.ajgreenchem.com
Orginal Research Article
Cationic dye (methyl violet) removal from aqueous solution by
egg membrane in a batch biosorption process
Beniah O. Isiuku
a,* , Chigoziri Ugwueze Nwogu
baDepartment of Chemistry, Imo State University, Owerri, Nigeria
bDepartment of Chemistry, Faculty of Science, Imo State University, Owerri, Nigeria
A R T I C L E I NF O R MA T I O N A B S T R A C T
Received: 28 August 2018
Received in revised: 9 October 2018 Accepted: 28 October 2018
Available online: 16 January 2019
DOI: 10.33945/SAMI/AJGC.2019.3.8
Non-modified egg membrane was used to remove methyl violet from aqueous solution by batch biosorption at various experimental conditions. Isotherm, kinetic and thermodynamic as well as biosorption mechanism were investigated and discussed. Dye uptake increased with increase in initial dye concentration but decreased with increase in time. Maximum biosorpion capacity and optimum temperature were 161 mg/g and 45 °C respectively. Liquid film diffusion controlled the process which was endothermic, spontaneous and physisorptive. Egg membrane appears to be a novel natural membrane for removing cationic substances from aqueous solutions. It is environmentally friendly.
KEYWORDS
Graphical Abstract
Introduction
There has been a growing public concern over the disposal of dye wastewater from textile and
dyestuff industries into water bodies due to their toxicity and carcinogenicity [1]. The discharge of
for photosynthesis in aquatic plants, damages the quality of the receiving water bodies and is
detrimental to aquatic life [2].
Dyes are chemicals which impart color permanently on materials due to chemical bonding. They are ionic and aromatic organic compounds having delocalized electron systems. The color of a dye arises from the presence of a chromophore. A chromophore is a radical configuration made up of conjugated double bonds possessing delocalized electrons. The chromogen, which is an aromatic system contains benzene, naphthalene or anthracene rings which form a part of a chromophore– chromogen structure along with an auxochrome. The ionic moieties termed as auxochromes are responsible for a much stronger change of the maximum light absorption of the dye and provide a
bonding affinity [3]. Methyl violet is broadly applied in paints, textiles, printing inks, bacteria
classification and as a disinfectant [4, 5]. Inhalation of methyl violet may cause irritation to the
respiratory tract. Its ingestion causes irritation to the gastrointestinal tract [6]. Methyl violet is
difficult to degrade due to the presence of three phenyl groups, each bonded to a nitrogen atom which
interacts with one or two methyl groups [7].
Many technologies have been developed for removing synthetic dyes from wastewater in order to control environmental pollution. They include membrane filtration processes, adsorption
techniques, coagulation, advanced oxidation processes and ozonation [8]. Among the technologies,
adsorption is superior to the other techniques in terms of cheapness, flexibility, simplicity of design,
ease of operation and lack of sensitivity to toxicants [9, 10].
Adsorption is a process that takes place at the surface as a result of the sticking of the particles
(Atoms, ions or molecules) of one substance (Adsorbate) to the surface of the other (Adsorbent) [1].
Biosorption is the adherence of an adsorbate on the surface of the adsorbent where the adsorbent is
a natural material of biological origin whether living or denatured [11]. Hen egg membrane has good
biosorption characteristics. It comprises from polysaccharide fibres and collagen which contain
hydroxyl, amine and sulphonic functional groups which bind the biosorbate particles [12]. Hen egg
membrane has been found useful in supporting immobilisation of enzymes [13]. Pramanpol and
Nitaya pat, [13] removed C.I. reactive Yellow 205 with eggshell containing the membrane and non-membrane. Their results showed that the presence of the membrane created an increase in
biosorption capacity 10-27 folds. Hassan and Salih, [12] used eggshell containing the membrane to
effectively remove methylene blue, a cationic dye, from aqueous solution.
This work investigated the effectiveness of hen egg membrane in the removal of methyl violet from aqueous solution by a batch biosorption process. The effects of initial dye pH, initial solution
Experimental
Biosorbate
The methyl violet (M/s Deverson, India) used in this work was purchased at Onitsha, Nigeria and
used with no further treatment. (Scheme 1) shows the structure. The stock solution was prepared by
dissolving 1 g dye per litre solution in a 1 L volumetric flask using deionized water.
Preparation of the biosorbent
The eggshell waste was obtained from restaurants at Imo State University, Owerri, Nigeria. The waste was washed thoroughly with hot distilled water to remove dirt. It was packed in a stainless steel vessel containing deionized water and boiled for 30 min. After cooling, while still soaked in water, the membrane was peeled off. The peels biomass was dried at 105 °C for 24 h. After cooling the biomass was ground and sieved to obtain 0.42-0.841 mm particles. The biomass was packed in a plastic container.
Characterization of the biosorbent
Infrared spectrophotometric analysis was run with a sample of the hen egg membrane with UV/Visible spectrophotometer (FT-IR-8400S, M/s Shimadzu, Japan). Proximate analysis of the
biosorbent was carried out using the method of the Association of Official Analytical Chemists [14].
The surface structure of the egg membrane was examined with a scanning electron microscope (SEM model Phenom Prox, M/s Phenom world, Netherlands).
Batch biosorption process
Batch biosorption of methyl violet from aqueous solution was carried out by agitating 0.01 g
portions of the hen egg membrane with 25 mL portions of different Co values in 50 mL volumetric
flasks. This was done by setting the samples flasks in a water bath shaker and, then, agitating it for 6 h at 30 °C and a speed of 150 rpm. A sample was collected each hour, filtered, and, then, the filtrate was analyzed using UV-Visible spectrophotometer (Shimadzu, model 752, M/s Shimadzu, China) at
a wavelength of 640 nm λmax.
Effect of initial pH
Akinola and Umar [15] method was applied. Fifty mL portions of methyl violet solution, Co 25
for 3 h. Sample solutions were filtered into sample tubes for analysis. The analysis was done using a UV/Vis spectrophotometer.
Effect of initial concentration and contact time
The method of Rocha et al., [16] was used. Fifty mL portions of the dye solution were measured
into 100 mL conical flasks. 0.02 g hen egg membrane was added into each flask. The flasks were
agitated at 150 rpm in a water bath shaker at 30 °C. Three flasks of Co 25, 50 and 100 mg/L were
removed at 30 min intervals for a total agitation time of 7 h. Clear solutions were collected from the flasks with syringes into sample tubes. Solution samples were analyzed with UV/Vis
spectrophotometer at 640 nm λmax.
The biosorption capacity qt at time t (min) and equilibrium qe (mg/g) were calculated [11] using
Eqs. 1 and 2:
𝑞𝑡 = (𝐶𝑜− 𝐶𝑡)𝑣 1000 𝑚
1
𝑞𝑒 =
(𝐶𝑜− 𝐶𝑒)𝑣 1000 𝑚
2
Where, Co, Ct, Ce, (mg/L), v (mL), and m (g) are dye concentrations at time t = 0, t = t and at equilibrium,
the volume of solution and the dry mass of the egg membrane respectively.
The total percentage removal, R (%), of the dye by the membrane (Biosorbent efficiency) was calculated using Eq. 3:
𝑅(%) =(𝐶𝑜 − 𝐶𝑒)100
𝐶𝑜
3
The biosorption capacity and R (%) are related according to Eq. 4:
𝑞𝑒 = 𝑅 𝐶𝑜 𝑉 105 𝑚
4
Effect of biosorbent dosage
Fifty millilitre portions of the dye solution, Co 25 mg/L and pH 8, were introduced into five 100
Clear solutions were taken from the flasks using syringes into sample tubes for analysis using UV/Vis
spectrophotometer at 640 nm λmax.
Effect of temperature
Fifty mL portions of the dye solution of Co 25, 50 and 100 mg/L at pH 8, were introduced into three
100 mL conical flasks. 0.02 g of hen egg membrane was added into each flask. The flasks were stoppered and agitated in a water bath shaker at 30 °C and speed 150 rpm for 3 h. The suspensions
were filtered into sample tubes and analyzed with the UV/Vis spectrophotometer at 640 nm λmax. The
process was repeated at 45 and 60 °C respectively.
Results and discussion
Analysis of the biosorbent
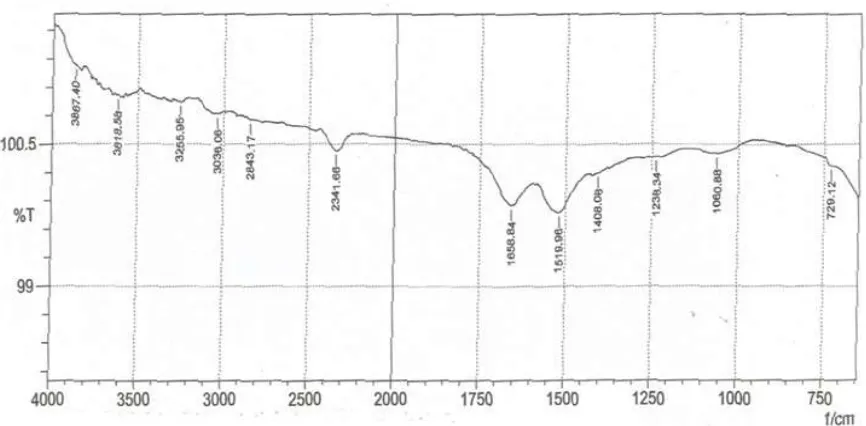
Fourier transform infrared spectrophotomeric analysis and proximate analysis were carried out
on the egg membrane. (Table 1) shows the protein, carbohydrate, fibre, and lipid contents of the
biomass. (Figure 1) shows the infrared spectrum of the biosorbent. The infra-red peaks at 2341.66,
2843.17, 3036.06, 3255.95, and 3618.58 cm-1 indicate the presence of N‒H and O‒H functional
groups, while 1238.34, 1408.08, 1519.96, and 1658.84 cm-1 show the presence of ‒CO functional
group. The N‒H and ‒CO functional groups exist in protein and protein fibres. Carbohydrates furnish
O‒H, and esters (Lipids) contain ‒CO and C‒O functional groups [17‒19]. (Figures 2a and b) show
the scanning electron micrographs of egg membrane which has a mesh structure with pores of different sizes. The combination of the functional groups and pores are responsible for the biosorption on the biomass.
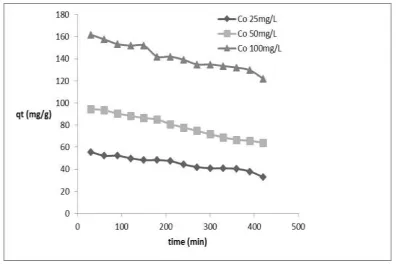
Effect of initial concentration and contact time
The effect of contacting 0.01 g portions of hen egg membrane with 25 mL portions of methyl violet
at pH 8 and 30 °C is portrayed in Figure 3. It was observed that biosorption capacity qe increased
with increase in Co but decreased with increase in time. The highest biosorption capacity values of
55.675, 94.525 and 161.925 mg/g were obtained for Co 25, 50 and 100 mg/L respectively with in 30
min of contact while the least values of 32.95, 64 and 122.15 mg/g respectively were at 420 min. The
increase in qe with increase in Co might be related to the increase in the driving force needed to
overcome the resistance of methyl violet ions migration from the dye solution to the biosorbent
surface [12]. At higher dye concentrations, the active sites of the hen egg membrane were surrounded
by much more methyl violet ions leading to enhanced biosorption [20]. Hen egg membrane consists
chains of the amino acids, arginine and lysine [13‒21]. Due to the faintly alkaline pH (pH 8) [13] of the dye solution the negatively charged sites on the membrane were competitively scrambled for by
the positively charged methyl violet ions, hence, the decrease in qe with time. Repulsion among the
dye ions increased with time.
Effect of initial dye solution Ph
Scheme 1. Structure of methyl violet
Table 1. Proximate analytical data of hen egg membrane
Parameter Value (%)
Moisture 11.7
Ash 8.39
Crude protein 21
Carbohydrate 36.57
Fibre 27.59
Lipid 13.65
Dye solution pH is paramount in the biosorption of methyl violet on hen egg membrane in that it
affects the properties of the biosorbent and the hen egg membrane [22]. Figure 4 shows the effect of
initial solution pH on the biosorption of methyl violet on hen egg membrane. The pH range 6-10 was
used. The highest qe (56.25 mg/g) was obtained at pH 7 and 9. However, the qe values at all the pH
values used were close. The closeness in the values of qe for all the used pH values used, for Co 25
mg/L shows that the change in pH did not have great effect. This might be as a result of the
zwitterionic nature of the protein fibre [23, 24].
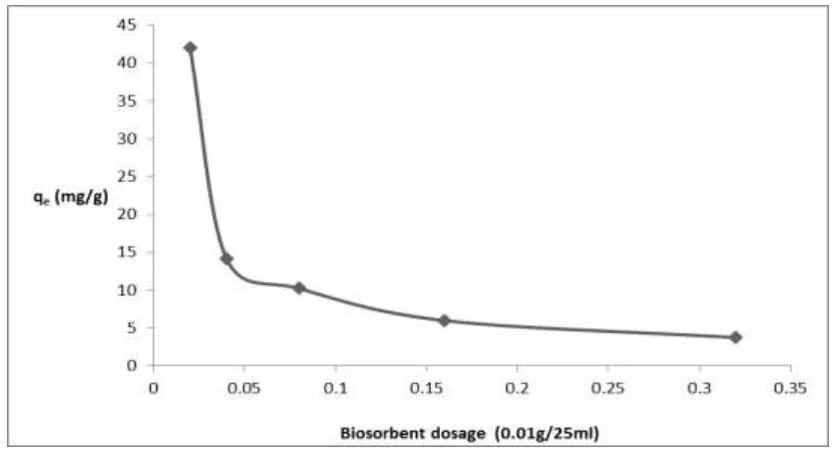
Effect of biosorbent dosage
The effect of biosorbent dosage on the biosorption of methyl violet on hen egg membrane was investigated by contacting 25 mL portions of the dye with 0.01-0.16 g portions of the hen egg
membrane at pH 8 and 30 °C. Figure 5 shows biosorbent dosage 0.01 g/25 mL having the highest qe
of 43.05 mg/g. After biosorbent dosage of 0.01 g/25 mL, the qe decreased sharply. Increasing
biosorbent dosage (0.01 to 0.16 g/25 mL) increased biosorption efficiency (67.28 to 95.44 %) while
qe decreased (42.05 to 3.728 mg/g). This phenomenon may be due to the occupation patterns of
active sites at higher membrane doses. The unsaturated active sites of the membrane may be occupied as a result of particles aggregation and overlap which interferes with binding sites. This
causes reduction in the total surface area of the membrane and qe [12, 25, 26].
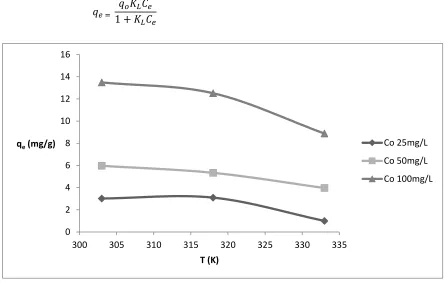
Effect of temperature
The effect of temperature on the biosorption of methyl violet on hen egg membrane was investigated by contacting 0.01 g portions of the membrane with 25 mL portions of dye solution of
Co 25–100 mg/L, pH 8 at 30, 45 and 60 °C. Figure 6 shows 30 °C having highest qe of 13.494 mg/g for
Co 100 mg/L. The biosorption was for 180 min. For all the used Co, qe decreased with an increase in
temperature. For each temperature, qe increased with an increase in Co. The decrease in qe with
increase in temperature was as a result of the weakening of the forces of attraction between the dye ions and the membrane surface. Increase in temperature (30 to 60 °C) led to a decrease (13.494 to
8.878 mg/g) in qe. The result agrees with the work of Horsfall Jnr and Spiff (Table 5) [27].
Biosorption isotherm modeling
Adsorption isotherm is a relationship between the concentration of the adsorbate adsorbed onto
the adsorbent and the adsorbate concentration in the solution at constant temperature [11]. An
adsorbent and describe the adsorption isotherm by constants whose values give information on the
surface properties and affinity of the adsorbents [28]. Methyl violet solution of Co 25, 50 and 100
mg/L were biosorbed on egg membrane at 30 °C. Experimental data were analyzed with the Langmuir, Freundlich, Temkin, Redlich-Peterson and Sips models.
Figure 2. (a Scanning electron micrograph of egg membrane 500 xs, b). Scanning electron micrograph of egg membrane 1000x
Figure 4. Biosorption of methyl violet on hen egg membrane at various pH values at 30 °C
Figure 5. Biosorption of methyl violet on hen egg membrane at various biosorbent doses at 30 °C
Langmuir isotherm
The Langmuir isotherm [16] is based on a theoretical model under the assumption that there is
𝑞𝑒 =
𝑞𝑜𝐾𝐿𝐶𝑒
1 + 𝐾𝐿𝐶𝑒 5
Figure 6. Biosorption of methyl violet on hen egg membrane at various temperature
The type 2 linearized form of Eq.5 is expressed as Eq.6:
1 𝑞𝑒= 1 𝐾𝐿𝑞𝑚 1 𝐶𝑒+ 1
𝑞𝑚 6
Where, qm (mg/g) and KL (L/mg) are the Langmuir constants related to the monolayer biosorption
capacity and energy of biosorption respectively.
A plot of 1/qe vs 1/Ce (Figure not shown) gave a straight line with slope 1/KLqm, and intercept 1/qm.
The correlation co-efficient R2, qm and KL values show that the Langmuir model was a good fit for
simulating experimental data (Table 2). The Langmuir type 2 equation is used to explain equilibria
phenomena of organic adsorption processes [29].
To prove that the biosorption was favorable, the dimensionless equilibrium parameter (RL) was
determined [30]. It is expressed as Eq.7:
𝑅𝐿 = 1
1 + 𝐾𝐿𝐶𝑜𝑚 7
Where, Com is the highest Co.RL<1, it shows that the process is favorable, RL = 1, linear, RL>1,
unfavorable, and RL = 0, irreversible.
0 2 4 6 8 10 12 14 16
300 305 310 315 320 325 330 335
qe(mg/g)
T (K)
Co 25mg/L
Co 50mg/L
Freundlich isotherm
This model is empirical and is used to describe systems that are heterogeneous. The Freundlich model assumes that the adsorption of the adsorbate takes place on a heterogeneous surface by multilayer adsorption and that the adsorbate concentration on the adsorbent infinitely increases
with increase in adsorbate concentration [31, 32]. The Freundlich equation is expressed as Eq. 8:
𝑞𝑒 = 𝐾𝐹𝐶𝑒1/𝑛 8
The linearized logarithmic form of the equation is expressed as Eq. 9:
𝐼𝑛𝑞𝑒 = (1 𝑛⁄ )𝐼𝑛𝐶𝑒+ 𝐼𝑛𝐾𝐹 9
Where, KF [mg/g (L/mg)1/n] and n are Freundlich constants representing the biosorption capacity
and biosorption intensity of the hen egg membrane respectively.
A plot of ln qe vs ln Ce (Figure not shown) gave a straight line with slope 1/n and intercept ln KF
values. Table 2 shows the 1/n and KF values. R2 value (0.999) shows that this model was a very good
fit for modeling the biosorption process.
The value of 1/n ranges between 0 and 1; the surface heterogeneity increases as the 1/n value gets
closer to zero [33]. The n values show the extent of non-linearity between solution concentration and
biosorption thus [34]: n = 1, adsorption is linear; n < 1, adsorption is chemisorption; n > 1, adsorption
is physisorption.
The condition n > 1 is most common. This might be as a result of distribution of surface sites or any factor that brings about a decrease in adsorbent adsorbate interaction with increasing surface
density [35]. The values of n within 1 to 10 portray good adsorption [36, 37]. In this work, the 1/n
and n values (0.9007 and 1.1102) show that the heterogeneity of the membrane surface was very low and the biosorption was a physisorption process.
Temkin isotherm
The Temkin model puts into consideration the effects of indirect adsorbate-adsorbate interactions on adsorption isotherm assuming that the heat of adsorption decreases linearly with
adsorbent surface coverage due to sorbate-sorbate interactions [11]. It is expressed as Eq. 10:
𝑞𝑒=𝑅𝑇𝑏
𝑇𝐼𝑛 𝐴𝑇𝐶𝑒 10
𝑞𝑒=𝑅𝑇
𝑏𝑇 𝐼𝑛𝐴𝑇+
𝑅𝑇
𝑏𝑇 𝐼𝑛 𝐶𝑒 11
Where, AT (L/g) is Temkin constant corresponding to the maximum binding energy, bT (J/mol) the
Temkin constant related to heat of adsorption, R, (8.314 J/mol. K) gas constant and T(K) the absolute temperature.
A plot of qe vs ln Ce gave a straight line with slope RT/bT and intercept (RT/bT) ln AT (Figure not
shown). Table 2 shows the R2, AT and bT values. The R2 value (0.9693) makes the Temkin model a
good fit for simulating the biosorption of the dye on the membrane.
Redlich–Peterson isotherm
The Redlich-Peterson model is a three parameter isotherm model [38]. It approaches the
Freundlich model at high concentrations, and agrees with the Langmuir model at low adsorbate concentrations. The Redlich-Peterson equation is expressed as Eq. 12:
𝑞𝑒 = 𝐾𝑅𝑃𝐶𝑒 1 + 𝑑𝑅𝑃𝐶𝑒𝛽
12
Eq. 12 can be linearized as Eq. 13:
𝐶𝑒
𝑞𝑒=
𝑎𝑅𝑃𝐶𝑒𝛽
𝐾𝑅𝑃 +
1
𝐾𝑅𝑃 13
Where, KRP, α RP and β are the Redlich-Peterson parameters. β lies between 0 and 1.
The logarithmic form of Eq. 13 gives Eq. 14:
𝑙𝑛 (𝐶𝑒 𝑞 𝑒
⁄ ) = 𝑙𝑛 (𝑎𝑅𝑃
𝐾𝑅𝑃2
⁄ ) + 𝛽𝑙𝑛𝐶𝑒 14
A plot of ln (Ce/qe) vs ln Ce gave a slope equal to β, intercept ln (αRP/K2RP) and R2 0.9944 (Figure not
shown). Substituting the value of β (0.1051) in Eq.13 and plotting Ce/qe vs 𝐶𝑒𝛽gave a straight line
(Figure not shown) with slope equal to αRP/ KRP and intercept 1/ KRP. The R2 value (0.9945) shows
that this model is a good fit for analyzing experimental data. Table 2 shows the αRPc and KRP values.
Sips isotherm model is a combination of Langmuir and Freundlich isotherm models. It describes heterogeneous surfaces far better. It reduces to Freundlich isotherm at low adsorbate concentrations
and to Langmuir isotherm at high adsorbate concentrations [12, 38, 39]. It is expressed as Eq. 15:
𝑞𝑒 =𝑞𝑚(𝐾𝑠𝐶𝑒)
𝛾
1(𝐾𝑆𝐶𝐸)𝛾 15
Rearrangement and expansion of Eq. 15 gives Eq. 16:
𝑞𝑒= 𝑞𝑚𝐾𝑠𝛾𝐶𝑒𝛾+ 𝑞𝑚 16
The logarithmic form of Eq. 16 is Eq. 17:
𝑙𝑛𝑞𝑒= 𝑙 𝑛(𝑞𝑚2𝐾𝑠𝛾) + 𝛾𝑙𝑛𝐶𝑒 17
A plot of lnqe vs lnCe gave a straight line with slope equal to 𝛾 (Figure not shown). Substituting
𝛾 (1.1183) in Eq.16 and plotting qe vs 𝐶𝑒𝛾 gave a straight line with slope equal to 𝑞𝑚𝐾𝑠𝛾 and intercept
equal to qm (Figure not shown). Table 2 shows the KS, qm and 𝛾 values. R2 value (0.9978) shows that
the Sips model is a good fit for modeling the biosorption of methyl violet on hen egg membrane.
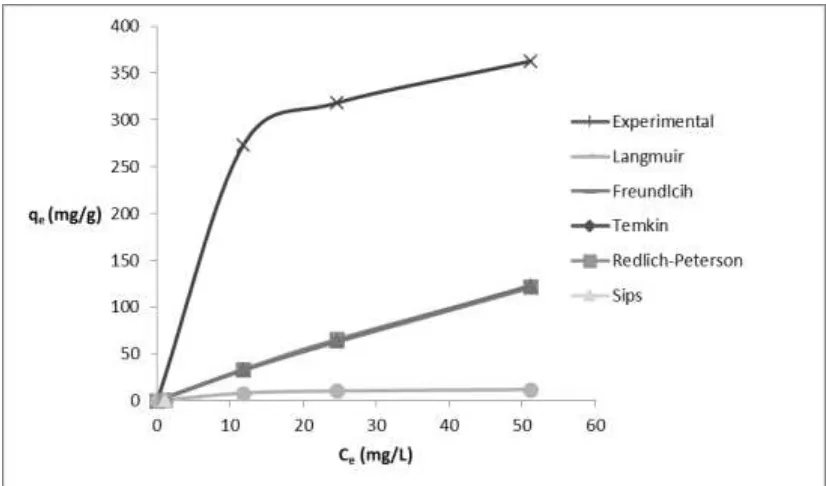
All the applied isotherm models applied favored the biosorption process as shown in Figure 7.
This is explained by the fact that all the qe vs Ce curves are convex [40].
Adsorption kinetic modeling
Prediction of adsorption rate would help in designing batch adsorption systems [11]. In this work,
the pseudo-second order (PSO), Elovich and Boyd models were applied to determine the kinetics, mechanism and rate controlling step of the biosorption.
Pseudo-second order kinetic model
The PSO kinetic model [9] is expressed as Eq. 18:
𝑡 𝑞⁄ = 1 (𝐾𝑡 ⁄ 2𝑞𝑜2)+ 𝑡 𝑞⁄ 18𝑜
Where, k2 [g/mg min] is the rate constant. A plot of t/qt versus t (Figure not shown) gave a straight
The initial biosorption rate h (mg/g min) is expressed as Eq. 19:
ℎ = 𝑘2𝑞𝑜2 19
Table 3 shows the values of qo and k2 for Co 25, 50 and 150 mg/L. R2 values 0.9718, 0.9886 and 0.9945
for Co 25, 50 and 100 mg/L respectively show that PSO model analyzed the experimental data
suitably.
Elovich kinetic model
Elovich kinetic model equation [11] is expressed as Eq. 20:
𝑞𝑡 = (1 𝑏⁄ ) 𝑙𝑛(𝑎𝑏) + (1 𝑏⁄ )𝑙𝑛 𝑡 20
Where, a (mg/g min) is the initial biosorption rate and b (g/mg) is the desorption constant related to the extent of surface coverage and activation energy for chemisorption.
A plot of qt against ln t gave a straight line with slope equal to 1/b and intercept equal to (1/b)
ln(ab) (Figure not shown).
Table 3 shows the values of a and b for Co 25, 50 and 100 mg/L. R2 values 0.842, 0.8595 and 0.8991
for Co 25, 50 and 100 mg/L respectively show that this model is a good fit for experimental data.
Boyd kinetic model
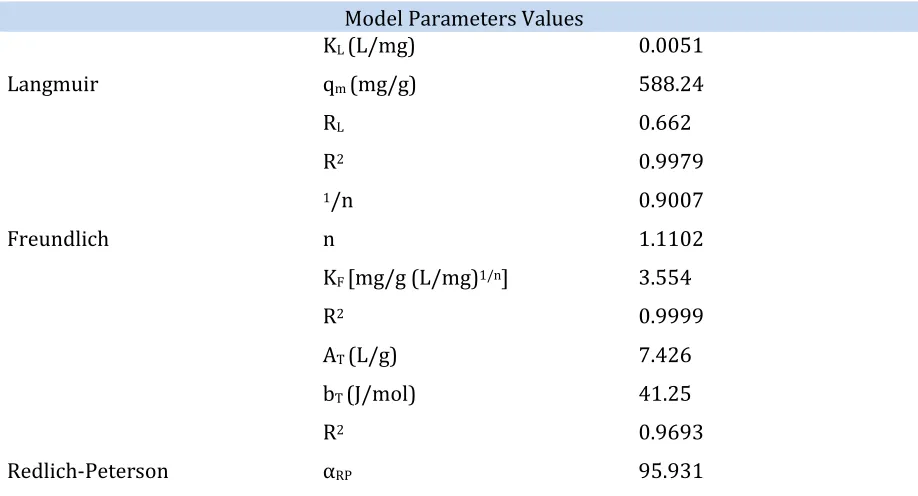
Table 2. Isotherm parameters for biosorption of methyl violet on hen egg membrane at 30 °C Model Parameters Values
Langmuir
KL (L/mg) 0.0051
qm (mg/g) 588.24
RL 0.662
R2 0.9979
Freundlich
1/n 0.9007
n 1.1102
KF [mg/g (L/mg)1/n] 3.554
R2 0.9999
Redlich-Peterson
AT (L/g) 7.426
bT (J/mol) 41.25
R2 0.9693
KRP 344.828
β 0.1051
R2 0.9945
Sips
Ks 0.129
qm (mg/g) 13.293
γ 1.1183
R2 0.9978
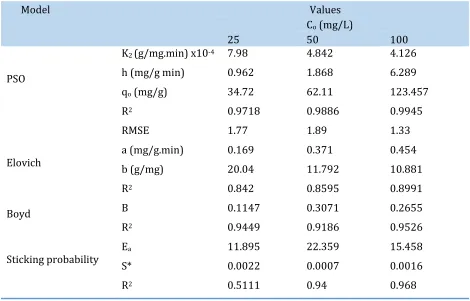
Table 3. Kinetic models parameters for the biosorption of methyl violet on hen egg membrane
Model Values
Co (mg/L)
25 50 100
PSO
K2 (g/mg.min) x10-4 7.98 4.842 4.126
h (mg/g min) 0.962 1.868 6.289
qo (mg/g) 34.72 62.11 123.457
R2 0.9718 0.9886 0.9945
RMSE 1.77 1.89 1.33
Elovich a (mg/g.min) b (g/mg) 0.169 20.04 0.371 11.792 0.454 10.881
R2 0.842 0.8595 0.8991
Boyd B 0.1147 0.3071 0.2655
R2 0.9449 0.9186 0.9526
Sticking probability ES* a 11.895 0.0022 22.359 0.0007 15.458 0.0016
R2 0.5111 0.94 0.968
Table 4. Thermodynamic parameters for the biosorption of methyi violet on hen egg membrane
Co (mg/L) Parameter/Value
∆Ho ∆So ∆Goads KD
30oC 45oC 60oC 30oC 45oC 60oC
25 60.966 190.199 -3.084 -0.367 2.703 3.401 3.241 6.331
50 29.194 85.95 -3.109 -2.03 -0.129 1.157 2.155 4.028
There are two mechanisms encountered in adsorption, the intraparticle diffusion and liquid film
diffusion [22‒41]. The mechanism that controls this process is ascertained by the Boyd model
expressed as Eq. 21:
𝐹 = 1 − 6
𝜋2∑
1 𝑛2 ∞
𝑛=1
exp(−𝑛2𝐵
𝑡) 21
Where, Bt is a mathematical function of F. F is the ratio of qt and qe expressed as Eq. 22:
𝐹 = 𝑞𝑡 𝑞 𝑒
⁄ 22
Where, qt<qe or
𝐹 = 𝑞𝑒 𝑞 𝑡
⁄ 23
Where, qt>qe.
Transformation and approximation of Eq. 21 gives Eqs. 24 and 25:
𝐵𝑡= −0.4977 − 𝑙 𝑛(1 − 𝐹) 𝑓𝑜𝑟 𝐹 = 0.86 − 1.0 24
𝐵𝑡= [√𝜋 − √𝜋 − (
𝜋2𝐹
3 )]
2
𝑓𝑜𝑟 𝐹 = 0 − 0.85
25
A plot of Bt against t gave a straight line (Figure not shown) with slope B, termed the Boyd constant.
If the straight line passes through the origin, intraparticle or pore diffusion will be the rate limiting step. If the straight line does not pass through the origin, liquid film diffusion will be the rate limiting
step [42]. None of the straight lines obtained from the plots passed through the origin, showing that
the process was controlled by liquid film diffusion. Table 3 shows the values of B and R2 for Co 25, 50
and 100 mg/L. The R2 values which are generally above 0.9 show the lines to be straight.
Sticking Probability
The mechanism in an adsorption process can also be measured by using the modified Arrhenius
𝑆∗= (1 − 𝜃)𝑒𝑥𝑝 − (𝐸𝑎
𝑅𝑇
⁄ ) 26
Where, S* is the sticking probability and Ea the activation energy. The logarithmic form of Eq. 26 is
expressed as Eq. 27:
𝑙𝑛(1 − 𝜃) = 𝑙𝑛𝑆∗+ 𝐸𝑎
𝑅𝑇
⁄ 27
A plot of ln (1–θ) against 1/T gave a straight line with slope equal to Ea/R and intercept lnS* (Figure
not shown). S* indicates the measure of the potential of an adsorbate to remain on the adsorbent indefinitely.
If S* >1, there is no adsorption
if S* = 1, there is a possible mixture of physisorption and chemisorption
if S* = 0, indefinite chemisorption predominates
0<S*<1, there is a favorable sticking of adsorbate to adsorbent. Physisorption predominates
Table 3 shows the Ea, S* and R2 values for Co 25, 50 and 100 mg/L. The R2 values show the model
fit for experimental data while the Ea and S* values show physisorption, since Ea is low and S* less
than 1.
Biosorption thermodynamics
The biosorption process can be evaluated by applying the thermodynamic parameters: standard
enthalpy (∆Ho), entropy (∆So) and free energy (∆Go). These parameters are expressed as Eqs. 28, 29
and 30:
𝑙𝑛𝐾𝐷=Δ𝑆𝑜
𝑅 −
Δ𝐻𝑜
𝑅𝑇 28
Where, KD is the distribution (or adsorption equilibrium) constant [11] expressed as Eq. 29:
𝐾𝐷 =(𝐶𝑜− 𝐶𝑒)𝑒
𝐶𝑒 29
∆𝐺𝑂 = −𝑅𝑇𝑙𝑛𝐾
𝐷 30
A plot of ln KD against 1/T (Figure not shown) gave a straight line with slope equal to ΔHo /R and the
intercept equal to ∆So/R. R2 values (>0.8) shows that the lines are straight. Table 4 shows the KD, ∆Ho,
The ΔGo values are negative and their magnitudes less than 20 kJ/mol. Hence, the process was
spontaneous and physisorptive [43, 44]. The positive values of ΔHo show that the biosorption was
exothermic while the positive values of ΔSo suggest increasing randomness at the
biosorbent-biosorbate interface and affinity for the biosorbent [45, 46].
Table 5. Maximum experimental biosorption capacity of hen egg membrane and other biosorbents
Biosorbent Dye %Removal References
Hen egg membrane methyl violet 48.86 This work
Hen egg membrane 2,4-DCP 48.2,71.2 Koumanova et al. [46]
3,5-DCP 37.2, 74.4 Koumanova et al. [46]
Hen eggshell methylene blue 84-73 Hassan and Salih [12]
Conclusion
Biosorption of methyl violet on egg membrane in a batch process was carried out at various Co
(25, 50 and 100 mg/L), pH (6-10), biosorbent dosages (0.01, 0.02, 0.04, 0.08 and 0.16 g/25 mL) and temperatures (30, 45 and 60 °C). Experimental data were analyzed with Langmuir, Freundlich, Temkin, Redlich–Peterson and Sips isotherm models as well as PSO and Elovich kinetic models.
Results show that the highest biosorption capacity was obtained from Co 100 mg/L, pH 8, biosorbent
dosage 0.01 g/25 mL and temperature 45 °C. Biosorption capacity increased with an increase in Co
but decreased with an increase in time. The five isotherm models applied, analyzed experimental
data, suitably (R2>0.95). R2 values for PSO and Elovich kinetic models (>0.84) show that the models
were good fits for experimental data. Application of Boyd kinetic model shows that the biosorption
was controlled by liquid film diffusion. Sticking probability S*, Ea, ΔGads, ΔH and ΔS values for 25, 50
and 100 mg/L initial dye concentrations show that the biosorption was physisorptive, spontaneous and endothermic. There was an increased randomness at the solid-solution interface and high affinity of the dye ions for the hen egg membrane. The results show that egg membrane is a good biosorbent for methyl violet, a cationic dye.
Disclosure statement
No potential conflict of interest was reported by the authors.
Orcid
Beniah O. Isiuku 0000-0002-5681-7170
References
[1]. Isiuku B.O., Nwosu C.N. Asian J. Chem., 2017, 29:475
[2]. Isiuku B.O., Horsfall M., Spiff A.I. Res. J. Appl. Sci., 2014, 9:201 [3]. Belay K., Hayelom A. Chem. Mater. Res., 2014, 6:31
[4]. Pal J., Deb M.K., Deshmukh D.K., Sen B.K. Appl. Nanoscience, 2014, 4:61
[5]. Saji M., Taguchi S., Uchiyama K., Osono E., Hayama N., Ohkuni H. J. Hosp. Infect., 1995, 31:225 [6]. Li P., Su Y.J., Wang Y., Liu B., Sun L.M. J. Hazard. Mater., 2010, 179:43
[7]. Bonetto L.R., Ferrarini F., de Macro C., Crespo J.S., Guegan R., Giovanela M. J. Water Proces. Eng., 2015, 6:11
[8]. Turhan K., Durukan I., Ozturkcan S.A., Turgut Z. Dyes. Pigments, 2012, 92:897 [9]. Tong Z., Zheng P., Bai B. Catalysts, 2016, 6:58
[10]. Wang L., Zhang J., Zhao R., Li C., Zhang C. Desalination, 2010, 254:68
[11]. Njoku V.O., Ayuk A.A., Oguzie E.E., Ejike E.N. Sep. Sci. Technol., 2012, 47:753 [12]. Hassan A.A., Hassan, Z.A.S. Euphrates J. Agric. Sci., 2013, 5:11
[13]. Pramanpol N., Nitayapat N. Kasetsart J. Nat. Sci., 2006, 40:192
[14]. Association of Official Analytical Chemists (AOAC), Official Methods of Analysis, 15th Ed.,
Arlington, VA, USA, 1990, p. 331
[17]. Williams D.H., Fleming I. Spectroscopic Methods in Organic Chemistry, 3rd Ed., McGraw-Hill Book (UK) Ltd., 1980, pp. 49
[18]. Finar I.L. Organic Chemistry, Vol. 2, 5th Ed., Longman Group Ltd, Essex, UK, 1975, pp.651
[19]. Han R., Zou W., Yu W., Cheng S., Wang Y., Shi J. J.Hazard. Mater., 2007, 141:156
[20] Tsai W.T., Yang J.M., Lai C.W., Cheng Y.H., Lin C.C., Yeh C.W. Bioresource Technol., 2006, 97:488 [21]. Njoku V.O., Hameed B.H. Chem. Eng. J., 2011, 173:391
[22]. Finar I.L., Organic Chemistry, Vol. 1: The Fundamental Principles, 6th Ed., Longman Group Ltd,
London, 1973, p. 207
[23]. Jones Jr M., Organic Chemistry, 2nd Ed., W.W. Norton and Company Inc., 2000, p. 715
[24]. Yeddou N., Bensmaili A. Desalination, 2007, 206:127 [25]. Mezenner N.Y., Bensmaili A. Chem. Eng. J., 2009, 147:87 [26]. Horsfall Jnr M., Spiff A.I. Electron. J. Biotechnol., 2005, 8:162 [27]. Sen J.K. Int. J. Environ. Pollut., 2011, 3:1
[28].
Isiuku B.O., Onyema M.O.,
World News Nat. Sci
., 2017, 13:10
[29]. Bello O.S., Fatona T.A., Falaye F.S., Osulale O.M., Njoku V.O. Environ. Eng. Sci., 2010, 29:186 [30]. Shrivastava P.K., Gupta S.K. Int. J. Chem. Sci. Appl., 2015, 6:1
[31]. Rane N.M., Sapkal R.S., Sapkal V.S., Patil M.B., Shewale S.P. Int. J. Chem. Sci. Appl., 2010, 1:65 [32]. Ajmal M., Khan A.H., Ahmad S., Ahmad A. Water Res., 1998, 32:3085
[33]. Al-Fatlawi A.H., Neamah M.M. Int. J. Adv. Res. Sci. Eng. Technol., 2015, 2:557 [34]. Reed B.E., Matsumoto M.R. Separat. Sci. Technol., 1993, 28:2179
[35]. Mckay G., Otterburn M.S., Sweeney A.G. Water Res., 1980, 14:15 [36]. Ozer A., Pirinc H.B. J. Hazar. Mater., 2006, 137:849
[37]. Oubagarandin J.U.K., Murthy Z.V.P., Rao P.S. Ind. Chem. Eng., 2007,49:196
[38]. Shahruyari Z., Goharrizi A.S., Azadi M. Int. J. Water Resour. Environ. Eng., 2010, 2:016 [39]. Vasailis I.J. J. Eng. Studies Res., 2010,16:29
[40]. Ekpete O.A., Horsfall Jnr. M., Spiff A.I. J. Nat. Appl. Sci., 2012, 1:106 [41]. Reichenberg D. J. Amer. Chem. Soc., 1853,78:589
[42]. Ding L., Zou B., Gao W., Liu Q., Wang Z., Guo Y., Wang X., Liu Y. Colloids Surf. A, 2014, 446:1 [43]. Konicki W., Cendrowski K., Chen X., Mijowska E. Chem. Eng. J., 2013, 228:824
[44]. Rachamani J., Mousavi H.Z., Behzad M. Desalination, 2011, 267:256 [45]. Li C., Dong Y., Yang J., Li Y., Huang C. J. Mol. Liq., 2014, 196:348