© Penerbit UTHM
DOI: https://doi.org/10.30880/ijie.2018.10.05.008
The analysis of initial probability distribution in Markov
Chain model for lifetime estimation
Siti Sarah Januri
1,*, Zulkifli Mohd Nopiah
2, Ahmad Kamal Ariffin Mohd
Ihsan
3, Nurulkamal Masseran
4, Shahrum Abdullah
31
Faculty of Computer and Mathematical Sciences, Universiti Teknologi MARA Cawangan Negeri Sembilan, Seremban, Negeri Sembilan, MALAYSIA.
2
Centre for Engineering and Built Environment Education Research, Faculty of Engineering and Built Environment, Universiti Kebangsaan Malaysia, Bangi, MALAYSIA
3
Department of Mechanical and Materials Engineering, Faculty of Engineering and Built Environment, Universiti Kebangsaan Malaysia, Bangi, MALAYSIA.
4
School of Mathematical Sciences, Faculty of Science and Technology, Universiti Kebangsaan Malaysia, Bangi, MALAYSIA.
Received 27 April 2018; accepted 12 September 2018, available online 30 October 2018
1. Introduction
Ethanol Fatigue lifetime estimation is one of the most influential field in engineering. Predicting system lifetime is significant to ensure the safety, reliability and availability of the system are maintained [1]. Many researchers have predicted fatigue to evaluate lifetime of concrete structures such as dams and bridges, cement plants [2], wind turbines [3], steel rebar [4] and welded structure [5]. This maintenance operation helps improves people’s lives and assures customer satisfaction [6]. However, the estimation of fatigue lifetime and observation of physical degradation can be very difficult to assess, especially when real-time observations are required [7].
Fatigue crack growth modeling attempts to characterize the evolution of the state. A complete fatigue crack growth problem is the process of a material from a beginning state to a complete failure state [7]. Accuracy, durability and fatigue strength are the important factors to guarantee the structural safety. In this light, the behaviors of the cracks are elusive [8]. Modeling is difficult as fatigue phenomenon is characterized by high complexity.
The fatigue crack growth process is an integrates of random factors such as inhomogeneity of real material, manufacturing processes, load spectrum, the geometry of component, randomness or cracking process and condition of technological such as quality of manufacturing and environmental conditions [9,10]. These random factors explained the influencing of the uncertainty factors to the fatigue crack growth process, and it contributes to the scattering of the crack size. There is significant number of research works that have focused on fatigue crack growth models: these include models presented in [11-15]. Many of these models rely on the experiment. The data provided by the experiment are needed to run the model where data and analysis can be applied statistically as the fatigue crack growth data have a statistical nature [16].
Many random factors have been considered to describe the fatigue crack growth problem as a whole. Probabilistic method has garnered great attention in the research area as an alternative for the deterministic method in determining fatigue life prediction [16,17]. Stochastically, there are two types of the crack growth
Abstract: This paper presents the analysis and modeling of predicting fatigue lifetime based on the Markov Chain model. Random factor is the main contributor to the prediction of fatigue lifetime. These random factors give an appropriate framework for modeling and predicting a lifetime of the structure. The Markov Chain model was used to predict the probability of fatigue lifetime based on the randomization of initial probability distribution. An approach of calculating the initial probability distribution is introduced based on the statistical distribution of initial crack length and the transition probability was formed using a classical deterministic Paris law. The classical Paris law has been used in calculating the transition probabilities matrix to represent the physical meaning of fatigue crack growth problem. The data from the experimental work under constant amplitude loading was analyzed using the Markov Chain model. The results show that the model is capable to predict the fatigue lifetime for Aluminum Alloy A7075-T6.
models: randomization of the deterministic model with fatigue crack growth model by providing the distribution of random time and randomization of the Paris–Erdogan equation [9,18].
One important use of fatigue crack growth modeling is to predict the lifetime of the material in the field. A Markov Chain approach is introduced to evaluate and model the stochastic behaviors of fatigue crack growth data. Although many studies used Markov Chain approach, very few focused on the studies of the initial distribution.This study proposes the integration between the probability distribution of initial crack length and the deterministic Paris law equation. Probability distribution of initial crack length was introduced to explain the initial probability distribution while deterministic Paris law equation was used to explain the fatigue crack growth process. The aim of this paper is to study a new approach of calculating the initial probability distribution based on statistical distribution of initial crack length.
2.
Markov Chain Modeling
The Markov Chain model is defined as a mathematical model for predicting the future state depending only on the current state. For a given system, the Markov model consists of the number of possible states, the possible transition paths between these states, and the probability values of these transitions. Fig. 1 explains the transition probabilities change from one state to the next. This process is known as the Markov Chain model. Each circle represents a state and arrows denote the transition path between each state.
Fig. 1: Markov Chain model with a circle represents a state. and are probabilities in a particular state and changing state, respectively [17].
In the Markov model, a duty cycle (DC) is an important element to introduce as a time to reach crack growth or as the group of the number of cycles accumulated to make a transition to next crack length [18]. In relation to this, the growth process of fatigue crack length is defined as a discrete both in time and states stochastic process. Markov model has two important elements: determining the initial distribution and the transition probability matrix. This study proposes that initial probability distribution was using lognormal probability distribution which is the best distribution to describe the initial crack length distribution. The lognormal probability distribution is as follows:
(1)
Where, is a shape parameter and is a scale parameter of the length of the initial crack. The lognormal
distribution was chosen as the best distribution through the comparison of Kolmogorov Smirnov value from all three distributions (lognormal, normal and Weibull) [19]. Meanwhile, the transition probability matrix values were computed to show the process of fatigue crack growth happened. Classical Paris law equation was applied to compute the probability values. The whole procedures of estimating the probability distribution of the states are as in following steps. Initially, defining the time, is measured by the number of duty cycles. Then, number of damage states, where the state denotes a failure state. The duty cycle is specified in a probability transition matrix, as
(2)
Where
Next, the number of states was determined with the crack length increment acting as a state. The states are assumed to be discrete with the states, , where corresponds to a failure state. In the Markov chain model, it is assumed that crack length increases by stage. The calculation of each state as in Equation (3).
(3)
where, is crack length in state , and is the initial crack length .
Then, the estimation of the initial probability row vector based on the distribution of initial crack length was conducted using the lognormal distribution. The probability of being in state at the time is given in Equation (4).
(4)
where
and .
It is assumed that, means that no component is in the failed state at the initial state.
computed. In this study, transient probability can be obtained by applying a Paris law equation into the model to represent the physical meaning of fatigue damage. The probability of changing into the next state, can be defined as stress intensity factor function as shown in Equation (5) which was derived from Equation (6).
(5)
Paris law equation: (6)
where = crack length increment (mm), = number of cycles increment, = material constant, and = stress intensity factor range . Then, system differential equation was solved where
where and
.
Meanwhile, the crack did not propagate during duty cycle
,
where the probability value was . However, when the duty cycle , the crack propagated and the probability value was . Thus, the probability distribution followed the geometric distribution as follows:(7)
Lastly, Markov property value was computed by using Equation (8).
(8)
Equation (8) explains the probability is changing due to change in time. A comparison can be made for several times in order to know the probability in the future in any time (duty cycle), . This study focuses on the performance of the Markov Chain model to estimate the probability distribution of damage state.
3.
Fatigue crack growth data
Fatigue crack growth data are required to explain the applicability of the probabilistic models. The methodology was demonstrated using the experimental observations from a material of Aluminium alloy A7075-T6. Ten specimens were tested in the experiment; the dimensions of the specimens are 160.0 mm wide and 60.0 mm thick. The experiment was tested at room temperature under constant amplitude loading of 45kN stress load and 0.1 fixed stress ratios in order to observe the fatigue crack growth on the surface of the material. The use of 45kN ensures that it exceeded the endurance limit load which is to affirm that fatigue occurs for the dimension of this material. The length of the crack growth of the ten specimens was measured using the digital calliper and the length taken is the average of five times measurement. The results from the experiment as in Fig. 2 shows there were five stages of fatigue crack
growth starting from initial crack length and end with failure part.
Fig. 2: Material surface of the aluminium alloy 7075-T6 from the experiment
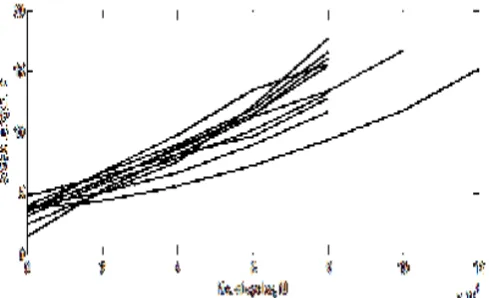
Fig. 3 depicts the crack lengths against the number of cycles for ten specimens from the experiments. It shows scattering for the initial crack lengths from specimen to specimen variability. The probability distribution for the initial crack was determined to represent the scatter of the data.
Fig. 3: Crack length versus number of cycles
4.
Results and discussion
In this paper, probability distribution for damage state was demonstrated by using Markov property. Markov Chain model was constructed with duty cycles are 2000 cycles and . The probability distribution of initial state and transition probability matrix were discussed as follows. Fig. 4 explains the probability values of initial state, which was derived from the lognormal distribution with parameter estimation = 4.34 and = 10.525. States are defined as the crack length increment. The state starts with initial crack length part and ends with failure part. The highest probability value of initial crack length implies logically at the first and second state, that is 66% and 33%, respectively. Then, the values decrease gradually through the states with all of the values are approximately 0%. It can be concluded that
Initial crack Failure
the initial crack length could occur in other states, except at the first and second state.
Fig. 4: Initial probability values for each state
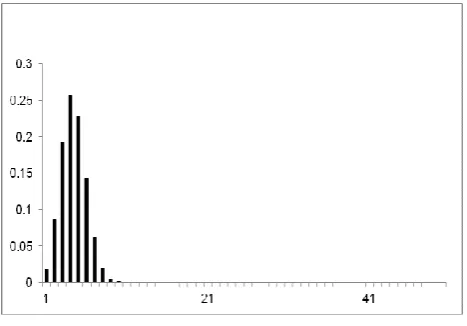
The transition probabilities matrix was calculated from the classical Paris law equation. The resulting matrix was used to determine the probability distributions for interesting fatigue crack lengths. A simple example was given as an illustration of the Markov Chain model. It is assumed that the number of damage states is 50 and the state of damage was considered after 10 duty cycles.
Fig. 5: Probability distribution of the states
The probability distribution was computed using Equation 6. Since the values of initial state vector are similar, it is possible to present a comparison between the probability distributions of the state damage. The results shown in Fig. 4 and Fig. 5 indicate the probability of being in a state, e.g. state 1, after 10 duty cycles depends on the transition probability, for instance, the probability of being in state 1 is changing from the initial value 33% to only 8.7%.
Lastly, the performance of the model is shown in Figs. 6 and 7. The model has a good agreement with the empirical data and the results show that the proposed model is excellent at the beginning of number of cycles due to the probability distribution of the initial crack length was considered . No random factor was integrated
in the probability transition matrix. The random factor only considered for initial probability distribution.
7.5 8 8.5 9 9.5 10 10.5 11 11.5 12 x 104 0
0.2 0.4 0.6 0.8 1
F
(x
)
Empirical MC
Fig. 6: Comparison of MC model and ECDF for life estimation of 9mm
1 1.05 1.1 1.15 1.2 1.25 1.3 1.35
x 105
0 0.2 0.4 0.6 0.8 1
F
(x
)
Empirical MC
Fig. 7: Comparison of MC model and ECDF for life estimation of 16mm
0 0.5 1 1.5 2 2.5
x 104 0
0.2 0.4 0.6 0.8 1
F
(x
)
Empirical MC
Fig. 8: Comparison of MC model and ECDF for life estimation of 12mm, 16mm and 20mm, respectively.
empirical cumulative distribution function. Thus, the Markov Chain model is a good model in predicting the fatigue lifetime of Aluminum Alloy A7075-T6 even under different environment of experiment.
5.
Conclusion
The probability distribution of the damage state of the material aluminium alloy, A7075-T6 was analyzed using Markov Chain model. The factors that contribute to the fatigue are the probability distribution of initial crack length and the stress intensity factor that includes the width and the length on the specimen, the number of loading cycles and the stress ratio. The probability distribution of the initial crack length is important to determine probability distribution for interesting fatigue crack length due to the uncertainty factors for this variable. This study only focuses on the deterministic factor for calculating the transition probability matrix. It is suggested that random factors are included in the model to calculate the transition probability matrix and analyze the performance of the model for capturing fatigue life prediction. One of the advantages of the Markov Chain model is the capability of the model in capturing the results. By using the Markov property where all the parameter values are determined, the probability of state of damage in the given structure is available at any time, .
References
[1] Le, K., Fouladirad, M., Barros, A., and Levrat, E. Remaining useful life estimation based on stochastic deterioration models : A comparative study.
Reliability Engineering System Safety, Vol. 112, 2013 , pp. 165–175.
[2] Eskandari-naddaf, H., Gharouni-nik, M., and Pakzad, A. Lifetime Analysis on Centrifugal ID Fan Foundation in Cement Plants. International Journal of Integrated Engineering, Vol. 10, 2018, pp. 57–61. [3] He, P., Hong, R., Wang, H., and Lu, C. Fatigue life analysis of slewing bearings in wind turbines.
International Journal of Fatigue, Vol. 111, 2018, pp. 233–242.
[4] Lan, C., Bai, N., Yang, H., Liu, C., Li, H., and Spencer, B. F. Weibull modeling of the fatigue life for steel rebar considering corrosion effects.
International Journal of Fatigue, Vol. 111, 2018, pp. 134–143.
[5] Shiraiwa, T., Briffod, F., and Enoki, M. Development of integrated framework for fatigue life prediction in welded structures. Engineering Fracture Mechanics, Vol. 198, 2017, pp. 158–170. [6] Castro, I.T. A periodic inspection and replacement
policy for systems subject to competing failure modes due to degradation and traumatic events.
Reliability Engineering System Safety, Vol. 96, 2011, pp. 497–508.
[7] Zhou, B. R. R., Serban, N., and Gebraeel, N. Degradation Modeling Applied to Residual Lifetime. The Annals of Applied Statistics, Vol. 5, 2011, pp. 1586–1610.
[8] Ismail, A. E. Mode I stress intensity factors for slanted cracks in round bars. International Journal of Integrated Engineering, Vol. 8, 2014, pp. 1–8. [9] Kocańda D., and Jasztal, M. Probabilistic predicting
the fatigue crack growth under variable amplitude loading. International Journal of Fatigue, Vol. 39, 2012, pp. 68–74.
[10] Ellyin, F. Fatigue Damage , Crack Growth and Life Prediction. (1997). Chapman & Hall, 2-6 Boundary Row, London SE18HN, UK.
[11] T. L. Becker, R. M. Cannon, and R. O. Ritchie,
Statistical fracture modeling: Crack path and fracture criteria with application to homogeneous and functionally graded materials, Vol. 69, 2002, pp. 14–16.
[12] Li, B. C., Jiang, C., Han, X., and Li, Y. A new approach of fatigue life prediction for metallic materials under multiaxial loading. International Journal of Fatigue, Vol.78, 2015, pp. 1–10.
[13] Wu W. F., and Ni, C. C. Probabilistic models of fatigue crack propagation and their experimental verification. Probabilistic Engineering Mechanics,
Vol. 19, 2004, pp. 247–257.
[14] Makkonen, M. Predicting the total fatigue life in metals. International Journal of Fatigue, Vol. 31, 2009, pp. 1163–1175.
[15] Rastogi, R., Ghosh, S., Ghosh, A. K., Vaze, K. K., and Singh, P. K. Fatigue crack growth prediction in nuclear piping using Markov chain Monte Carlo simulation. Fatigue & Fracture of Engineering Materials & Structures, 2016, pp. 1-12.
[16] Wu W. F., and Ni, C. C. A study of stochastic fatigue crack growth modeling through experimental data. Probabilistic Engineering Mechanics. Vol. 18, 2003, pp. 107–118.
[17] Gansted, L., Brincker, R., and Hansen, L. P. Fracture mechanical Markov chain crack growth model. Engineering Fracture Mechanics, Vol. 38, 1991, pp. 475–489.
[18] Kozin F., and Bogdanoff, J. L. On the probabilistic modeling of fatigue crack growth. Engineering Fracture Mechanics, Vol. 18, 1983, pp. 623–632. [19] Januri, S. S., Nopiah, Z. M., Romlay, M. A. M.,
Ihsan, A.K.A.M., Masseran, N., and Abdullah, S. Statistical distribution for initial crack and number of loading in fatigue crack growth process.
International Journal of Advanced and Applied Sciences. 2017, pp. 1–9.
![Fig. 1: Markov Chain model with a circle represents a state. and are probabilities in a particular state and changing state, respectively [17]](https://thumb-us.123doks.com/thumbv2/123dok_us/8438163.1700298/2.595.64.270.437.493/markov-chain-circle-represents-probabilities-particular-changing-respectively.webp)