QoS-aware Energy Efficient Cooperative Scheme
for Cluster-based IoT Systems
Liumeng Song, Student Member, IEEE, Kok Keong Chai, Member, IEEE, Yue Chen, Member, IEEE, John
Schormans, Member, IEEE, Jonathan Loo, Member, IEEE, Alexey Vinel, Senior Member, IEEE
Abstract—The Internet of Things (IoT) technology with huge number power-constrained devices has been heralded to improve the operational efficiency of many industrial applications. It is vital to reduce the energy consumption of each device, however, this could also degrade the Quality of Service (QoS) provisioning. In this paper, we study the problem of how to achieve the tradeoff between the QoS provisioning and the energy efficiency for the industrial IoT systems. We first formulate the multi-objective optimization problem to achieve the objective of balancing the outage performance and the network lifetime. Then we propose to combine the Quantum Particle Swarm Optimization (QPSO) with the improved Non-dominated Sorting Genetic algorithm (NSGA-II) to obtain the Pareto optimal front. In particular, NSGA-II is applied to solve the formulated multi-objective optimization problem and QPSO algorithm is used to obtain the optimum cooperative coalition. The simulation results suggest that the proposed algorithm can achieve the tradeoff between the energy efficiency and QoS provisioning by sacrificing about 10% network lifetime but improving about 15% outage performance.
Index Terms—Industrial IoT system, cluster, cooperative com-munication, network lifetime, QoS, QPSO, NSGA-II.
I. INTRODUCTION
I
NTERNET of Things (IoT) system is viewed to havepotential to improve the operational efficiency of many industrial applications. There is an increasing need of huge number of reliable devices equipped with short-range radio interfaces, such as IEEE 802.15.4 and IEEE 802.11ah. to provide connectivity to other devices in IoT systems in order to maintain the operational efficiency.
Capillary network was introduced to improve reliable and energy efficient communications for the IoT systems. Capillary network is a specific local network consists of a group of wireless devices to be connected to the other communication infrastructure such as mobile networks [1]. It uses clustering mechanism to reduce the transmission distance between the sink node and devices, as typically the cluster head (CH) is close to all the nodes in each cluster. Clustering mechanism organizes the devices into different clusters and selects CHs, and consequently transmits the aggregated data from the CHs to the sink node via communication infrastructure networks. However, the CHs consume more energy as compared to other devices in the networks as they take more responsibility and dissipate additional energy to transmit aggregated data to the sink node.
In principle, cooperative communications aim at improving effective energy efficiency [2], overall throughput [3], power control [4] and resource allocation [5] in wireless
network-s. One form of cooperative communications known as co-operative multiple-input-single-output (CMISO) transmission scheme is used for the long-haul transmission between the cluster and the sink node [6] to help release the transmission burden of CH. CMISO increases the spatial diversity of wireless channels by introducing additional cooperative nodes (Coops) to help CH in long-haul transmission which is the most energy consuming phase of the communication between the cluster and the sink node. The Coops and CH form a virtual MISO system in the long-haul transmission by decode-and-forward technique, with the objective of evenly energy distribution among the networks. Despite the advantages of CMISO scheme, it reduces the transmit power and thus degrades the QoS performance of long-haul communication in the capillary network. However, QoS provisioning could be further improved but requires higher energy consumption.
The aforementioned challenges raise the concerns of the tradeoff between energy consumption and QoS provisioning in the cluster-based IoT systems. In addition, most literature measure the energy efficiency with energy consumption under several constraints such as bit error rate and power control, instead of network lifetime. The capillary network lifetime is defined as the duration from the deployment of the capillary network to the time that the battery of the first device is fully drained [7]. It reflects not only the energy consumption of the whole network but also the fairness of energy consumption among individual devices.
The main contributions of the paper are summarized as following:
• First, considering most recent literature (see Section II for further detail) aim at energy efficiency or QoS provisioning optimization only and the fact that the QoS provisioning could be further improved at the cost of the energy consumption , we formulate a multi-objective optimization problem of the tradeoff between QoS provi-sioning and energy efficiency. In this paper, we use outage performance and network lifetime as the metric for QoS provisioning and energy efficiency respectively.
convergence and low complexity of QPSO, we formulate the possible cooperative coalitions by the quantum-coded particles. In order to select the optimum Coops for the potential CH candidate, the quantum-coded particles are flown through the 2-dimensional search space by updating the fitness values of network lifetime and outage performance until reaching the pre-defined generation.
• Third, to solve the multi-objective optimization of QoS provisioning and energy efficiency, the improved Non-dominated Sorting Genetic Algorithm (NSGA-II) is used in this paper. Unlike the scalarization method where multiple objectives are combined to form one objective by user-determined weight factors, NSGA-II applies non-dominated sorting and crowding distance mechanism to obtain a good quality and uniform spread nondominated solution set. The NSGA-II algorithm has been proven to be able to maintain a better spread of solutions and converge better in the obtained non-dominated front compared with evolutionary algorithm such as Pareto-archived evolution strategy (PAES) and strength-Pareto EA (SPEA) [9].
• Fourth, we combine QPSO algorithm with NSGA-II
to obtain the Pareto optimal front. To the best of our knowledge, the use of QPSO-based NSGA-II theory and how it is applied to select the cooperative coalition in the capillary networks has not been investigated. In particular, the fitness values are computed and updated through the QPSO algorithm by selecting different devices as Coops. On the other hand, the Pareto optimal front is generated and sorted according to the obtained fitness values by NSGA-II.
The rest of this paper is organized as follow. In Section II, we present the related work. Section III introduces net-work model, system model and power consumption model. In Section IV, the problem formulation is given in detail. Then in Section V, we explain the procedure of QPSO algorithm and how to apply QPSO to obtain the optimum Coops for specific CH. Simulation results are provided in Section VI, and conclusions are drawn in Section VII.
II. RELATED WORK
The cooperative communications for cluster based networks has also been introduced to achieve different objectives in-cluding energy efficiency and Quality of Service (QoS) with the consideration of channel interference, node location and residual energy.
In [10], authors proposed a cluster formation scheme based on Low Energy Adaptive Clustering Hierarchy (LEACH) algo-rithm in CMISO network that considering residual energy and the distance between every node to the sink node to minimize energy consumption as well as to balance energy consumption across the whole network. The number of Coops is determined by the distance between the CH and the sink node, and Coops are selected from the cluster nodes (CNs) with most residual energy within the cluster. In [11], authors proposed a fair cooperative communication scheme which encourages nodes to participate in cooperative communication by giving an extra
reward. The Coops are selected if two conditions are satisfied: the first is that signal-to-noise ratio (SNR) of the received signal of Coop is larger than a predefined SNR threshold level, and the second condition is that Coop is within the transmission domain of the destination cluster. In [12], the authors analyzed the overall system performance in terms of packet error rate (PER) in the cluster-based cooperative com-munication system and proposed a novel node sleep strategy to minimize the overall energy consumption under certain PER threshold. However, [10–12] only considered several Coops selection constraints instead of the cooperation benefit with CH.
In [13] [14], the authors proposed a cluster-based CMISO communication with LEACH protocol [15]. However, LEACH only selects CHs with a certain probability and does not consider residual energy and location of nodes. In [16], the authors designed a cooperative communication scheme to achieve the optimal solution of a random tradeoff between QoS provisioning and the energy efficiency by the Lambert W function and coalition formation game theory. In [13], the authors assume both CH and Coops are selected randomly, while in [14] and [16], the authors assume all the CHs are always located in the center of the network.
III. SYSTEM MODEL
A. Network Model
The power-constrained wireless devices in the capillary networks of the IoT system are randomly distributed in a two-dimensional space with following assumptions:
• All wireless devices perform data collection task period-ically and always have data to send to the sink node.
• All wireless devices are homogeneous and energy con-strained.
• All wireless devices are capable of adjusting their trans-mit powers dynamically to reach the intended recipients with the minimum required energy.
• All wireless devices are aware of their geographical locations and residual energies.
• All wireless devices are equipped with short-range local area wireless radio, e.g. IEEE 802.15.4.
• All devices are classified into three kinds of nodes: CH, CNs and Coops.
• All devices are capable of operating in data collection and aggregation mode as well as cooperative transmission mode.
• A static capillary gateway is equipped with two radio interfaces: the local area capillary radio to communicate with the capillary network and the cellular radio to communicate with the industrial IoT systems.
Set-up Steady state Frame
Round 0 Round 1
...
...
...
...
Data collection
Local broadcasting
Long-haul CMISO
Fig. 1: Transmission structure in cluster-based IoT system
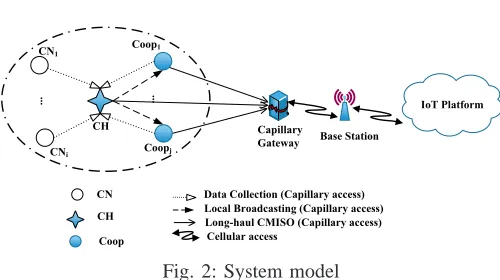
• Data collection phase (DC): CH collects and aggregates data from all the other devices, including both CNs and Coops.
• Local broadcasting phase (LB): CH broadcasts the aggre-gated data to all Coops.
• Long-haul cooperative transmission phase (LH): CH and Coops jointly transmit the aggregated data to the sink node based on the distributed space time codes (DSTC) which is a cooperative technique investigated in [17] such that CH and Coops share their antennas to create a virtual array through distributed transmission and signal processing.
Phase LB and LH form the CMISO transmission.
B. System Model
CN1
CNi
... ...
CH Coop1
Coopj
Data Collection (Capillary access) Local Broadcasting (Capillary access) Long-haul CMISO (Capillary access)
Capillary
Gateway Base Station
IoT Platform
Cellular access CN
CH
Coop
Fig. 2: System model
The system model considers a capillary networks for IoT system withN devices: one CH,iCNs andjCoops as shown in Fig.2, where N = 1 +i+j. All devices are randomly distributed over the same cluster and the set of all devices are denoted by η = {CH, CN1,· · · , CNi, Coop1,· · ·, Coopj}. The channels ofCNiandCoopj toCH, denoted byhCH,CNi
and hCH,Coopj respectively and the channels between all
transmitting nodes within the cluster (CH andCoops) to the sink node, denoted by hsink, are all modeled by Rayleigh-fading with square-law path loss. We assume that CH, CNs and Coops in the same cluster know their channel conditions and the distances between each transmitting node in the cluster and the sink node, which is also known as long-haul distance denoted byd, are the same.
C. Power Consumption Model
In this paper, we use the power consumption model as defined in [18]:
p=pa+pc, (1)
wherepis the power consumption of an individual device,pa is the power consumption of the power amplifiers andpcis the power consumption of all the other circuit blocks. Specifically, pa is dependent on the transmit power pt. Without loss of generality,pa = (1 +α)pt, where αis a constant depending on RF power amplifier and modulation scheme. And pc is composed of transmitter circuit blocks power consumption denoted bypct, and receiver circuit blocks power consumption denoted bypcr.
1) The Data Collection Phase Power Consumption: In the Data Collection (DC) phase, CH acts as receiver dissipating power of receiver circuit blocks, while all other devices (CNs and Coops) transmit data to CH, dissipating power of power amplifiers as well as power of transmitter circuit blocks. Therefore, the power consumption for CH, CNs and Coops in this phase respectively, are
pDCCH=pDCcr,CH, (2)
pDC
CNi =p
DC a,CNi+p
DC
ct,CNi= (1 +α)p
DC t,CNi+p
DC
ct,CNi, (3)
pDCCoopj =p
DC a,Coopj+p
DC
ct,Coopj = (1 +α)p
DC t,Coopj+p
DC ct,Coopj.
(4) 2) The Local Broadcasting Phase Power Consumption: In the Local Broadcasting (LB) phase, CH acts as transmitter to broadcast the aggregated data to Coops, dissipating power of power amplifiers as well as power of transmitter circuit blocks, and Coops receive data information from CH, dissipating power of receiver circuit blocks, while CNs do not participate in this phase. Therefore, the power consumption for CH, CNs and Coops in this phase respectively, are
pLB
CH =pLBa,CH+pLBct,CH= (1 +α)pLBt,CH+pLBct,CH, (5)
pLBCNi = 0, (6)
pLBCoopj =p
LB
cr,Coopj. (7)
3) The Long-haul Cooperative Transmission Phase Power Consumption: In the Long-haul Cooperative Transmission (LH) phase, CH and Coops jointly transmit data to the sink node, dissipating power of power amplifiers as well as power of transmitter circuit blocks, while CNs do not participate in this phase. Assuming energy of the gateway is infinite, the energy consumption by the gateway can be omitted. Therefore, the power consumption for CH, CNs and Coops in this phase respectively, are
pLHCH =pLHa,CH+pct,CHLH = (1 +α)pLHt,CH+pLHct,CH, (8)
pLB
CNi = 0, (9)
pLHCoopj =p
LH a,Coopj+p
LH
ct,Coopj = (1 +α)p
LH t,Coopj+p
LH ct,Coopj.
D. Transmit Power
1) Transmit Power of the Data Collection Phase: As re-ferred to [19], the transmit power ofCNi andCoopj denoted by pDC
t,CNi/Coopj can be derived from
log2 1 +|hCH,CNi/Coopj|
2 p
DC
t,CNi/Coopjκ
σ2 d
CH,CNi/Coopj δ
!
≥RDC,
(11) whereRDC is the channel capacity,σ2 is the Gaussian noise variance, d is the distance between the source device and destination device, κ is a constant which depends on the propagation environment, δ is the path loss parameter and
h∼CN(0,1) is unitary power, Rayleigh fading coefficients
for all intra-cluster connections. In order to improve energy efficiency, we set Eq.(11) to be the lower bound, that is,
pDC
t,CNi/Coopj =
(2RDC −1)σ2κ−1 d
CH,CNi/Coopj δ
|hCH,CNi/Coopj|2
. (12)
2) Transmit Power of the Local Broadcasting Phase: In terms of the CMISO transmission, as referred to [20], the outage probability Pout under a predetermined transmission
rate R, can be expressed as
Pout= Pr{log2(1 +|hs,d| 2 ptκ
σ2dδ)< R},
= Pr{|hs,d|2< (2
R−1)σ2dδκ−1
pt
}.
(13)
In order to guarantee the QoS requirement, the outage proba-bilityPoutshould not be larger than the threshold valuePthr
out, the corresponding outage capacity is defined as
Cout= sup{R:Pout ≤ Poutthr}. (14) Eq.(14) represents the largest rate Cout that can be sustained
over all the channel states except over a subset with probability Pthr
out. Thus, we can rewrite Eq.(13) by
Pout= Pr{|hs,d|2<(2
Cout−1)σ2dδκ−1
pt
}. (15)
Denote the number of transmit devices to be nt. Since |hs,d|2 ∼ X2
2nt (i.e., chisquare distributed R.V. with 2nt
degrees of freedom) and the cumulative distribution func-tion (cdf) of X2
2nt is the regularized incomplete Gamma
function [21], i.e. FX2
2nt(b) = γ(1, b), where γ(nt, b) =
1 (nt−1)!
Rb
0xnt
−1e(−x)dx, we have
Pout=γ(nt,
(2Cout−1)σ2κ−1dδ
pt
). (16)
Due to the broadcasting nature of wireless channel, once the cooperative node Coopj with the worst channel receives data from CH, other Coops can receive the data simultaneously. As referred to [22], the data received by all Coops needs to be decoded correctly, and the transmit power pLB
t,CH can be
derived from
RLB≤
1
2log2(1 +|hCH,Coopj|
2 p
LB t,CHκ σ2dδ
CH,Coopj
). (17)
As referred in [23], RLB cannot be lower than the long-haul transmission rateCout, hence we have,
Cout≤RLB. (18)
In addition, due to the broadcast nature of wireless channel, if the Coop with the worst channel condition (denoted by Coopw) can receive the data, other Coops can also receive it simultaneously. Therefore the transmit powerpLB
t,CH can be derived from
1
2log2(1 +|hCH,Coopw|
2 p
LB t,CHκ σ2dδ
CH,Coopw
)≥Cout. (19)
In order to reduce energy consumption, we set Eq.(19) to be the lower bound, that is,
pLBt,CH =
(22Cout−1)σ2κ−1dδ
CH,Coopj
|hCH,Coopw|
2 . (20)
3) Transmit Power of the Long-haul Cooperative Transmis-sion Phase: Based on DSTC, each transmitting device has the same transmit power, thus,pLH
t,CH =pLHt,Coopj =p
MISO t (J+1) , that is
Pout,miso =γ(j+ 1,(2
2Cout−1)σ2κ−1dδ
miso
pMISO
t (j+ 1)
). (21)
IV. PROBLEM FORMULATION
The objective is to strike a balance between energy efficien-cy and QoS provisioning. As illustrate in [16], the design of CMISO communication scheme falls into two categories:
• The optimization of QoS provisioning subject to a energy constraint.
• The minimization of energy consumption (or the network lifetime prolonging) subject to a QoS provisioning con-straint.
However, the QoS provisioning could be further improved at the cost of the energy consumption, and vice versa. Hence, there exists a tradeoff between the energy efficiency and the QoS provisioning. In this paper, we adopt network lifetime to represent energy efficiency and the outage performance to represent the QoS provisioning in long-haul transmission.
A. The Network Lifetime
Denote the energy consumption of a device during the communication process in unit time by e, we have,
e= 1
N ×p
DC+ 1 2N ×p
LB+ 1 2N ×p
LH. (22)
The lifetime of an individual device is,
T = E
e, (23)
where E is residual energy of the device when setting up a scenario. DenoteTCH,TCNiandTCoopj to be the lifetime of
CH,CNi andCoopj respectively. The network lifetime denoted byTnet is
Tnet= min{TCH, TCN1,· · ·, TCNi, TCoop1,· · ·, TCoopj}.
B. QoS Provisioning
The outage performance can be formulated by Eq.(25).
J=Poutthr−Pout,CH/Coopj,
=Pthr
out−γ(j+ 1,
(22Cout−1)σ2κ−1dδ
miso
pMISO
t (j+ 1) ),
s.t. J≥0,
Et≥
1 N
N X
i=1 pDCi +
1 2N
N X
i=1 pLBi +
1 2N
N X
i=1 pLHi ,
(25)
wherePthr
out is the maximum outage probability threshold and Et is the maximum energy constraints of network communi-cation. LetB= (22Cout−1)σ2κ−1dδ
miso, which should be a constant after scenario setting up. Therefore, we have,
J =Poutthr−γ(j+ 1,
B(j+ 1)
pMISO
t
). (26)
By making the derivative of J with respect to pMISO t , we obtain,
∂J
∂pMISO
t
=B j+1e−
B pM ISO
t
j!(pMISO
t )
j+2. (27)
By making the second derivative ofJ with respect topMISO t , we obtain,
∂2J (∂pMISO
t )
2 =−
Bj+1e−
B pM ISO
t
j!(pMISO
t )
j+4(j+ 2− B
pMISO
t
). (28)
Sincej+2− B
pM ISO t
is positive, Eq.(25) is a concave optimiza-tion problem, that is, the optimum outage performance can be obtained using numerical methods.
C. The Multi-Objective Optimization Problem Formulation
The tradeoff between energy efficiency and QoS provision-ing research problem can be expressed as
{ CH,1, . . . , Coopj}= argmax{Tnet, J}. (29)
V. QPSO-BASEDNSGA-IIALGORITHM
A. Quantum Particle Swarm Optimization
PSO is an evolutionary computing technique based on bird flocking principle. QPSO uses quantum coding mechanism to encode each particle by a quantum bit. In [24], a quantum bit is defined as a pair of composite numbers (α, β), where |α|2+|β|2= 1andα >0,β >0.|α|2 gives the probability that the quantum bit is found in ′0′ state and |β|2 gives the probability that the quantum bit is found in ′1′ state. Then
the quantum velocity of them−thparticle at generationtis defined as
vmt =
"
αt m1 βt
m1 αt
m2 βt
m2 · · · · · ·
αt mR βt
mR
#
, (30)
where m ∈ [1,2,· · ·, h], h is the number of particles and R = 1 +i+j which represents number of devices in the
network. Since βmn =
p
1−α2
mn, we can simplify Eq.(30) as
vmt = [ αtm1 αtm2 · · · αtmR ]. (31)
The quantum particle position according to Eq.(31) can be expressed as
xtmn=
(
1 if δmn>(αtmn) 2
0 if δmn≤(αtmn)
2 , (32)
whereδmn∈[0,1]is uniform random number. In this paper, the quantum position indicates whether the device n is a member of the cooperative coalition in particlem: xt
mn= 1 represents that devicenin particlemis a Coop at generation
t; otherwise, device nin particle m is a CN at generationt.
Therefore each particle in this paper represents a candidate solution of a particular cooperative coalition and a group of CNs, and the fitness value of each particle can then be obtained by Eq.(23) and (25).
Denote the fitness value of particle m at generation t to be ft
m , then the local individual optimum fitness value fm and the corresponding local individual optimum positionpm is defined as below,
fm= min{fm1, fm2,· · ·, fmt}, (33)
pm= [pm1,· · ·, pmn,· · · , pmR]. (34)
Similarly, the global optimum fitness valuefg and the corre-sponding global optimum positionpg is defined as below,
fg= min{f1,· · ·,fm,· · · ,fh}, (35)
pg= [pg1,· · ·, pgn,· · ·, pgR]. (36)
At generationt+1, the quantum rotation angleθt+1
mn is updated by
θmnt+1=e1(pmn−xmnt ) +e2(pgn−xtmn), (37)
wheree1 ande2are two positive learning factors of cognitive and social acceleration factors respectively.
Ifθt+1
mn 6= 0, the updated velocity ofm−thquantum particle att+ 1generation is,
vmnt+1=|αtmn×cosθmnt+1−
q
1−(αt mn)
2
×sinθt+1mn|. (38)
If θt+1
mn = 0 and r =c1, the updated velocity of m−th quantum particle att+ 1 generation is,
vt+1mn =
q
1−(αt mn)
2
. (39)
B. NSGA-II algorithm
As referred to [25], in a maximization problem, a vec-tor x = [x1, x2,· · ·, xp]T is said to dominate y = [y1, y2,· · ·, yp]T, denoted by x ≻y, if ∀i ∈ {1,2, . . . , p} : xi≥yi and∃i∈ {1,2, . . . , p}:xi > yi. That is, no value in
yis more thanxand at least one value ofxis strictly greater thany. Similarly, in a multi-objective maximization problem, a solution x∗ is said to dominatex, if∀i∈ {1,2, . . . , M} : fi(x∗) ≥ fi(x) and ∃i ∈ {1,2, . . . , M} : fi(x∗) > fi(x). That is, a solution x∗ is Pareto optimal if there exists no feasible solutionxwhich would increase some criteria without causing a simultaneous decrease in at least other criterion. The NAGA-II is proposed to be an effective algorithm to find the Pareto optimal solutions.
In NSGA-II [9], each solution has two entities:
• Domination countnp, which is defined as the number of solutions which dominate individual p.
• Sp, which is the set containing all the individuals that are being dominated byp.
The non-dominated sorting focus on identifying all fronts, which is described as below:
i) Evaluate the population according to fitness value. ii) Identify the first nondominated front denoted by F(1).
That is,∀i, ni= 0, i∈F(1), whereiis thei−thsolution andF(1) is the first non-dominated front.
iii) For each solutioni in F(1), visit each member q of its domination set Si. For every memberq, whereq ∈ Si, nq = 0, nnewq = nq −1. Put q in a separate list Q if
nnew
q = 0. The members inQbelong to the second non-dominated frontF(2).
iv) Visit each member in F(2) and repeat Step ii) until all fronts are identified.
[9] also proposed crowding distance to maintain the diver-sity among population members. The crowding-distance is the average distance of two points along each of the objectives. The crowding-distance computation requires sorting the pop-ulation according to each objective value in ascending order of magnitude for every front. Therefore, for each objective function, the boundary solutions (solutions with smallest and largest function values) are assigned an infinite distance value. All other intermediate solutions are assigned a distance value equal to the absolute normalized difference in the function values of two adjacent solutions. The calculation is continued with other objective functions. The overall crowding distance value is calculated as the sum of individual distance values corresponding to each objective. From the description of non-dominated sorting and crowding distance, we can see that the solutions with better front and larger crowding distance are better than others.
C. QPSO-based NSGA-II algorithm
In this paper, we formulate the possible cooperative coali-tions to be quantum-coded particles which are flown through the 2-dimensional search space. Each particle has several attributes: the rotation angle, the current velocity, the current position, the local optimum position and the global optimum
position. The current position of the particle suggests the Coops selection. In order to joint optimize the network lifetime and QoS provisioning, we apply NSGA-II to search the Pareto-optimal particle solutions by setting the fitness values to be network lifetime and the outage performance. Besides, exhaustive search is used to find the optimal CH by assuming every device in the cluster to be CH. The QPSO-based NSGA-II algorithm can be summarized in the following steps:
• Step 1: Assume every device to be CH in turn and operate the following steps to select the optimum Coops for the assumed CH.
• Step 2: Initialize a populationS withhquantum particles based on quantum coding mechanism. Specifically, The current position and velocity of every particle is randomly generated. The local optimum position of the particle is equal to the current position of the particle.
• Step 3: Evaluate each quantum particle by the fitness value of both objectives: network lifetime and the long-haul transmit power. Sort population S according to dominated sorting scheme in NSGA-II. Choose non-dominated solutions from the first Pareto front to the
last Pareto front and add them into P which is an
external memory to store non-dominated solutions with the maximum pre-defined size N0. The global optimum position pg is chosen from the top part of P (i.e. top 5%) randomly.
• Step 4: Generate a new populationSnew through QPSO algorithm from S. Renew the quantum rotation angle of each quantum particle by Eq.(37). Update pm and
pg correspondingly from Eq.(33) to Eq.(36). Update the quantum position of each particle by Eq.(32). Updatepm andpg correspondingly from Eq.(33) to Eq.(36).
• Step 5: Evaluate each quantum particle of the new popula-tionSnewby the fitness value of both objectives: network lifetime and the long-haul transmit power. Combine the current population and the parent population and form a new population, that is,S∗
new=Snew∪S. Sort the new population S∗
new according to non-dominated sorting scheme in NSGA-II. Select non-dominated solutions and add them to Q which is an external memory similar to
P.
• Step 6: CombineQandP to form a new Pareto solution memory set S¯, that is, S¯ =P ∪Q. Sort S¯ according to non-dominated sorting scheme in NSGA-II. Calculate the crowding distance and sort the solutions according to the crowding distance in each front in a descending order. Limit the size of S¯ to be N0 by selecting the formerN0Pareto solutions and rejecting the others. The global optimum is chosen from the top part ofS¯(e.g. top 5%) randomly and the local optimum of each particle is chosen fromS¯randomly.
• Step 7: Replace S by Snew to participate in the next generation.
2000 250 300 350 400 450 200
400 600 800 1000 1200 1400 1600
Long−haul distance (m)
Network Lifetime(s)
Proposed NSGAQPSO QPSO
SISO
Fig. 3: Network lifetime vs. long-haul distance
10−6 10−5 10−4 200
400 600 800 1000 1200
Outage Probability Threshold
Network Lifetime(s)
Proposed NSGAQPSO QPSO
SISO
Fig. 4: Network lifetime vs. outage probability threshold
200 250 300 350 400 450 0
0.002 0.004 0.006 0.008 0.01 0.012
Long−haul distance (m)
Long−haul transmit power (W)
Proposed NSGAQPSO QPSO
SISO
Fig. 5: Transmit power vs. long-haul distance
10−6 10−5 10−4
0 1 2 3 4 5 6 7x 10
−3
Outage Probability Threshold
Long−haul transmit power (W)
Proposed NSGAQPSO QPSO
SISO
Fig. 6: Transmit power vs. outage probability threshold
¯
S are Pareto front solutions.
• Step 9 Repeat Step1 to Step8 until finding the optimum cooperative coalition for every CH. Add all Pareto front solutions obtained in Step 8 for each CH in external memory Sf inal with the maximum pre-defined sizeN0. Sort Sf inal according to non-dominated sorting scheme in NSGA-II. Calculate the crowding distance and sort the solutions according to the crowding distance in each front in a descending order. The former N0 Pareto front solutions in sortedSf inal are the optimum ones.
VI. SIMULATION
The simulation tool used in this paper is Matlab. There are 10 wireless devices randomly distributed within a circle of 100 meter radius. We adopt circuit power consumption model in paper [18]. The constant κ is set to 1, the path loss parameter δ is set to 3, the Gaussian noise varianceσ2 is 10−12 W, the capacity C
out and RDC is 1.4 b/s/Hz. The initial residual energy of each device is between 1J to1.5J randomly. Besides, we adopt circuit power consumption model in paper [18]. For QPSO, the maximum generation is set to 100, the number of particlehis 20, learning factorse1ande2 are 0.06 and 0.03 respectively, and the mutation probabilityc1 is 1/300. For NSGA-II, the buffer size N0 is 20.
To verify the proposed joint optimization algorithm, we simulate and compare the results with the QPSO single objective optimization scheme (QPSO network lifetime op-timization and QPSO long-haul transmit power opop-timization) as well as the single-input-single-output transmission scheme between the cluster and the gateway, i.e. LEACH [15]. The fitness values are implemented by Eq.(23) and Eq.(25). In QPSO algorithm, we simulate particles by following attributes: particle position in Eq.(32), the rotation angle in Eq.(37), and the velocity in Eq.(38) and Eq.(39). For each generation, the particle velocity and position are updated according to the rotation angle. The particles position can suggest the Coops selection in each generation, and fitness value can then be updated correspondingly based on different Coops selection. In NSGA-II, we implement the non-dominated sorting and crowding distance calculation to obtain the Pareto optimal front by the updated fitness values obtained in QPSO. Then, the global optimum and local optimum are updated by the the
Pareto optimal front, which are the two variables to update the rotation angle in Eq.(37).
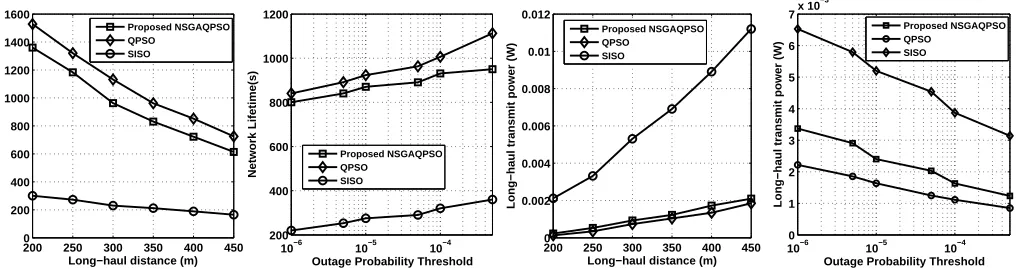
First, we observe that the network lifetime with different long-haul distance in Fig.3. The outage probability threshold isPthr
out = 10
−3. In Fig.3, the network lifetime of both
algo-rithms decreases significantly with respect to long-haul dis-tance, as more long-haul transmit power is required. Besides, the network lifetime of QPSO network lifetime optimization algorithm is better than that of the proposed NSGAQOSP algorithm, due to higher long-haul transmit power of the pro-posed NSGAQOSP algorithm. Note that both CMISO schemes outperform the SISO scheme significantly.
Secondly, Fig.4 shows the network lifetime with different outage probability threshold. The long-haul distance is 300m. The outage probability gives the probability of unsuccessful transmission when the received SNR falls below a certain specific SNR threshold. Correspondingly, outage probability threshold represents quality of service in terms of minimum transmit power to avoid outage, that is, the lower the outage probability, the more transmit power and the better received signal quality. It can be seen in Fig.4 that the network lifetime goes up with the increase of outage probability threshold. The QPSO network lifetime optimization algorithm outperforms the proposed NSGAQOSP algorithm in network lifetime due to higher long-haul transmit power of the pro-posed NSGAQOSP algorithm. And both the QPSO network lifetime optimization algorithm and the proposed NSGAQOSP algorithm outperform the SISO scheme.
However, in terms of the long-haul transmit power, we can observe from Fig.5 and Fig.6, the proposed NSGAQOSP algorithm outperforms the QPSO long-haul transmit power optimization, which indicates that the proposed NSGAQOSP algorithm achieve better QoS compared with the QPSO net-work lifetime optimization. In particular, as the outage prob-ability threshold increases, the minimum transmit power is also decreased. Compared with two CMISO scheme, the SISO scheme requires highest long-haul transmit power.
VII. CONCLUSION
the joint optimization problem can be formulated into non-dominated sorting research problem. In addition, the proposed algorithm applies the QPSO algorithm to select the opti-mum cooperative coalition. Simulation results show that the proposed QPSO-based NSGA-II joint optimization algorithm can achieve a balance between network lifetime and outage performance.
REFERENCES
[1] Y. Li, K. K. Chai, Y. Chen, and J. Loo, “Duty cycle control with joint optimisation of delay and energy efficiency for capillary machine-to-machine networks in 5g communication system,” Transactions on Emerging Telecommunications Technologies, vol. 26, pp. 56–69, 2015.
[2] L. Musavian and Q. Ni, “Effective capacity maximization with statistical delay and effective energy efficiency requirements,” Wireless Communications, IEEE Transac-tions on, vol. PP, no. 99, pp. 1–1, 2015.
[3] Q. Ni and C. Zarakovitis, “Nash bargaining game theo-retic scheduling for joint channel and power allocation in cognitive radio systems,” Selected Areas in Commu-nications, IEEE Journal on, vol. 30, no. 1, pp. 70–81, January 2012.
[4] C. Zarakovitis, Q. Ni, D. Skordoulis, and M. Hadjini-colaou, “Power-efficient cross-layer design for ofdma systems with heterogeneous qos, imperfect csi, and out-age considerations,” Vehicular Technology, IEEE Trans-actions on, vol. 61, no. 2, pp. 781–798, Feb 2012. [5] C. Zarakovitis and Q. Ni, “Energy efficient designs for
communication systems: Resolutions on inverse resource allocation principles,” Communications Letters, IEEE, vol. 17, no. 12, pp. 2264–2267, December 2013. [6] D. Liu, Y. Chen, and K. K. Chai, “Cooperative user
relaying assisted load balancing scheme for ofdma based cellular networks,” in Network Infrastructure and Digital Content (IC-NIDC), 2012 3rd IEEE International Con-ference on, Sept 2012, pp. 128–133.
[7] T. Himsoon, W. Siriwongpairat, Z. Han, and K. Liu, “Lifetime maximization by cooperative sensor and relay deployment in wireless sensor networks,” in Wireless Communications and Networking Conference, 2006. WC-NC 2006. IEEE, vol. 1, 2006, pp. 439–444.
[8] J. Cao, T. Zhang, Z. Zeng, Y. Chen, and K. K. Chai, “Multi-relay selection schemes based on evolutionary algorithm in cooperative relay networks,” International Journal Of Communication Systems, 2014.
[9] K. Deb, A. Pratap, S. Agarwal, and T. Meyarivan, “A fast and elitist multiobjective genetic algorithm: Nsga-ii,” Evolutionary Computation, IEEE Transactions on, vol. 6, no. 2, pp. 182–197, Apr 2002.
[10] L. Bai, L. Zhao, and Z. Liao, “Energy balance in coop-erative wireless sensor network,” in Wireless Conference, 2008. EW 2008. 14th European, June 2008, pp. 1–5. [11] S. Park, W. Lee, and D. ho Cho, “Fair clustering for
en-ergy efficiency in a cooperative wireless sensor network,” in Vehicular Technology Conference (VTC Spring), 2012 IEEE 75th, May 2012, pp. 1–5.
[12] B. Li, W. Wang, H. Li, Q. Yin, Y. Zhang, and H. Li-u, “Performance analysis and optimization for energy-efficient cooperative transmission in random wireless sensor network,” in Communications (ICC), 2013 IEEE International Conference on, June 2013, pp. 1635–1639. [13] Asaduzzaman and H. Y. Kong, “Energy efficient co-operative leach protocol for wireless sensor networks,” Communications and Networks, Journal of, vol. 12, no. 4, pp. 358–365, 2010.
[14] D. Wu, Y. Cai, and J. Wang, “A coalition formation framework for transmission scheme selection in wireless sensor networks,” Vehicular Technology, IEEE Transac-tions on, vol. 60, no. 6, pp. 2620–2630, 2011.
[15] W. Heinzelman, A. Chandrakasan, and H. Balakrishnan, “Energy-efficient communication protocol for wireless microsensor networks,” in System Sciences, 2000. Pro-ceedings of the 33rd Annual Hawaii International Con-ference on, 2000, pp. 10 pp. vol.2–.
[16] D. Wu, Y. Cai, L. Zhou, and J. Wang, “A cooperative communication scheme based on coalition formation game in clustered wireless sensor networks,” Wireless Communications, IEEE Transactions on, vol. 11, no. 3, pp. 1190–1200, 2012.
[17] J. Laneman and G. W. Wornell, “Distributed space-time-coded protocols for exploiting cooperative diversity in wireless networks,” Information Theory, IEEE Transac-tions on, vol. 49, no. 10, pp. 2415–2425, Oct 2003. [18] S. Cui, A. Goldsmith, and A. Bahai, “Energy-efficiency
of mimo and cooperative mimo techniques in sensor networks,” Selected Areas in Communications, IEEE Journal on, vol. 22, no. 6, pp. 1089–1098, 2004.
[19] A. Goldsmith, Wireless Communications. New York,
NY, USA: Cambridge University Press, 2005.
[20] P. Fan and K. Ben Letaief, “On mimo transmission over fading channels: Reliable throughput vs. outage probability,” in Global Telecommunications Conference (GLOBECOM 2011), 2011 IEEE, Dec 2011, pp. 1–5. [21] A. del Coso, U. Spagnolini, and C. Ibars, “Cooperative
distributed mimo channels in wireless sensor networks,” Selected Areas in Communications, IEEE Journal on, vol. 25, no. 2, pp. 402–414, 2007.
[22] D. Wu, Y. Cai, and J. Wang, “Cooperation policy s-election for energy-constrained ad hoc networks using correlated equilibrium,” Communications Letters, IEEE, vol. 16, no. 3, pp. 349–351, March 2012.
[23] G. Kramer, M. Gastpar, and P. Gupta, “Cooperative strategies and capacity theorems for relay networks,” Information Theory, IEEE Transactions on, vol. 51, no. 9, pp. 3037–3063, Sept 2005.
[24] J. C. Hongyuan Gao and M. Diao, “A simple quantum-inspired particle swarm optimization and its application,” Information Technology Journal, vol. 10, 2011.