Article
1
A combined field and remote-sensing based
2
methodology to assess the ecosystem service
3
potential of urban rivers in developing countries
4
Manuel R. Beißler1 and Jochen Hack2,*
5
1 Technische Universität Darmstadt, Department of Civil and Environmental Engineering,
Franziska-Braun-6
Str. 3, 64287 Darmstadt, Germany; [email protected]
7
2 Technische Universität Darmstadt, Institute of Applied Geosciences, Section of Ecological Engineering,
8
Schnittspahnstr. 9, 64287 Darmstadt, Germany; [email protected]
9
* Correspondence: [email protected]; Tel.: +49 6151 16 20981
10
11
Abstract: Natural rivers in urban areas bear significant potential to provide ecosystem services for
12
the surrounding inhabitants. However, surface sealing by houses and street networks, urban
13
drainage, disposal of waste and wastewater resulting from advancing urbanization usually lead to
14
the deterioration of urban rivers and their riparian areas. This ultimately damages their ability to
15
provide ecosystem services. This paper presents an innovative methodology for a rapid and
low-16
cost assessment of the ecological status of urban rivers and riparian areas in developing countries
17
under data scarce conditions. The methodology uses a combination of field data and freely available
18
high-resolution satellite images to assess three ecological status categories: river hydromorphology,
19
water quality, and riparian land cover. The focus here is on the assessment of proxies for biophysical
20
structures and processes representing ecological functioning that enable urban rivers and riparian
21
areas to provide ecosystem services. These proxies represent a combination of remote sensing land
22
cover- and field-based indicators. Finally, the three ecological status categories are combined to
23
quantify the potential of different river sections to provide regulating ecosystem services. The
24
development and application of the methodology is demonstrated and visualized for each 100 m
25
section of the Pochote River in the City of León, Nicaragua. This spatially distributed information
26
of the ecosystem service potential of individual sections of the urban river and riparian areas can
27
serve as important information for decision making regarding the protection, future use, and city
28
development of these areas, as well as the targeted and tailor-made development of nature-based
29
solutions such as green infrastructure.
30
Keywords: Urban rivers; ecological status; ecosystem services; developing countries; Nicaragua;
31
nature-based solutions; green infrastructure
32
33
1. Introduction
34
Ecosystem services are the direct and indirect benefits that people derive from various types of
35
ecosystems. The maintenance and enhancement of ecosystem services is of central interest to
36
societies. According to Potschin and Haines-Young [1], specific ecological and biophysical structures
37
and processes, representing the status of an ecosystem (natural capital), can be conceptually linked
38
to elements of human well-being. A good ecosystem status provides adequate biophysical structures
39
(e.g. for habitats) and facilitates ecological processes (e.g. primary production). While a deteriorated
40
ecosystem status has less potential to provide these functions which finally lead to benefits to human
41
beings as ecosystem services.
42
Recently, there has been increasing scholarly interest (e.g. several special issues of international
43
journals) in the area of ecology and ecosystem services provided by urban areas in the last decade [2–
44
4]. Due to the high population density of urban areas there is potentially a high demand for ecosystem
45
services, especially those provided in-situ [5]. However, urban areas have only recently been
46
considered as potential provisioning areas of ecosystem services [6,7]. Many studies have focused
47
either on mostly green spaces, urban green spaces in general [8], or hydrological ecosystem services
48
of river basins [9]. In contrast, urban rivers and their potential to provide in-situ ecosystem services
49
have not been considered to the same extent. This misses the fact that the potential of rivers and
50
riparian areas in good ecological status to provide ecosystem services, due to their diversity in aquatic
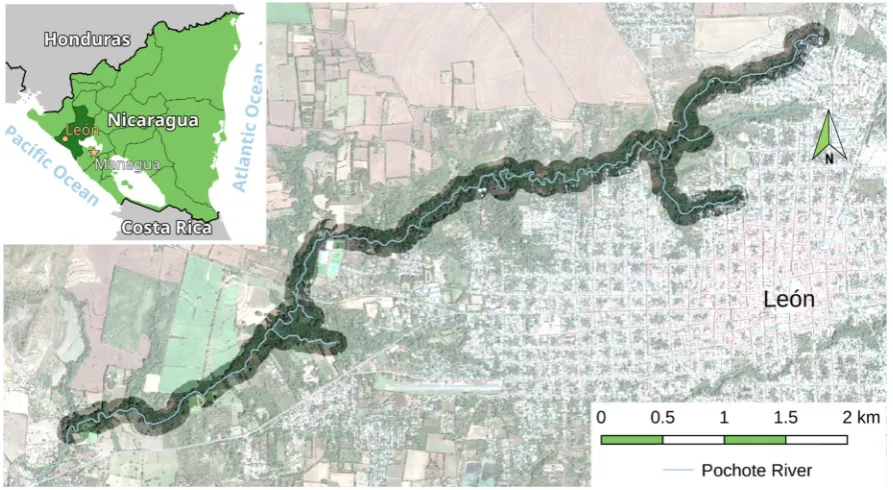
51
and terrestrial biocenosis and biotopes, is much higher compared to other ecosystems [10–12].
52
Despite urban rivers in developing countries being largely used for disposal of untreated waste
53
and storm water discharge as well as local dump sites, they are still in relatively good condition. For
54
example, hydromorphological changes such as channelization or artificial embankments of small and
55
medium-size rivers are often not as advanced as in developed countries [13]. Especially in small and
56
medium-sized towns, the river morphology and often also the riparian vegetation is in relatively
57
good condition. With increasing urbanisation and often unguided urban development, however, the
58
ecological potential of urban rivers is at increased risk of being lost [14]. Moreover, urban rivers and
59
riparian areas are often encountered in urban-rural transitioning zones representing places of
60
informal settlements. This can be explained because these areas represent still somehow rural living
61
conditions, to satisfy basic needs for water and waste disposal, and offer the potential for agriculture
62
for marginalized city dwellers. Since these areas are often prone to flooding and contamination, they
63
are not priority areas for formal city development but are rather left aside.
64
The concept of ecosystem services encourages problem solving by highlighting the social
65
benefits that intact water bodies and riparian areas can provide [15]. By identifying the potential for
66
ecosystem services, it is assumed that urban water pollution could be reduced and urban rivers in
67
developing and emerging countries could be maintained in more natural state. However, there is no
68
widely-accepted methodology for how to evaluate the value of urban rivers and riparian areas in
69
their ability to provide ecosystem services [16].
70
In this publication we present a methodology to assess the ecological status of urban rivers and
71
riparian areas in developing countries under data scarce conditions in order to derive the potential
72
to provide ecosystem services according to the internationally recognized Common International
73
Classification of Ecosystem Services (CICES) [17]. As a first step, Urban River Ecosystem Services
74
(URES) are defined according to CICES. This is the first attempt in the literature to extract URES
75
based on the CICES. Then, a methodology to assess the ecological status of urban rivers and riparian
76
areas based on a combination of low-cost field data and freely available high-resolution satellite
77
images is developed for three ecological status categories: hydromorphology, river water quality, and
78
riparian land cover. The focus here is on the assessment of commonly used proxies for biophysical
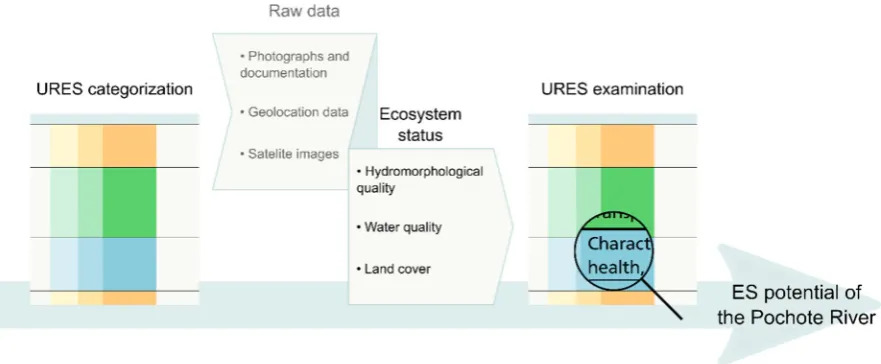
79
structures and processes representing ecological functioning that enables urban rivers and riparian
80
areas to provide ecosystem services. These proxies represent a combination of remote sensing land
81
cover/land use-based and field-based indicators. With the combined use of land cover/land use-based
82
and field-based indicators, the limitations of using only land-cover and land-use based indicators
83
identified by scholars of the field [5] are overcome. These ecological status categories are related to
84
the URES identified as suitable for the available methodology and data through individually
85
weighted combinations of the status categories.
86
In a second step, this universal methodology is applied to the case study of the Pochote River in
87
crossing the city of León, Nicaragua, for the regulating ecosystem services of this urban river and its
88
riparian areas. As a result, the potential to provide each identified URES for every 100 m section of
89
the considered river is quantified and can be visualized via geo-referencing. This spatially distributed
90
information of URES potential of individual sections of the urban river and riparian areas can serve
91
as important information for decision making regarding the protection, future use, and city
92
development of these areas as well as the targeted and tailor-made development of nature-based
93
solutions such as green infrastructure. The methodology presented in this publication also supports
94
investments. The study represents a first practical application of the CICES framework for an urban
96
river ecosystem in a data-scarce region.
97
2. Materials and Methods
98
2.1 Study area and raw data
99
The Pochote River has its origin in the northern part and limits of the city of León. With about
100
180,000 inhabitants, León is Nicaragua’s second-largest city located about 93 km northwest of the
101
country’s capital Managua [18]. While this origin area extends about 20 km to the North-East of the
102
City, the river flows in South-West direction along the city boundary for about 6 km. A few kilometres
103
after leaving the city limits, it confluents with the Chiquito River, another river of the City of León,
104
forming a common river basin that leads to the Pacific Ocean. The climate of the study area is a
105
tropical savannah climate with a pronounced dry season from November to April and a rainy season
106
from May to October. The average monthly precipitation ranges from 300 to 500 mm. The average
107
daily temperature varies from 27 to 29° C with the lowest values found between the months of
108
December and February [9].
109
The current state of these water bodies is characterized by high levels of contamination due to
110
the disposal of both domestic waste and waste water as well as industrial effluents stemming from
111
the nearby tanneries and slaughterhouses. The Pochote River has recently become part of the
112
urbanized area due to rapid urban expansion throughout the last decades.
113
The origin of the Pochote River inside the city is comprised of three channels, each having an
114
approximated length of 1 km. Although they are located within a highly urbanized area, the access
115
to the river is partly limited due to a canyon-like topography. On the mid-course, after the three
116
channels have merged, a single stream channel forms meanders and floodplains. These
hydro-117
morphological characteristics have led to different natural conditions surrounding the river and also
118
influenced different formal and informal settlement patterns. The settlement diversity along the river
119
shores changes in flow direction from formally and densely urbanized (1) to informal urban-rural
120
transitional (2) and to formal rural settlements (3). Due to this urban and ecological diversity, a highly
121
fragmented landscape exists. The most relevant water-related issues are a consequence of the
122
inefficient operation of the local wastewater treatment plants and sewerage system as well as direct
123
wastewater discharge from households alongshore, hydraulic stress due to surface runoff from
124
sealed surfaces, and uncontrolled garbage burning and disposal [19].
125
Additionally, the clearing of riparian vegetation is increasingly a problem disturbing the ecology
126
of the river. However, residents, especially those in more rural settlements along the river, use the
127
river water and that of the numerous natural wells in short distance to the river course in their daily
128
lives (e.g. for household duties and livestock needs) needs [19]. The natural wells deliver significant
129
amounts of clear water to the river even during the dry season when the river is not fed by rainfall at
130
all but only waste water from households. The contribution from natural wells leads to an important
131
dilution of waste water and, together with the natural morphology of the river, results in a continuous
132
improvement of the water quality downstream.
133
During a field survey from May to June 2017, the exact course of the Pochote River as well as
134
geolocations of specific points of interest: solid waste disposal sites, waste water discharges, natural
135
springs and tributaries as well as any constructive modification of the hydromorphology of the river
136
channel (e.g. bridges, weirs, artificial embankments), were georeferenced and recorded. Additionally,
137
a georeferenced photograph was taken for all points of interests, described and documented in an
138
exhaustive photo documentation (see Figure A1 in Appendix A and [19]). The points of interest
139
identified in May and June 2017 were validated during several other field surveys between
140
September 2017 and April 2018. Field surveys conducted during both rainy (May – October) and dry
141
season (November – April) revealed additional insights in the seasonality of river flow (e.g. in order
142
to distinguish perennial and ephemeral streams) and permanence of sources of contamination (e.g.
143
the discharge of untreated wastewater) throughout the year. The information gathered during these
144
regarding hydromorphological quality and water quality. However, the data collection did not
146
follow a predefined pattern (e.g. every 100 m along the river; see methodology section) since the
147
objective of the field surveys was to geo-reference the river network, points of contamination, and
148
specific characteristics of river morphology.
149
150
151
Figure 1. Overview of study area: Pochote River and City of León; Author’s work
152
2.2 Methodology
153
The methodology described in this section was chosen because of the data scarcity in the project
154
region. Such data scarcity is typical in developing countries.
155
Since Urban River Ecosystem Services (URES) are not explicitly specified yet, the first
156
methodological step is to extract URES from the commonly applied ecosystem service classification
157
CICES [17] and specify them further (see ‘URES categorization’ in Figure 2). Next, suitable available
158
‘raw data’ from the study area is selected. This includes satellite images, geo-referenced photographs,
159
and GPS data from field surveys. This ‘raw data’ is used for determining three ecosystem status
160
categories (‘ecosystem status’).
161
The three ecosystem status categories ‘water quality’, ‘hydromorphology’, and ‘land cover’ were
162
chosen because these categories comprehensively cover different biotic and abiotic realms as well as
163
the characteristics of an (urban) river corridor. The category ‘water quality’ provides information on
164
the biotic conditions of the aquatic environment. It can be used to qualitatively assess the provision
165
of ecosystem services related to aquatic life in a coherent manner. The ecosystem status category
166
‘hydromorphology’ covers the dynamics of the abiotic realm of the river corridor. It serves to assess
167
the diversity of habitats and habitat conditions. Important natural hydrodynamics as well as
habitat-168
changing or -dividing (man-made) disturbances of them (e.g. contouring or transversal structures
169
such as artificial embankments or weirs) as well as the transition of river bed to riparian zone i.e.
170
aquatic to terrestrial habitats are considered within this category. Finally, the ‘land cover’ category
171
reflects the conditions of the riparian vegetation with the wider river corridor (100 m wide strip). To
172
characterize the vegetative cover of the river corridor in ground work is very labor intensive and can
173
hardly be done for a larger river section (in this case study an area of ca. 400,000 m²). For this reason,
174
high resolution satellite images provided by Google Earth are used in our methodology to efficiently
175
produce a land cover map of the riparian corridor that can be used to quantify the degree of
176
undisturbed (high i.e. perennial) vegetation, disturbed (low i.e. seasonally disappearing) vegetation
177
and anthropogenically transformed (built up) are. These land cover classes provide information on
178
Qualitative and also quantitative (e.g. in the case of land cover) information on these three
180
categories can easily be redacted or collected at low-cost through field visits and freely available
181
satellite images. Neither expert knowledge nor costly equipment is required for doing this. For this
182
reason, we believe that it is a methodology that can be used by local government members or other
183
public institutions in developing countries.
184
The ecosystem status is then examined for links to Urban River Ecosystem Services ‘URES
185
examination’, using the indicators of Maes et. al [20,21] to assess specific URES for the (new) URES
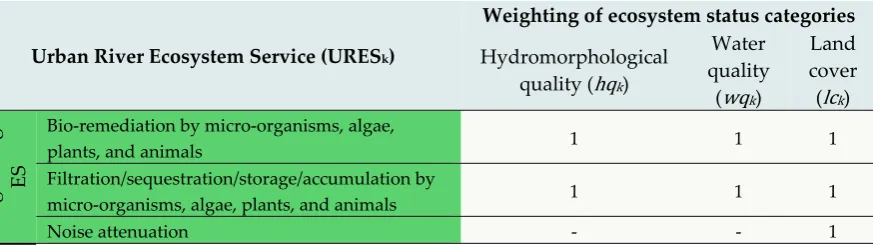
186
biome-related category. In the following, the links of ecosystem status categories to individual URES
187
are defined as weighted multi-criteria equations and used to assess the URES potential of the Pochote
188
River. Figure 2 illustrates the individual steps of the methodology.
189
190
191
Figure 2. Methodology to assess the ecological status of urban rivers; Author’s work
192
In the following, each methodological step from the establishment of a URES categorization over
193
the assessment of ecosystem status to the examination of URES potential is explained.
194
2.2.1 Urban River Ecosystem Services Categorization
195
First, an identification and categorization for Urban River Ecosystem Services (URES) is required
196
since this category of ES has not been explicitly defined. This newly defined category of URES
197
represents a context-specific selection of ES classes defined in the Common International
198
Classification of Ecosystem Services (CICES) [17], which is associated with urban terrestrial and
199
aquatic ecosystems. To generate this new categorization, categorizations for urban ES and river ES
200
classes (as part of the fresh water ES categorization of Maes et al. [20,21]) were combined except those
201
ES classes with groundwater relation. Urban river ecosystems are also linked to the non-urban river
202
ecosystems of the river by dynamic abiotic processes. In addition, urban ecosystems can be located
203
anywhere in the city, including along the river (e.g. park trees and allotments). The idea of a simple
204
combination of river ecosystem services and urban ecosystem services is based on these two
205
circumstances. Groundwater-related services were not considered explicitly, because they are not
206
considered part of river ecosystem services, although groundwater use by bank filtration is possible
207
[2]. Only those services for which indicators are available have been selected to ensure unambiguity,
208
consistency, and ease of use as indicators do not need to be developed. This selection has been
209
adapted into the latest CICES version (CICES V5.1) using the CICES spreadsheet [22] representing
210
the URES categorisation referred to in this publication (Table A1 in Appendix A).
211
2.2.2 Hydromorphological quality
212
To determine the hydromorphological quality of individual river sections, a method of the
213
German state working committee LAWA [23] was used in combination with the geo-referenced
214
method is intended for mapping the hydromorphological quality for small and medium-sized
216
running waters. It has been successfully applied for many rivers in Germany [24]. However, due to
217
the lack of data for the study area, the following subcategories could not be considered: ‘Longitudinal
218
banks (Längsbänke)’, ‘Special river course structures (Besondere Laufstrukturen)’, ‘Transversal
219
banks (Querbänke)’, ‘Flow diversity (Strömungsdiversität)’, ‘Depth variance (Tiefenvarianz)’,
220
‘Substrate diversity (Substratdiversität)’, ‘Special river bed structure (Besondere Sohlenstruktur)’,
221
‘Special bank structures (Besondere Uferstrukturen)’. In addition, the category ‘River environment
222
(Gewässerumfeld)’ was not considered to avoid duplication with the land cover assessment. Thus,
223
with the exception of this category, 14 out of 22 subcategories of the LAWA method [23] were
224
considered. The geographic information system QGIS (2.18 LTS, 2016-10 [25]) was used to illustrate
225
the hydromorphological quality based on the LAWA quality classification (Figure 4). As required by
226
the LAWA guidelines, the river was divided into 100 m sections (a total of 121 sections) and coloured
227
according to the different hydromorphological quality classes: 1 = ‘unchanged (unverändert)’, 2 =
228
‘slightly changed (gering verändert)’, 3 = ‘moderately changed (mäßig verändert)’, 4 ‘significantly
229
changed (deutlich verändert)’), 5 = ‘strongly changed (stark verändert)’, 6 = ‘very strongly changed
230
(sehr stark verändert)’, 7 = ‘totally changed (vollständig verändert)’. For the sections in which no
231
photos and no specific local knowledge existed (48 sections), a linear adjustment of the previous and
232
the following section was assumed.
233
2.2.3 Water quality
234
In order to assess the ecosystem status regarding water quality, a qualitative map with the
235
sources of contamination was created using the available geo-referenced photo documentation [19]
236
and additional site visits. This qualitative evaluation was mainly a visual analysis of the photographs
237
and secondarily based on site descriptions of the geo-referenced photo documentation. For water
238
quality rating a categorisation was generated; category 0 ‘barely or not polluted’ for visibly clear
239
water up to category 4 ‘highly polluted’ for milky whitish coloured water and/or foaming water. The
240
addition ‘seasonally’ was used if there were discharges in photos in the rainy season, but absent in
241
photos of the dry season or if the photos gave cause for this addition for other reasons. The classes
242
which were created for the classification can be seen in Table 1. The map resulting from this
243
processing is shown in Figure 3.
244
Table 1. Classification of water quality; Author’s work
245
# class Appearance of discharge
0 not or barely polluted visibly clear water
1 seasonally polluted brownish colored water, rainwater from surface runoff or does not fit
in the other categories 2 polluted
3 seasonally highly polluted
milky whitish colored water and or foaming water
4 highly polluted
247
Figure 3. Location of photographs indicating degree of pollution of the Pochote River; Author’s work
248
based on field survey information [19].
249
To produce a map for the water quality from this map, the same 100 m sections that were already
250
introduced for the hydromorphological quality classification were used. The classification of
251
contamination has been maintained for water quality. The water quality of individual river branches
252
contributing to the main river was assumed to be in class 1 (seasonally polluted) in the urban regions
253
and class 0 (not or barely polluted) in the non-urban regions. This is based on the assumption that
254
the proportion of urban surface water in the urban spring regions is likely to be relatively high – thus
255
of poorer quality - due to surface sealing and in the non-urban spring regions it mainly consists of
256
groundwater – assumed to be of better quality. Since no quantitative discharge data were available,
257
the water quality at points of confluence of river branches and the main river was calculated using
258
the volume ratio (R) between the (visual) discharge of the main river section and the discharge of a
259
tributary or an affluent. This ratio was determined visually on the basis of photographs at 4
260
confluences of river branches, 59 spring water inflows (water quality class 0 in Figure 3) and 17 waste
261
water discharges (water quality classes 1 - 4 in Figure 3). The pollution class for the river section after
262
the confluence is calculated depending on the volume ratio and the pollution classes. To simplify the
263
calculations, values between 0 and 1 were assigned to the individual water quality classes (Table 2).
264
Additionally, a natural cleaning factor (N) was also assumed to clean the river from category 4 to
265
category 0 in 10 km. The calculations were carried out starting at the sources of each river branch
266
(source areas) that contributes to the main river. For each confluence with an affluent or a tributary,
267
the water quality value of the river section was estimated using the aforementioned visual volume
268
ratio (R) of the discharge to the previous section. This procedure is described below in formula (1)
269
and (2).
270
271
𝑊𝑄 = (1 𝑅 , ) ∙ (𝑊𝑄, ∙ 1 ∑ 𝑅 , , + ∑ 𝑊𝑄 , , ∙ 𝑅 , , + 𝑊𝑄 , ∙ 𝑅 , )
(1)
i = Number of discharge in one section
272
j = Number of section
273
WQj = Water quality value of section [-]
274
WQ = Water quality value (with applied cleaning factor) [-]
275
WQdi = Water quality value of discharge [-]
276
WQtr = Water quality value of tributary [-]
277
Rtr = Visual Volume Ratio between the tributary and the main river [-]
278
Rdi = Visual Volume Ratio between the discharge and the tributary/main river [-]
𝑊𝑄 = 𝑊𝑄 + 𝑁 ∗ 𝑙
100 (2)
N = Natural cleaning factor [1/m]
280
l = Section length [m]
281
282
In addition, an upper limit for the water quality value of 1 was introduced as the quality cannot
283
increase above this optimal value. After all calculations, the values were then assigned to the water
284
quality classes (see Table 1) using class limit values.
285
2.2.4 Land-cover
286
A land cover analysis of 50m buffer strips on both sides of the river (study area; see Figure 1)
287
was carried out in order to assess the vegetative status of the riparian corridor of the Pochote River.
288
To be able to analyse even very small-scale structures and patches, which are very common in urban
289
river environments, high resolution satellite images provided by Google Earth were used. An
290
innovative methodology for land cover classification on the basis of these available, which are freely
291
available for non-commercial uses, was developed.
292
First of all, an orthogonal bird's-eye view image of the study area was generated using Google
293
Earth (Version: 7.3 Desktop) and exported in a jpg-format. The chosen image was taken during dry
294
season, specifically on 26th of January, 2017 (Digital Globe, GeoEye1). The advantage provided by
295
using an image during dry season is that is shows a greater contrast between the evergreen trees and
296
other perennial vegetation and agriculture areas, making it easier to discriminate between these types
297
of vegetation. In addition, the image is relatively up-to-date. The image was then edited for land
298
cover classification with the GNU Image Manipulation Program (GIMP) (Version 2.8, 2017-05 [26]),
299
a widely used software for image editing. At the beginning, the satellite image was imported into
300
GIMP and roughly cropped to the study area. Then the 'Select by Color Tool' was used to select and
301
colorize one area type after the other. After that small adjustments were necessary i.e. to have only
302
three different colours in the selected area. This serves for easier handling and error minimization in
303
QGIS. For the same purpose the colour palette was reduced to only three colours before being
304
exported as a .png file with the '8bpc GRAY' pixel format. Then the original satellite image was
305
opened with the 'Georeferencer GDAL' plugin and geo-referencing points were determined using the
306
'OpenLayers Plugin' [27]. These geo-referencing points were used to geo-reference (WGS84 ESPG:
307
4326) the produced map (exported .png file) to obtain the same dimensions as the original satellite
308
image. The resulting raster was finally cropped to the study area (with a 50 m buffer zone on both
309
sides of the river) and divided as well into 100 m sections in QGIS. For this purpose, the layer of the
310
study area had to be divided into the same 100 m sections as the other two ecosystem status
311
categories. Then the 100 m section layer could be cut with the raster to achieve the desired result. The
312
resulting land cover map representing, in addition to Hydromorphological and water quality, the
313
third ecosystem status category used to derive the ecosystem service potential of the Pochote River.
314
In order to use the land cover classes as input data for the assessment of ecosystem service potential,
315
the following unified values are assigned to the three land use classes ‘high and perennial vegetation’
316
= 1.0, ‘low vegetation’ = 0.6. and the ‘built-up’ = 0. These values are based on the assumption that
317
‘built-up’ area has no potential to provide ecosystem services at all (value 0), while ‘high and
318
perennial vegetation’ has the full potential (value 1.0) to provide ecosystem services. ‘Low vegetation’
319
is considered as disturbed vegetation that can only provide a certain degree (here 0.6) of the total
320
potential of ecosystem services. The value 0.6 was chosen to indicate that the potential of ‘low
321
vegetation’ is still closer to the potential of ‘high vegetation’ than to that of the ‘built-up’ area.
322
Figure A2 in Appendix A contains a detailed step-by-step description of the work flow which
323
was applied to reach the land cover classification for the study area.
324
2.2.5 Links between URES and ecosystem status categories
325
In order to calculate the potential of rivers to provide ecosystem services on the basis of
326
necessary to normalize the different categories. As with the water quality category, values between 0
328
and 1 were chosen (Table 2), allowing the results of the status to be expressed in percentage.
329
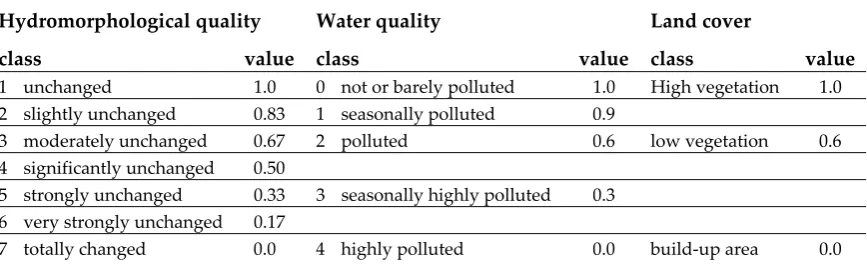
Table 2. Transformation of classes in normalized values; Author’s work
330
Hydromorphological quality Water quality Land cover
class value class value class value
1 unchanged 1.0 0 not or barely polluted 1.0 High vegetation 1.0
2 slightly unchanged 0.83 1 seasonally polluted 0.9
3 moderately unchanged 0.67 2 polluted 0.6 low vegetation 0.6
4 significantly unchanged 0.50
5 strongly unchanged 0.33 3 seasonally highly polluted 0.3
6 very strongly unchanged 0.17
7 totally changed 0.0 4 highly polluted 0.0 build-up area 0.0
331
Since the vegetation of the riparian zone is considered in the hydromorphological quality
332
category ('Uferbewuchs') [23], land cover is mainly a factor influencing URES related to air quality.
333
While the other two ecosystem status categories mainly relate to URES of the river itself, the effect of
334
land cover on the river through prevention of soil erosion is estimated to be low compared to the
335
other two ecosystem status categories. Even though the hydromorphological quality and the water
336
quality both have a primary effect on the river, they have no interdependencies due to the method of
337
data collection, since the water quality during the data collection is based on mixing ratios and not
338
on the hydromorphological quality. Although the hydromorphological quality could have been
339
included in the water quality calculation (e.g. through a hydromorphology dependent natural
340
cleaning factor), its influence at the current degree of pollution was assumed to be small and the cost
341
involved of incorporating both factors was greater compared to the expected benefit. As a result, the
342
information on water quality, hydromorphological quality, and land cover are not strongly correlated
343
based on their survey types. Therefore, the relationship of the individual ecosystem condition data
344
to each other is determined below, in which they can be added together (with different weighting in
345
the case that one ecosystem status category is more relevant for URES provision than the other) to
346
represent the respective URES.
347
An initial analysis was carried out to determine which of the URES could best be linked (directly
348
or indirectly) to the established ecosystem status categories. All of the URES that could not be
349
reasonably related to three ecosystem status categories are not further considered in this study.
350
However, the remaining URES chosen for further consideration are presented in Table 3. It follows a
351
secondary analysis in which the filtered out URES indicators are examined for direct links with the
352
ecosystem status categories. The three ecosystem status categories represent different biophysical
353
structures and processes that link them directly to different ecosystem functions. A direct link is
354
assumed when according to [22] an indicator for an URES can be related to at least one of the three
355
ecosystem status categories. Direct links to several categories could be identified for the majority of
356
the considered URES, but for some URES only one category or a dominant one could be found. Since
357
the three ecosystem status categories ‘water quality’, ‘land cover’, and ‘hydromorphology’ cover
358
different biotic and abiotic realms as well as characteristics of an (urban) river corridor, they can be
359
complementarily linked to URES. The way how the three ecosystem status categories are linked to
360
the considered URES will be explained and justified.
361
According to [22] the same indicators are commonly used for the services ‘Bio-remediation by
362
micro-organisms, algae, plants, and animals’ and ‘Filtration/sequestration/storage/accumulation by
363
micro-organisms, algae, plants, and animals’, ranging from indicators of the general ecological status
364
and specific indicators of water quality and to the area occupied by riparian forests. Therefore, all
365
three ecosystem status categories can be assigned to these two URES. Since all three also link to other
366
An indicator used for the service of ‘Noise attenuation’ [29] is the Leaf Area Index. This indicator
368
can be linked to the ecosystem status category ‘land cover’. It seems reasonable to link high vegetation
369
to better noise attenuation and low vegetation to less noise attenuation.
370
In the case of the ‘Hydrological cycle and water flow regulation (including flood control, and
371
coastal protection)’ service, the indicator ‘water retention capacity by vegetation and soil’ can be
372
linked with ‘land cover’ [28,29].
373
The ‘Maintaining nursery populations and habitats (including gene pool protection)’ service
374
includes the indicators ‘Biodiversity value’ and ‘Ecological status Morphological status’ [28]. Since
375
hydromorphology and water quality are both indicators of biodiversity within the river, and land
376
cover an indicator for biodiversity outside the river, the ecosystem status categories
377
hydromorphological and water quality are added together in equal parts and the resulting value is
378
added 1:1 to land cover.
379
According to Maes et. al [28], the ‘Regulation of the chemical condition of freshwaters by living
380
processes’ service is determined using the following indicators, ‘Chemical status’ and ‘Ecological
381
status’. Although generally chemical status is indicated by the water quality, hardly any influences
382
of the regulation of living processes are taken into account here. Biological treatment processes are
383
only carried out before discharge into the sewage treatment plants, which are included in the
384
calculation of the water quality because the water quality results from the quality of the discharges
385
(pollution). In addition, as already described in the first two services of this chapter, the impact of
386
land cover on air quality is considerably higher than on water. For these two reasons this URES is
387
linked to the ecosystem status categories hydromorphology: water quality: land cover in relation to
388
3: 1: 1.
389
Since no temperature values were measured, only the ‘Leaf Area Index’ can be considered for
390
the ‘Regulation of temperature and humidity, including ventilation and transpiration’ service [29].
391
Therefore, land cover is linked to this service as it is very similar to the Leaf Area Index.
392
There is a whole range of indicators for the 'Characteristics of living systems that enable activities
393
promoting health, recuperation or enjoyment through passive or observational interactions' services
394
[28,29]. The only indicator related to the ecosystem status categories considered here is 'bathing water
395
quality', which could be determined by water quality. However, since there are so many various
396
indicators here, it makes little sense to use water quality alone. Hence, this URES class will not be
397
considered in this study.
398
Regarding the 'Characteristics of living systems that enable aesthetic experiences' service,
399
surveys of the population on how beautiful they find the surroundings around the Pochote River
400
have yet to be collected. It should also be noted that the river is difficult to access, as the authors
401
noticed through visits of the river with locals. This study will not consider this service either.
402
For the indicators of ‘Surface water for drinking' and ‘Surface water for non-drinking purposes'
403
services, there are no suitable connections with the ecosystem status categories identified here,
404
especially since no flow data are available.
405
Table 3 summarizes the established weighted links between the ecosystem status categories and
406
URES considered in this study.
407
Table 3. Relations between the URES and ecosystem status data; Author’s work
408
Urban River Ecosystem Service (URESk)
Weighting of ecosystem status categories
Hydromorphological quality (hqk)
Water quality
(wqk)
Land cover (lck)
Reg u la ti ng ES
Bio-remediation by micro-organisms, algae,
plants, and animals 1 1 1
Filtration/sequestration/storage/accumulation by
micro-organisms, algae, plants, and animals 1 1 1
Hydrological cycle and water flow regulation
(Including flood control, and coastal protection) - - 1
Maintaining nursery populations and habitats
(Including gene pool protection) 1 1 2
Regulation of the chemical condition of
freshwaters by living processes 3 1 1
Regulation of temperature and humidity,
including ventilation and transpiration - - 1
Cultura
l
ES
Characteristics of living systems that enable activities promoting health, recuperation, or enjoyment through passive or observational interactions
- - -
Characteristics of living systems that enable
aesthetic experiences - - -
Provis
ionin
g
ES
Surface water for drinking - - -
Surface water for non-drinking purposes - - -
409
As can be seen in the table, indicators for provisioning and cultural URES could not be directly
410
linked to the ecosystem status categories considered in this study and are therefore neglected.
411
The following formula shows how URES for each 100 m river section are calculated based on a
412
weighted combination of values for the three ecosystem status categories:
413
414
𝑈𝑅𝐸𝑆, =
𝐻𝑄 ∙ ℎ𝑞 + 𝑊𝑄 ∙ 𝑤𝑞 + 𝐿𝐶 ∙ 𝑙𝑐
ℎ𝑞 + 𝑤𝑞 + 𝑙𝑐 (3)
k = Type of URES
415
j = Number of section
416
URES = Urban River Ecosystem Service [-]
417
HQ = Hydromorphological quality value [-]
418
hq = Hydromorphological quality weighting factor [-]
419
WQ = Water quality value [-]
420
wq = Water quality weighting factor [-]
421
LC = Land cover value [-]
422
lc = Land cover weighting factor [-]
423
424
3. Results
425
The application of the methodology described in the preceding section produced three
426
ecosystem status maps (hydromorphological status, water quality and land cover), which are
427
intermediate results, and potential URES maps, one for each of the ecosystem service assessed, which
428
are final results.
429
The different ecosystem status maps already bear important insights on the degree of
430
deterioration of the urban river and its riparian zone without going into a deeper interpretation of
431
the status. This is done in the next step when the three ecosystem status information are combined to
432
assess the URES potential. This final result highlights the potential provision of a variety of benefits
433
from the river ecosystem to the local and regional population (ecosystem services). Since beneficiaries
434
are not identified in this study, the following results point to potential ecosystem services that may
435
3.1 Ecosystem status categories
437
For the hydromorphological quality (Figure 4), the river can be classified as good almost over
438
its entire length, as the hydromorphological quality rarely goes beyond class 3, with the exception of
439
the densely populated area in the northeast and due to a few individual structural elements along
440
the river. A strongly meandering section at the middle course of the river as well as the last tributary
441
(stemming from the Botanic Garden) that confluences with the main river in the southwest are
442
classified as “unchanged”, reflecting the highest potential to provided hydromorphology related
443
URES.
444
445
446
Figure 4. Hydromorphological quality of the Pochote River; Author’s work
447
Figure 5 shows, based on the methodology presented in section 2.2.3, the water quality per 100
448
m river section in the study area. Similar to the hydromorphological quality, it is significantly worse
449
in the densely populated area in the northwest. The presence of several highly polluted (classes 3 and
450
4) river sections within this area, and better water quality classes farther away from it, corresponds
451
well to the empirical evidence from field surveys and seems logical. Abrupt improvements from one
452
river section to the following one are a result from a high number of fresh water sources (natural
453
wells) that reduce the concentration of contaminants due to dilution. From the strongly meandering
454
middle course of the river on several natural wells contribute (apparently) clean water to the main
455
river. This correlates with an increasing distance of the river to the urbanized area when flowing
456
downstream. The downstream trend in cleaner river sections is explained by the self-purification of
457
the river.
458
460
Figure 5. Water quality classes per 100 m section of the Pochote River; Author’s work
461
Figure 6 illustrates the land cover for each 100 m long and 50 m wide section, high vegetation is
462
shown in dark green (72%), low vegetation in light green (22%), and the built-up area in brown (6%).
463
Here it becomes apparent that there is a relatively large amount of high vegetation around the river,
464
which is a sign of a relatively good and undisturbed ecological status. However, in the northeast
465
region, urbanization has reached the river corridor and the presence of low vegetation in these areas
466
can be explained by cutting down of trees by the neighbouring population for fire and construction
467
wood.
468
469
470
Figure 6. Land cover of the study area; Author’s work
471
472
If all ecosystem status categories are compared with each other, it is also noticeable that the
473
respectively better rated locations are congruent with each other. The same is seen for both the
474
3.2 Ecosystem Services potential of the Pochote River
476
Based on the previous considerations and calculations, maps illustrating the potential of
477
individual river sections to provide URES were generated (Figure 7). The potential is expressed as a
478
percentage of a theoretically possible potential for the entire study area (131 river sections). In this
479
specific case of the Pochote River it can be seen that for the selected ecosystem services all have a
480
relatively good potential.
481
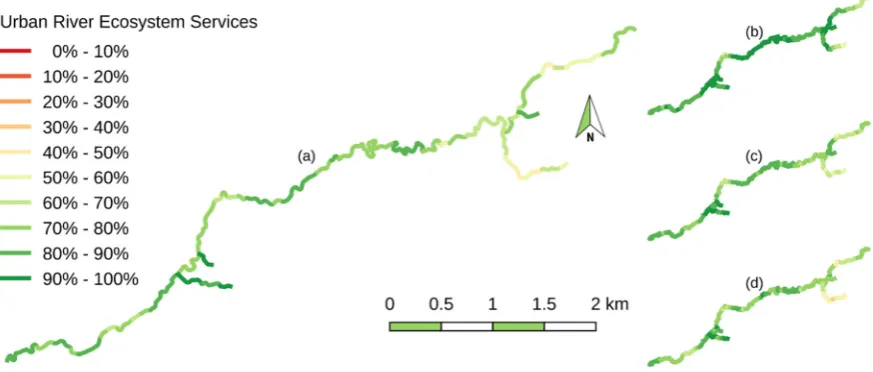
482
483
Figure 7. Ecosystem Services status maps of the Pochote River: (a) Bio-remediation by
micro-484
organisms, algae, plants, and animals & Filtration/sequestration/storage/accumulation by
micro-485
organisms, algae, plants, and animals; (b) Noise attenuation & Hydrological cycle and water flow
486
regulation (Including flood control and coastal protection) & Regulation of temperature and
487
humidity, including ventilation, and transpiration; (c) Maintaining nursery populations and habitats
488
(Including gene pool protection); (d) Regulation of the chemical condition of freshwaters by living
489
processes; Author’s work
490
While Figure 7 shows a spatial distribution, Figure 8 represents distributive characteristics
491
(maxima, minima, mean and median values, standard deviation) of all river sections as box plots for
492
494
Figure 8. Ecosystem Services status of the Pochote River: 'Bio-remediation' stands for 'Bio-remediation by
495
micro-organisms, algae, plants, and animals'; 'Filtration' means 'Filtration / sequestration / storage /
496
accumulation by micro-organisms, algae, plants, and animals'; 'Noise' represents 'Noise attenuation';
497
'Hydro_Regu' short for 'Hydrological cycle and water flow regulation'; 'Maintain' refers to 'Maintaining
498
nursery populations and habitats'; 'Regu_Chem' signifies 'Regulation of the chemical condition of
499
freshwaters by living processes'; 'Regu_T' equals 'Regulation of temperature and humidity, including
500
ventilation and transpiration'; Author’s work
501
Since several URES are linked in the same way to the three ecosystem status categories, their
502
statistical distributions are the same. This is revealed in the box plots in Figure 8.
503
As can be seen, there are outliers of lower URES potential for all URES. These outliers represent
504
river sections close to built-up areas which are suffering from urban contamination and loss
505
vegetative cover. The outliers for noise attenuation, hydrological regulation and regulation of
506
temperature/humidity are most pronounced. Here the impact of a severe land cover loss is the reason
507
for a low URES potential. However, for the same URES the majority of river sections have an URES
508
potential above 90% highlighting that large parts of the river corridor still preserve a high amount of
509
high vegetation and low or no urban impact so far. Moreover, there are individual river sections with
510
a potential above 90% for all URES. The lowest median potential has the river in the provision of the
511
URES ‘Bio-remediation’, ‘Filtration’ and ‘Regulation of Chemical Condition’. The absolute lowest
512
potential of a URES of all river sections is related to the provision of ‘Regulation of Chemical
513
Condition’ with 40% resulting from poor water quality and altered land cover in addition to a
514
strongly changed hydromorphology.
515
4. Discussion
516
The objective of this article is to introduce a low-cost and easy to use methodology to assess the
517
potential of urban rivers and riparian areas to provide ecosystem services. The methodology is based
518
on the use of a combination of easily obtained field information and readily accessible remote-sensing
519
data. The following discussion will focus on the representativeness of the data used as well as the
520
advantages and disadvantages of the developed methodology. Possibilities for improvements in data
521
collection, use of data, and application of the methodology are considered. The established link
522
between revealed ecosystem status data and urban ecosystem service potential will also be critically
523
discussed. This represents the basis for the interpretation and discussion of the results. Finally, future
524
4.1 Potential of the Pochote River to provide Ecosystem Services
526
Although the selected URES are in relatively good condition, there is still potential for
527
improvement. Looking at the ES status maps (ecosystem status for the different categories; see Figure
528
5-7) it is noticeable that the biggest negative influence on the URES, in the case of the Pochote River,
529
is water quality. This indicates that there is still great potential for improvement of the river, as it is
530
relatively easier and quicker to improve water quality, in comparison to restoring riparian
531
vegetation/reverse surface sealing and the poor hydromophological quality. Even if the river is in
532
general in a relatively good condition, it is still relatively variable over the entire route. This results
533
in different potentials which is clearly evident from the ecosystem services status maps (Figure 7). So
534
it would be possible to use the area in the northeast preferably for local recreation. In contrast the
535
area in the southwest where the two tributaries are still very close to nature would be worthwhile
536
returning it completely to nature in order to use it for educational purposes or to promote natural
537
cleaning. In addition to the location of the hotspots, the general picture of the quality of the URES
538
(Figure 8) shows that there are only a few outliers downwards. The fact that the median of each of
539
the URES is above the mean value also confirms the relatively good quality of the URES considered.
540
It should also be noted that the median for all URES considered is between 78% and 90% and thus
541
relatively high.
542
The degree of the relationship between ecosystem status and URES is debatable, but there
543
definitively is a relationship. The relationships and weighting established in this publication can be
544
interpreted as a rough estimation of the potential to provide ecosystem services. The relationship was
545
established on a relatively detailed ES “class” level of CICES. A more detailed consideration of
546
specific “class types”, as established with CICES version 5.1. [17], within these CICES classes would
547
imply a quantitative assessment of class types (e.g. flood volume attenuated) and would rather lead
548
into a detailed assessment and not an analysis of potential as it was done for this study. However, a
549
further elaboration with more detailed consideration of the ecosystem status categories could provide
550
information to assess class types.
551
4.2 Discussion and recommendation of improvements regarding the data and methodology used
552
The principal idea of the methodology for the assessment of the potential to provide URES
553
presented here, is that it should be based on either readily available or easily collectable data at low
554
cost. For this reason, the data described in section 2 was used and the methodology accordingly
(data-555
driven) developed. However, the results are only as good as input data and suitability of
556
methodology applied. These two aspects need to be discussed in detail.
557
Regarding the raw data on the ecological status of the river, not for every 100 m section data in
558
form of photographs and the geo-localized photo documentation was available. Therefore, with some
559
exceptions, a linear approximation between the evaluated 100 m sections was assumed. In order to
560
advance the methodology, a photo should be taken from a specified angle at suitable intervals, e.g.
561
every 50 or 100 meters. This standardization could provide superior hydromorphological quality
562
evaluation.
563
To determine the water quality, the number of data was sufficient for this simple type of survey,
564
as data were available for each discharge. However, with the applied visual classification, the use of
565
a standardized color scale could improve the data quality and reduce potential subjectivity in visual
566
color interpretation with little additional effort.
567
Even though the land cover scores provided relatively high resolution (ca. 1.5 m x 1.5 m
geo-568
localized pixels), it was still a semi-automatic method. No general statements can be made about the
569
accuracy of the new development of the land cover classification. This is due to the fact that this
570
methodology is to a certain extent trial and error and that the application of the classification has been
571
adjusted until its result has been considered satisfactory for the observation area. A random check of
572
four different sections in the study area using the original Google map showed an accuracy of 95.6%
573
to 99.8%. So it would be desirable for future applications to develop a guidance with precise settings
574
to increase the degree of automatisation and applicability of this method as well as to quantify the
575
Thus, the data described here is of relatively good quality and/or the methods of collecting them
577
can be easily improved. However, as soon as the transformation into the URES takes place, several
578
assumptions are made. Since all these data can be collected quickly and inexpensively, the URES
579
survey method is well suited for a rough analysis of the current state of the study area and should
580
also be regarded as such. Thus, this method can be used for the purpose of searching for a suitable
581
field of research or action. Furthermore, the ES status maps should not be regarded as a general state
582
of ecosystem services in the study area, as only a small selection of the URES was covered. It should
583
also be mentioned that these are only 'Regulation & Maintenance' URES. But, the underlying
584
ecosystem status data can be extended with little effort so that statements can be made about cultural
585
URES. For example, the land cover map can be used to derive a value for the population density per
586
area and its distance to the river and thus a potential for the URES 'Physical and experiential
587
interactions with natural environment'. There may also be census data available that can replace the
588
population density value derived from the map and further enhance the quality of the data. Data for
589
the 'Intellectual and representative interactions with natural environment' URES can also be collected
590
in the same way, although adjustments must be made depending on the URES. For some, the distance
591
between schools or universities to the river leads to the desired result, while for others the survey can
592
remain unchanged. For the schools as well as for the universities it would be even more helpful to
593
know how many students or scientific staff they have, as this can provided quantitative information
594
on the number of potential beneficiaries.
595
There is a general problem of lacking data and indicators to assess the large variety of URES,
596
especially in developing countries. The methodology proposed here can help to structure and
597
formalize the assessment of the ecological status of urban rivers and their riparian corridors in a
598
simple but still sufficiently sound manner. Already the information on the ecological status, reflected
599
in three categories that represent different biotic and abiotic realms and characteristics of an (urban)
600
river corridor, facilitates the identification of deterioration of ecosystems due to urbanization. This
601
alone can guide decision-making with regard to establishing protection zones and/or regulating
602
urban development. Linking the ecosystem status categories to URES to evaluate the potential of
603
river sections to provide URES can then assist to stress the benefits from urban rivers in good
604
ecological status establishing the basis to argue for the protection and sustainable uses of urban rivers.
605
In a next step, this service provision potential could be contrasted with potential beneficiaries to
606
identify specific supply and demand relationships [9]. At this point other URES, including
607
provisioning and cultural, may be included to identify additional benefits beyond those assed in this
608
study and other beneficiaries. An indicator set for the assessment of cultural ecosystem service of
609
riverscapes has recently been developed for Germany [30] which may contribute additional
610
ecosystem status categories or links to URES, although it has not been developed specifically for
611
urban riverscapes.
612
5. Conclusions
613
Rivers and their riparian zones represent often the only remaining natural-like spaces in urban
614
areas of developing countries. In a landscape transition from rural to urban land uses, the original
615
importance of rivers (to provide water for households, irrigation and animals) vanishes and a
616
transformation of them into wastewater channels typically occurs. While intact semi-urban or urban
617
rivers can have a significant regulative and recreational function, the frequently rapid and
618
uncoordinated urbanization process poses a significant threat of losing these areas and the benefits
619
to the population they may provide. Hence, establishing the specific category of Urban River
620
Ecosystem Services, as done in this contribution, to stress this important ecosystem-society link seems
621
useful. The methodology presented here allows local decision makers, e.g. city administrations or
622
water companies, to translate data and information from field surveys combined with easily
623
accessible remote-sensing data into three ecosystem status information. The resulting maps represent
624
a baseline of the ecosystem status of an urban river. The subsequent weighted combination of them
625
facilitates then the assessment of the potential of different river sections to provide specific ecosystem
626
provisioning areas of ecosystem services. The ecosystem service concept has been developed as a
628
strong communication tool for the benefits that ecosystems provide. Especially in urban contexts,
629
where dynamics and pressure on ecosystems are extraordinary, the highlighting of ecosystem service
630
potential may contribute to a sustainable use and protection of vulnerable ecosystems.
631
632
Author Contributions: Conceptualization, Manuel R. Beißler and Jochen Hack; Investigation, Manuel R. Beißler
633
and Jochen Hack; Methodology, Manuel R. Beißler and Jochen Hack; Software, Manuel R. Beißler; Supervision,
634
Jochen Hack; Visualization, Manuel R. Beißler; Writing – original draft, Manuel R. Beißler and Jochen Hack.
635
Acknowledgments: We acknowledge support from the German Research Foundation and the Open Access
636
Publishing Fund of Technische Universität Darmstadt. Further we want to express our gratitude to three
637
anonymous reviewers for their valuable comments on the manuscript
638
Conflicts of Interest: The authors declare no conflict of interest.
639
Appendix A
641
642
644
Figure A2. Manual of producing a land cover map with the software GIMP and QGIS; Author’s work
645
Appendix A
1
2
Table A1. Urban river Ecosystem Services Classification according to CICES 5.1. Author's work adapted from Haines-Young and Potschin [21] and Maes et al. [27,28].
3
doi:10.20944/preprints201905.0233.v1
Peer-reviewed version available at
Remote Sensing
2019
,
11
;
Section Division Group Class Indicator Provisioning
(Biotic)
Biomass Cultivated terrestrial
plants for nutrition, materials or energy
Cultivated terrestrial plants (including fungi, algae) grown for nutritional purposes
- Production of food (ton ha-1 year-1)
- Surface of community gardens/small plots for self-consumption (ha)
Wild plants (terrestrial and aquatic) for nutrition, materials or energy
Wild plants (terrestrial and aquatic, including fungi, algae) used for nutrition
- Wild plants used in gastronomy, cosmetic,
pharmaceutical uses (data on industries collecting the plants)
Fibres and other materials from wild plants for direct use or processing (excluding genetic materials)
Reared aquatic animals for nutrition, materials or energy
Animals reared by in-situ aquaculture for nutritional purposes
- Freshwater aquaculture production (e.g. sturgeon and caviar production)
Fibres and other materials from animals grown by in-situ aquaculture for direct use or processing (excluding genetic materials)
Animals reared by in-situ aquaculture as an energy source
Wild animals
(terrestrial and aquatic) for nutrition, materials or energy
Wild animals (terrestrial and aquatic) used for nutritional purposes
- Fish production (catch in tons by commercial and recreational fisheries)
- Number of fisherman and hunters of waterfowls (anglers, professional and amateur fishermen) - Status of fish population (Species composition, Age Structure, Biomass kg/ha)
Mediation of wastes or toxic substances of
Bio-remediation by micro-organisms, algae, plants, and animals
doi:10.20944/preprints201905.0233.v1
Peer-reviewed version available at
Remote Sensing
2019
,
11
;
Regulation & Maintenance (Biotic)
Transformation of biochemical or physical inputs to ecosystems
anthropogenic origin by living processes
Filtration/sequestration/storage/accumulation by micro-organisms, algae, plants, and animals
- Indicators of water quality (microbiological data for
bathing waters, BOD5 nitrate conc, phosphate conc,
oxygen conditions, saprobiological status) - Nutrient loads
- Ecological status - Trophic status
- Area occupied by riparian forests
- Number and efficiency of treatment plants - Waste treated
- Pollutants removed by vegetation (in leaves, stems
and roots) (kg ha-1 year-1)
- Dry deposition velocity (mm s-1)
- Population exposed to high concentration of pollutants (% on surface area)
Mediation of nuisances of anthropogenic origin
Noise attenuation - Leaf Area Index + distance to roads (m)
- Noise reduction rates applied to UGI within a
defined road buffer dB(A) m-2 vegetation unit
Regulation of physical, chemical, biological conditions
Regulation of baseline flows and extreme events
Buffering and attenuation of mass movement - Sediment retention
Hydrological cycle and water flow regulation (Including flood control, and coastal protection)
- Hydrological flow data
- Share of green areas in zones in danger of floods (%) - Population exposed to flood risk (% per unit area) - Areas exposed to flooding (ha)
- Holding capacity flood risk maps - Conservation of river and lakes banks Lifecycle maintenance,
habitat and gene pool protection
Pollination (or 'gamete' dispersal in a marine context)
- Capacity of ecosystems to sustain insect pollinators activity (dimensionless)
- Relative abundance (number over area or over length)
Lifecycle maintenance, habitat and gene pool protection
Maintaining nursery populations and habitats (Including gene pool protection)
- Biodiversity value (Species diversity or abundance, endemics or red list species and spawning location) - Ecological status Morphological status
doi:10.20944/preprints201905.0233.v1
Peer-reviewed version available at
Remote Sensing
2019
,
11
;
Pest and disease control Pest control (including invasive species) - Alien species (Introduced riparian and aquatic plants
- Number of introduced aquatic invertebrates - Number of introduced vertebrates in rivers and riparian areas
Regulation of soil quality
Weathering processes and their effect on soil quality - Fluvisols surface
Water conditions Regulation of the chemical condition of freshwaters
by living processes
- Chemical status - Ecological status Atmospheric
composition and conditions
Regulation of chemical composition of atmosphere and oceans
- C sequestration (Annual increase in
- Carbon sequestration in living biomass of riparian forest
- Carbon sequestered by plantations of Populus - Organic carbon stored in fluvisols)
Regulation of temperature and humidity, including ventilation and transpiration
Cultural (Biotic)
Direct, in-situ and outdoor interactions with living systems that depend on presence in the environmental setting
Physical and
experiential interactions with natural
environment
Characteristics of living systems that that enable activities promoting health, recuperation or enjoyment through active or immersive interactions
- Number of visitors (to National Parks including lakes or rivers)
- National Parks and Natura 2000 sites - Known bird watching sites Waterfowl Characteristics of living systems that enable
activities promoting health, recuperation or enjoyment through passive or observational interactions
- Number of visitors
- bathing areas and Number beaches - Fishing reserves
- Fish abundance
- Fish monetary value from angling - Number fishing licenses
- Quality of fresh waters for fishing Intellectual and
representative interactions with natural environment
Characteristics of living systems that enable scientific investigation or the creation of traditional ecological knowledge
- Monitoring sites (by scientists)
- Number of scientific projects, articles, studies - Classified sites (world heritage, label European tourism)
Characteristics of living systems that enable education and training
- Number of visitors
- National Parks and Natura 2000 sites
doi:10.20944/preprints201905.0233.v1
Peer-reviewed version available at
Remote Sensing
2019
,
11
;
![Figure 3. Location of photographs indicating degree of pollution of the Pochote River; Author’s work based on field survey information [19]](https://thumb-us.123doks.com/thumbv2/123dok_us/1001483.1599960/7.595.79.518.77.315/figure-location-photographs-indicating-pollution-pochote-author-information.webp)


![Figure A1. Cutout of a photo Documentation of the Pochote River [19]](https://thumb-us.123doks.com/thumbv2/123dok_us/1001483.1599960/19.595.54.521.86.295/figure-a-cutout-photo-documentation-pochote-river.webp)

