Kalman Filter Based Elderly Fall Detection with
a Triaxial Accelerometer
A. Sucerquia1ID, J.D. López2,† ID and J.F. Vargas-Bonilla2,‡ ID
1 Engineering Faculty, Institución Universitaria ITM, Medellín, Colombia (e-mail [email protected])
2 SISTEMIC, Facultad de Ingeniería, Universidad de Antiquia UDEA, Calle 70 No. 52-21, Tel.: +57-4-2198561,
Medellín, Colombia (e-mail†[email protected],‡[email protected])
* Correspondence: [email protected]; Tel.: +57-460-0727 ext. 5586
Abstract:The consequences of a fall on an elderly person can be diminished if the accident is attended 1
by medical personnel within the first hour. Independent elderly people use to stay alone for long 2
periods of time, being in more risk if they suffer a fall. The literature offers several approaches for 3
detecting falls with embedded devices or smartphones using a triaxial accelerometer. Most of these 4
approaches were not tested with the objective population, or are not feasible to be implemented in 5
real-life conditions. In this work we propose a Kalman-filter-based fall detection methodology that 6
includes a periodicity detector to reduce the false positive rate. Moreover, this methodology requires 7
a sampling rate of only 25 Hz, it does not require large computations or memory, and it is robust 8
among devices. We tested our approach with the SisFall dataset. Then, we validated it with a new 9
round of simulated activities with young adults and an elderly person achieving 99.4 % of accuracy. 10
Finally, we gave the devices to three elderly persons during two days for full-day validations. They 11
continued with their normal life and the devices behaved as expected. 12
Keywords: triaxial accelerometer; wearable devices; fall detection; mobile health-care; SisFall; 13
Kalman filter 14
1. Introduction 15
At least one third of elderly people suffers a fall per year, and the probability of falling increases 16
with age and previous falls [1–4]. The consequences of a fall can be diminished if the person is attended 17
by medical services within an hour from the accident [5–7]. This timing is feasible with institutionalized 18
elderly people, but healthy independent elderly people use to stay alone for long periods of time 19
increasing their risk of aggravating the injuries in case of an accident. Nowadays, authors focus on 20
developing automatic fall detection systems that generate an alarm in case of an event, but they still 21
present high error rates in real-life conditions (see [7–10] for reviews on the field). In this paper, we 22
tackle this issue with a novel fall detection methodology tested in real-life situations with the objective 23
population, using a simple to implement triaxial-accelerometer-based embedded device. 24
Detecting falls with a triaxial accelerometer is commonly divided in three stages: pre-processing, 25
feature extraction, and classification. The preprocessing can be as simple as a low-pass filter [11], 26
but it mainly depends on the selected feature extraction. In this sense, there is a wide amount of 27
features available in the literature, such as acceleration peaks, variance, angles, etc. (see [9, Table 4] 28
for a complete list). These features transform the acceleration signal in order to better discriminate 29
between falls and activities of daily living (ADL). Regarding classification, threshold based detection 30
is still the most opted choice over machine learning alternatives, mainly because the latter ones are 31
impractical for real-time implementation. Habib et al. [10] show various examples of SVM approaches 32
consuming the battery in few hours; and Igual et al. [12] concluded that these approaches are highly 33
dependent on the acquisition device used. 34
A common problem with approaches proposed in the literature is that most of them were tested 35
with young adults under controlled conditions [9, Table 5]. Moreover, previous works demonstrated 36
that the accuracy of these approaches is significantly diminished when tested on institutionalized 37
[13] and independent [11] elderly people. The main reason for authors not testing with the objective 38
population is the lack of appropriate public datasets, and the difficulty of acquiring real falls with 39
elderly people [9,11,13]. In order to tackle these issues, we recently released the SisFall dataset [11], a 40
fall and movement dataset acquired with a triaxial accelerometer mounted on an embedded device 41
attached to the waist (see [14] for implementation details). 42
In [11], we demonstrated that most failures in fall detection are focused on a few activities. Most 43
of these activities coincide in periodic waveforms (from walk and jog) and high peak acceleration 44
ADL (e.g., jump). There are previous approaches in the literature for detecting jog and walk with 45
accelerometers. Cola et al. [15] detected gait deviation as a fall-risk feature. [16] used the peaks of the 46
acceleration signal measured with a smartphone to detect steps, and subsequently the kind of activity 47
based on the period between steps. Wundersitz et al. [17] did it with an embedded device. Other 48
authors used more elaborated metrics but all peak based. Clements et al. [18] computed principal 49
components of the Fast Fourier Transform (FFT), to cite an example. In contrast, we previously 50
developed a more stable gait detector based on wavelet or auto-correlation indistinctly [19]. However, 51
it was too computationally intensive for real-life implementation in an embedded device. 52
In this work, we present a Kalman-filter-based fall detection algorithm that additionally detects 53
gait as a feature to avoid false positives. The fall detection feature is a novel non-linear metric based 54
on two widely used features: the sum vector magnitude and the standard deviation magnitude. The 55
Kalman filter is a well-known optimal estimator [20] widely used in several research fields. The 56
Kalman filter is Markovian (avoiding large memory storage), and linear (simple computations for 57
lower energy consumption). Here, we use it as an input to the non-linear feature by determining 58
the orientation of the subject: jogging activities may lead to high accelerations, but the absence of 59
inclination implies that the subject is not falling. We additionally use the Kalman filter to smooth gait 60
patterns (as sinusoidal-shape waveforms) in order to feed our gait detector. 61
The Kalman filter has been previously used to identify movements of interest with accelerometers. 62
Bagalà et al. [21] used it to determine the lie-to-sit-to-stand-to-walk states, which are commonly 63
used to measure the risk of falling in elderly people (with the Berg Balance Scale –BBS– for example 64
[22]). There, the authors used an Extended Kalman filter to determine the orientation of the device. 65
Otebolaku et al. [23] proposed a novel user context recognition using a smartphone. In their work, the 66
Kalman filter was used to obtain the orientation of the device based on its multiple sensors (not only 67
the accelerometer). But the authors did not specify how they did it. Finally, Novak et al. [24] used a 68
multiple sensors system to determine gait initiation and termination. In their work, the Kalman filter 69
was used again to obtain the orientation of the device. 70
The aforementioned works coincide in their objective with the Kalman filter (identifying 71
locomotion activities), but they differ on the way it was implemented, and none of them was interested 72
in detecting falls. In Yuan et al. [25], the authors used the Kalman filter to obtain the device angle 73
for detecting falls, but using three different sensors (including gyroscope, which demands too much 74
energy for long-term use [7]). All previously mentioned works demonstrate that the orientation of 75
the device computed with a Kalman filter is a strong feature, and that it is useful to detect periodic 76
activities such as walking or jogging. However, none of them combined these capabilities as we 77
propose in this work. 78
This paper continues as follows: In Sections2and3we present the dataset used and explain the 79
proposed approach. In Section4we present the overall results with controlled activities and falls (in 80
simulation and implemented on an embedded device); we perform an individual activity analysis; and 81
we show an on-line validation, where three elderly voluntaries carried an embedded device during at 82
2. Materials 84
We recently published a dataset with falls and ADL acquired with accelerometer (SisFall: Sistemic 85
research group fall and movement dataset [11]). Here we use this dataset to train and test the proposed 86
approach. It was generated with 38 participants divided in elderly people and young adults. Twenty 87
three young adults performed five repetitions of 19 ADL and 15 fall types, while 14 participants over 88
62 years old performed 15 ADL. One additional participant of 60 years old performed both ADL and 89
falls. The dataset was acquired with a self-developed embedded device attached to the waist [14]. 90
The embedded device was based on a Kinets MKL25Z128VLK4 microcontroller with an ADXL345 91
accelerometer. The accelerometer was configured for±16 G, 13 bits of ADC, and a sampling rate of 92
200 Hz. 93
A second device was developed for validating our methodology (Figure1). This device consisted 94
of the same microcontroller and sensor used for SisFall, but it included a GPRS transmitter (to send 95
short text messages –SMS) that was activated if a fall was detected. As we did with the first device, 96
it was fixed with a homemade belt (see the supplementary videos of [11]) to guarantee that it does 97
not move relative to the subject. It does not require to be completely vertical neither an additional 98
calibration once the subject wears it. 99
5 cm
Figure 1. Validation device.With similar characteristics of the device used in [11], this one included a GPRS module able to send text messages in case of alarm.
Two additional validation tests were performed with this device: 100
• Individual activities: Six young adults (subjects SA03, SA04, SA05, SA06, SA09, SA21) and one 101
elderly person (subject SE06) performed again three trials of all activities in SisFall (except D17, 102
getting in and out of a car, due to logistic issues). 103
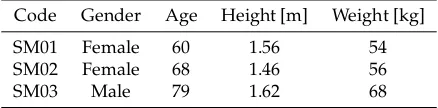
• On-line tests: We gave the device to three elderly participants that were not part of SisFall dataset. 104
They used the device permanently for at least two days, except during sleep and shower (as the 105
device is not water-proof yet). We used three devices to guarantee the integrity of the system. 106
Table1shows their gender, age, height and weight. 107
Table 1.Gender, age, height and weight of the on-line test participants.
Code Gender Age Height [m] Weight [kg]
SM01 Female 60 1.56 54
SM02 Female 68 1.46 56
SM03 Male 79 1.62 68
All activities performed by the participants were approved by the Bio-ethics Committee of the 108
Medicine Faculty, Universidad de Antioquia UDEA (Medellín, Colombia). Additionally, all participants 109
3. Methods 111
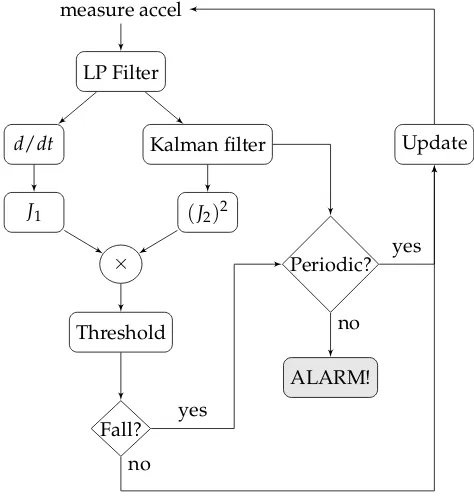
Figure2shows a schematic of the proposed approach. It includes bias variations of the signal 112
together with acceleration peaks. This increases the robustness of the feature extraction and allows 113
simpler classifiers. The proposed methodology consists of four stages: Preprocessing, feature extraction, 114
classification, and periodic activity detection. For each time samplek, the raw acceleration data~a[k] 115
is initially low-pass filtered. Then, it splits into bias removal and Kalman filtering, which feed 116
both features J1andJ2respectively (see Eqs. (8) and (9) below). A threshold-based classification is 117
performed over a non-linear indirect feature. If the resultant value crosses the threshold, the periodicity 118
of the signal (extracted from the Kalman filter and a zero-crossing algorithm) is analyzed in order to 119
determine if it is a false fall alert, or if indeed the alarm should be turned on. This methodology is 120
explained in the following section. 121
measure accel
LP Filter
d/dt Kalman filter
J1 (J2)2
×
Threshold
Fall?
Update
Periodic?
ALARM! yes
no yes
no
Figure 2. Proposed methodology.It is based on a non-linear feature that allows detecting falls with a simple threshold based detector. Then, false positives are discarded if a periodic activity is detected after the fall.
3.1. Preprocessing and periodicity detector 122
The same 4-th order IIR low-pass Butterworth filter with a cut-off frequency of 5 Hz used in [11] 123
was used in this work. This filter was selected because: (i) It can be implemented in simple embedded 124
devices; (ii) It does not require large computations in software; and (iii) Increasing the order or the 125
cut-off frequency did not improve the accuracy, i.e., it does not require higher sampling frequencies. 126
The filtered data is then bias removed with a simple differentiation of consecutive samples, as it is 127
needed to compute the static feature (J1). SisFall dataset was initially acquired at 200 Hz; however, 128
the proposed methodology only requires 25 Hz to feed the filter. Then, all results presented here 129
correspond to the proper downsampled signals. 130
The second feature (J2) is computed over the bias level, which is obtained with a Kalman filter. A 131
Kalman filter [20] is an optimal quadratic estimator able to recover hidden states of a state-space model. 132
It was used here with two purposes: to recover the bias-level variation, and to find the periodicity of 133
Let us define the filtered acceleration data as~a[k] = [ax,ay,az]T∈ <3×1for time instantk, where 135
ax,ay, andazare single samples of raw acceleration (in practice it comes in bits, as acquired by the 136
ADC of the device). These data feed the following autonomous state-space model: 137
~x[k] =A~x[k−1] +η ~y[k] =C~x[k] +e
(1)
where the first three states of~x∈ <4×1are used for classification, and the fourth statex4removes 138
peaks from periodic signals (see Figure3, example with activity F05: jog, trip, and fall). As this Kalman 139
filter is exclusively used for smoothing (and not for feature extraction or classification), the state 140
transitionA∈ <4×4and outputC∈ <4×4matrices are identity matrices. Finally, the output is defined 141
as~y= [ax,ay,az,ay−bay]T∈ <4×1, where the first three terms are the low-pass filtered acceleration 142
data in the three axis, and the fourth output is the acceleration on vertical axis minus its current bias 143
bay, updated together with the feature.x4provides a zero-bias sinusoidal-shape waveform when the 144
acceleration comes from periodic activities (walk, jog, going-up stairs, etc.). The period of this signal 145
can be detected counting zero-crossings (changes of sing) and dividing by two over a given time 146
window. 147
This state-space model is affected by Gaussian measurement noisee=N(0,R), and Gaussian
148
state uncertaintyη=N(0,Q). The objective of the Kalman filter is to minimize the variance of the
149
statesP∈ <4×4, considering them as random variables with a Gaussian distribution:~x=N(x,P). 150
The Kalman filter consists of five equations divided in two stages. The prediction stage of the 151
Kalman filter predicts the current value of the states and their variance solely based on their previous 152
values: 153
~x[k]−= A~x[k−1] (2)
P[k]−= AP[k−1]AT+Q (3)
both~x[k]−andP[k]−are intermediate values that must be corrected based on the current data 154
values: 155
G[k] =CP[k](CP[k]−CT+R)−1 (4)
~x[k] =~x[k]−+G[k](~y[k]−C~x[k]−) (5)
P[k] = (I4−G[k]TC)P[k]− (6)
whereI4∈ <4×4is a(4×4)identity matrix. 156
This strategy only requires to sintonize two parameters to set-up the Kalman filter: the variance 157
matricesQandR. There are not rules to determine their values, but specifically for this problem they 158
are not difficult to define. Both are usually diagonal (no interaction among states), large values ofQ 159
andRtend to the original data:~x ≈~y, and they are also complementary, i.e., reducing any of them flats 160
the states. As shown in Figure3(Second and Third panels), the first three states are flat (inclination of 161
0 5 10 15 −2
0 2
Filtered
x y z
0 5 10 15
−300 −100 100
States
0 5 10 15
0 200 400
x 4
0 5 10 15
0 5 10
Periodicity
Time [s]
x 1 x
2 x
3
Figure 3. Kalman filtering.(Top panel) Reference filtered acceleration data (Activity F05 of SisFall: jog, trip, and fall) in gravities [G]. (Second panel) First three states of the Kalman filter. The filter estimates the bias-level variations of the signal. (Third panel) The forth state of the Kalman filter recovers a quasi sinusoidal signal during the first 6 s. Its objective is to dynamically remove bias to allow posterior zero crossing detection. (Bottom panel) Periodicity detector. The first 6 s the subject is jogging with a period of 10 time samples (half zero crossings); when the subject suffers a fall it stops detecting periodicity too.
The states can be initialized with zero values, andP[0] =Q, i.e., selecting uninformative priors. 163
However, for faster convergencex2[0]andbay[0]can be initialized with−1 G (approx. -258 in bytes for 164
the device configuration used here), which is the initial condition of the accelerometer in our device. 165
QandRcan be computed with a simple heuristic process: For the first three states, initializeQand 166
Rwith identity matrices and reduce their standard deviation in scales of 10 until the accuracy stops 167
increasing. For the fourth state, reduceQandRuntilx4shows a sinusoidal shape in periodic activities 168
(walk and jog). The final values used in this work were: 169
Q=0.0012×I4 R=
0.052 0 0 0
0 0.052 0 0
0 0 0.052 0
0 0 0 0.012
(7)
In practice, all computations in both the computer (Matlab, Mathworks) and the embedded device 170
were performed in bits and not in gravities to reduce the computational burden. 171
Figure3(Bottom panel) shows how statex4tends to a zero-bias sinusoidal shape when the person 172
walks or jogs. This allows implementing a simple zero-crossing periodicity detector. Note how the 173
periodicity is lost when the person trips and fall. The periodicity detector analyzes three seconds after 174
a possible fall event. If during this 3 s window the periodicity is kept stable, we may expect that it was 175
not a fall. The size of the window is selected as the minimum to guarantee that the person is slowly 176
walking. 177
3.2. Feature extraction and classification 178
The feature extraction consists of a non-linear feature composed of two widely used ones, the 179
sum vector magnitude and the standard deviation magnitude. The static sum vector magnitude is 180
J1[k] =RMS(~a[k]−~a[k−1]) (8) where the bias is rejected with differentiation.
182
The standard deviation magnitude is computed at each time stepkover a 1 s sliding window of 183
the first three states of the Kalman filter: ˜x[k] = [~x[k−N], . . . ,~x[k]]∈ <3×N, whereN=25 is the size 184
of the window (for a frequency sample of 25 Hz). This second feature is computed as follows: 185
J2[k] =RMS(std(x[k]))˜ (9) where std(·)is the standard deviation operator. The size of the window is selected as the one that 186
includes the three stages of the fall: the pre-fall, the hit, and the time just after it [26]. Testing with 187
windows between 0.25 and 2 s did not improve the accuracy, as expected [11]. 188
The same sliding window can be used to determine the current bias on the y axis: bay[k] = 189
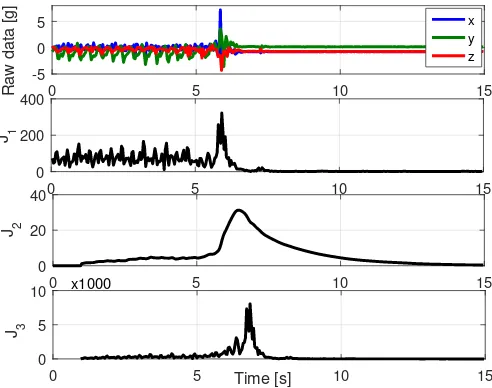
mean(x˜y[k]). Figure4shows both features with the jog-trip-fall example of Figure3. The maximum 190
values during jogging are half way of the fall in J1, but they get clearly distant inJ2. 191
0 5 10 15
-5 0 5
Raw data [g]
x y z
0 5 10 15
0 200 400
J 1
0 5 10 15
0 20 40
J 2
0 5 Time [s] 10 15
0 5 10
J 3
x1000
Figure 4. Feature extraction. (Top panel) Reference raw data (The subject is running, trips and falls).
(Second panel) Feature J1detects the fall as a large difference between its peak and jogging peaks.
(Third panel) FeatureJ2has a similar shape but with a larger percentual difference. BothJ1andJ2are
computed in bits for reducing computations on the embedded device. (Bottom panel)J3is formed by
J1andJ2, increasing their coincidences and diminishing their differences.
Finally, the classification stage is performed over an indirect feature: 192
J3[k] =max(J1˜[k])·max(J2˜ [k])2 (10) With ˜Ji[k]∈ <N×1a sliding window with the lastNvalues of the corresponding feature. This 193
window is necessary as the Kalman filter takes some time to achieve the maximum, i.e., not always 194
both metrics present a maximum at the same time. The objective of this product of features is to 195
amplify the values of those activities where both features agree, and to minimize those where both 196
features disagree (see Figure4, bottom panel). The square ofJ2gives it priority overJ1, as it is more 197
accurate [11]. 198
The classification consists of a single threshold overJ3[k]computed at each time stepk. The value 199
of the threshold is defined after a training process. The robustness of the threshold was analyzed 200
with a cross-validation set-up. This analysis was performed guaranteeing the same proportion of falls 201
performed, each fold had 4059 files for training and 451 for validation. Each group was used in one 203
round as validation data. 204
Accuracy (ACC), Sensitivity (SEN) and specificity (SPE) were used as performance metrics. SEN 205
and SPE were calculated as specified in [27]: 206
SEN= TP
TP+FN SPE= TN
TN+FP (11)
whereTPare falls correctly classified,FNare falls that the algorithm did not detect,TNare ADL 207
correctly classified, andFPindicates false falls. The accuracy was calculated using Eq. (12): 208
ACC= SEN+SPE
2 (12)
This balanced computation of the accuracy is selected due to the large difference between the 209
number of ADL and fall files. 210
4. Results 211
4.1. Fall detection 212
We initially tested the performance of the proposed algorithm without detecting periodic activities. 213
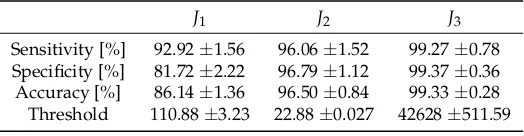
Table2shows the validation results with SisFall dataset over a 10-fold cross-validation (451 files 214
each). All subjects and activities available in the dataset were included in the cross validation. The 215
low detection accuracy obtained withJ1(around 86 %) would raise questions about its usefulness. 216
However, note howJ3is significantly higher than J2(99.3 % vs. 96.5 %), i.e., evenJ1is not a good 217
metric, combined withJ2it improves the individual accuracy values. 218
Table 2.Test on SisFall dataset without periodicity detector.
J1 J2 J3
Sensitivity [%] 92.92±1.56 96.06±1.52 99.27±0.78
Specificity [%] 81.72±2.22 96.79±1.12 99.37±0.36
Accuracy [%] 86.14±1.36 96.50±0.84 99.33±0.28
Threshold 110.88±3.23 22.88±0.027 42628±511.59
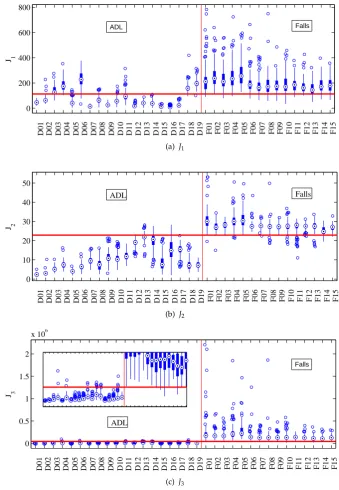
Figure5shows an activity-by-activity analysis for the three metrics. The horizontal red line is the 219
threshold for the best accuracy value, and the vertical red line divides ADL and falls. By comparingJ1 220
(Figure5(a)) andJ2(Figure5(b)), we observe thatJ1largely fails in periodic ADL (D03, D04, D06, D18, 221
and D19) whileJ2does not, and J2goes closer to the threshold in activities whereJ1does not (D16 222
for example). This separation was the basis to createJ3, it combines their results with a product but 223
giving priority toJ2(computed with square), given that it is more accurate. The small box in Figure5(c) 224
shows how all activities are more separated from the threshold; and importantly, less fall files crossed 225
the threshold (false negatives). This initial result significantly improves those obtained with previous 226
0
200 400 600 800
D01 D02 D03 D04 D05 D06 D07 D08 D09 D10 D11 D12 D13 D14 D15 D16 D17 D18 D19 F01 F02 F03 F04 F05 F06 F07 F08 F09 F10 F11 F12 F13 F14 F15
J 1
ADL Falls
(a) J1
0
10 20 30 40 50
D01 D02 D03 D04 D05 D06 D07 D08 D09 D10 D11 D12 D13 D14 D15 D16 D17 D18 D19 F01 F02 F03 F04 F05 F06 F07 F08 F09 F10 F11 F12 F13 F14 F15
J 2
ADL Falls
(b)J2
0
0.5 1 1.5 2
x 106
D01 D02 D03 D04 D05 D06 D07 D08 D09 D10 D11 D12 D13 D14 D15 D16 D17 D18 D19 F01 F02 F03 F04 F05 F06 F07 F08 F09 F10 F11 F12 F13 F14 F15
J 3
ADL
Falls
(c) J3
Figure 5.Individual activity analysis of the proposed algorithm tested with SisFall. The horizontal red
line corresponds to the optimal threshold value, and the vertical one separates ADL and falls.(a)J1
has large errors on periodic activities, while(b)J2fails in those that change the body angle.(c)They
provide toJ3a better discriminant capability (the small box at the left shows a vertical zoom).
4.2. Fall detection with periodicity detector 228
We then performed the same analysis but including the periodicity detector. The main purpose 229
of this detector is to take J1 to zero if a periodic activity is observed after a possible fall (false 230
positive) –Same result is obtained ifJ2is selected. Table3shows the validation results after a 10-fold 231
cross-validation. Compared to the previous analysis,J1has 8 % of improvement (94.32 %). Although 232
one would expect a similar improvement inJ3, this is not the case (although it is higher, with 99.4 % of 233
accuracy) given that on SisFall dataset, walk and jog only have one file per subject. Nevertheless, the 234
Every dataset has a limited number of repetitions per activity. SisFall for example contains only 236
one 1 minute repetition of walk per subject. However, it is expected that a walk will last more than 237
one minute, i.e., the possibility of failure is higher with activities that the subject performs regularly 238
(such as walking). Additionally, Figure6shows how the possibility of errors in other activities is lower 239
given their larger distance from the threshold. 240
Table 3.Test on SisFall dataset with periodicity detector.
J1 J2 J3
Sensitivity [%] 97.35±1.37 96.15±1.59 99.28±0.59
Specificity [%] 91.49±1.74 96.69±1.30 99.51±0.48
Accuracy [%] 94.42±1.33 96.42±0.58 99.39±0.36
Threshold 103.03±0.02 22.914±0.11 42230±985.01
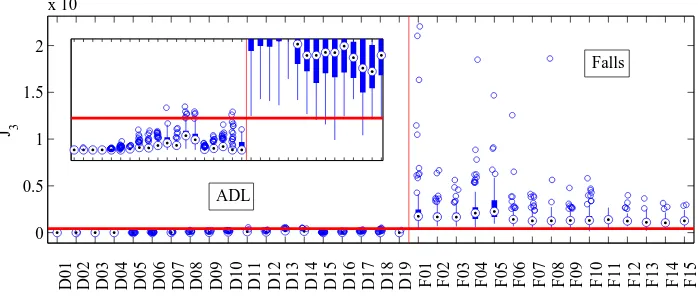
Figure6shows the same individual activity analysis of Figure5but with the periodicity detector 241
inJ1. Figure6shows how activities D01 to D04 were turned to zero, as the detector confirmed that the 242
subject was walking or jogging. In this case,J3shows overall more distance from the threshold than 243
the previous test (the threshold is updated accordingly). This indicates that even the cross-validation 244
did not show a significant improvement on accuracy, the inclusion of the periodicity detector increased 245
the robustness of the algorithm. Importantly, none fall was turned to zero in Figure6, indicating that 246
the periodicity detector was turned off in all periodic activities that finished in a fall. 247
0
0.5 1 1.5 2
x 106
D01 D02 D03 D04 D05 D06 D07 D08 D09 D10 D11 D12 D13 D14 D15 D16 D17 D18 D19 F01 F02 F03 F04 F05 F06 F07 F08 F09 F10 F11 F12 F13 F14 F15
J 3
ADL
Falls
Figure 6.Individual activity analysis of the proposed algorithm including the periodicity detector. The horizontal red line corresponds to the optimal threshold value, and the vertical red line separates ADL
and falls.J3was turned to zero in all periodic ADL, this allowed it to increase the distance between
most ADL and Falls.
4.3. On-line validation 248
In order to verify the off-line results presented in Table3, we repeated the activities of SisFall with 249
six young adults and an elderly person with the algorithm implemented on the device (see Section2). 250
During the tests, we verified on-line if the alarm was turned on (with an indicator incorporated to 251
the device). Additionally, all raw data and the device computations were recorded in text files. We 252
obtained no significant differences between the device and the computer. The proposed approach was 253
implemented on the embedded device with the same parameters and sample frequency defined above 254
(25 Hz). The threshold forJ3was set at 40,000. The six volunteers performed 18 types of ADL and 15 255
types of fall in the same way that SisFall dataset was acquired (around 100 total trials per subject). 256
The participants presented a total of 4 false positives and 1 false negative. Subject SE06 (the elderly 257
person) did not show errors. All false positives were in D13 and D14 (bed related ones). Following 258
problem (which is not reflected in the following test) demonstrated that when a person moves on the 260
bed, it is usual to separate the hip from the mattress and let it fall in the new position. The pad used for 261
this experiment is harder than a mattress increasing the false positive probability. The overall results 262
coincided with the statistics expected from Table3. 263
4.4. Full-day (pilot) tests 264
We invited three elderly participants that were not part of SisFall acquisition (in order to avoid 265
biases) to carry the device for full days (see Section2). We asked them to behave normally while 266
carrying the device during at least two days, and we checked the integrity of the devices every couple 267
of hours. They used the device permanently except during night sleep and shower. The files were cut 268
in segments to avoid computational overloads (one hour of recording implied a text file of around 269
10 MB). 270
This is a summary of the activities that they performed and the overall behavior of the system: 271
• SM01: She assisted to a Tae-Bo for adults class (INDER Medellín, Colombia), and stayed at home 272
cooking, cleaning and resting. She did not present false positives. 273
• SM02: She stayed most of the time cooking at home, cleaning and sit on the dinning room. She 274
usually supports her belly against the kitchen or the table, it caused some false positives (4) of 275
the system. She went out of her home two times, unfortunately both times the device got hits 276
and lost the SD card, loosing all data. This is worrying as after an interview we concluded that 277
she strongly hit the device in both cases presumably against furniture. We presume that her low 278
height together with the shape of her belly (rounded) incremented the risk of direct hits to the 279
device. 280
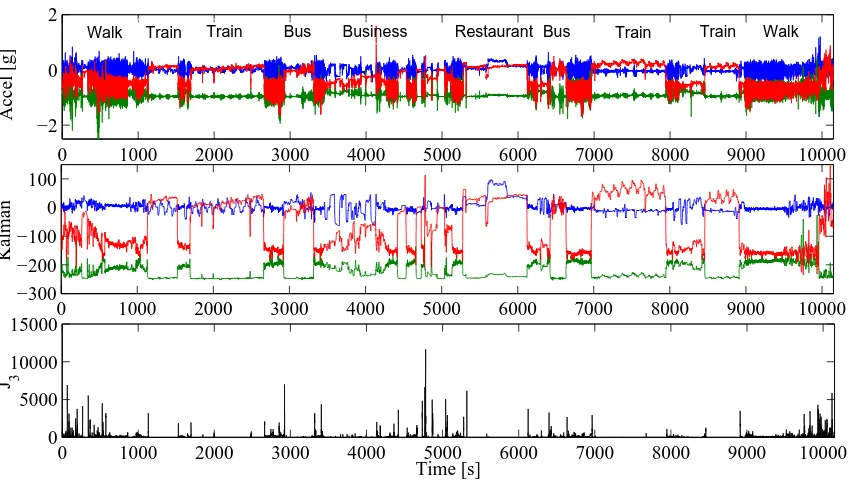
• SM03: He did some trips to a business in the downtown and to the church. The rest of the time he 281
stayed at home in bed or in the dinning room. He did not have false positives in any activity. His 282
trip to the downtown included stairs, two train trips and two bus trips. This trip is presented in 283
Figure7, note that despite the wide amount of activities, the levels of featureJ3were not close to 284
the threshold (40,000). 285
0 1000 2000 3000 4000 5000 6000 7000 8000 9000 10000
−300 −200 −100 0 100
Kalman
0 1000 2000 3000 4000 5000 6000 7000 8000 9000 10000
0 5000 10000 15000
J 3
Time [s]
0 1000 2000 3000 4000 5000 6000 7000 8000 9000 10000
−2 0 2
Accel [g]
Walk
Walk Train Train Bus Business Restaurant Bus Train Train
Figure 7. Trip to the downtown of subject SM03. (Top panel) Raw acceleration data, 2 hours and 45
minutes of recording. (Second panel) First three states of the Kalman filter. (Third panel) featureJ3.
It was always below the threshold (set at 40,000). Data recorded and processed with the embedded
5. Conclusions 286
In this paper, we proposed a fall detection methodology with the following features: Simple 287
frequency filtering, a non-linear feature based on commonly used ones, theshold-based classification, 288
and a periodicity detector to avoid false positives. With these features, we generated a novel fall 289
detection algorithm centered on a Kalman filter stage. The Kalman filter is not computationally 290
intensive as it is Markovian, and it demonstrated to be stable with acceleration data. We selected the 291
Kalman filter because its low computational cost and robustness, it provided an orientation level to 292
a variance feature and at the same time a sinusoidal signal when the subject performed a periodic 293
activity. This last result highly reduces the computational cost to obtain the period of the signal, as it 294
avoids to compute more elaborated approaches such as Wavelets or auto-correlation [19]. 295
The most significant improvement of this approach is the way that a combined non-linear feature 296
(J3) provided higher accuracy (99.4 % with SisFall dataset) than the individual ones (94.3 % and 96.4 %). 297
We obtained this feature after analyzing individually several features with each activity (finally keeping 298
J1andJ2). They were selected as they were highly complementary (each fails in different activities 299
than the other one). 300
This methodology allowed reducing the frequency sample to just 25 Hz. The battery allowed 301
more than 17 hours of continuous acquisition in the full-day tests (without saving data to a SD, it lasts 302
more than one week). This final validation demonstrated that the proposed methodology can be used 303
in real-life with objective population. However, although it behaved well with on-line simulated falls 304
and real-life use, only real falls that may occur at any moment will show its real accuracy. 305
The new non-linear feature used for this work was obtained in an intuitive way, and together with 306
a threshold based classifier it achieved 99.4 % of accuracy with SisFall dataset. We then implemented 307
this methodology in embedded devices and tested it by simulating again all SisFall activities. Finally, 308
we validated our work with full-day tests with the objective population (two female and one male, 309
all over 60 years old). We asked them to do what they use to, including traveling in train and bus, 310
making exercise and cooking or cleaning. With a sampling frequency of 25 Hz (lower than most works 311
in the literature), the devices behaved as expected; just with a couple of false positives due to hits of 312
the device during cooking. This final issue is out of the scope of this work, and a good starting point 313
for a future analysis. 314
Acknowledgments: This work was supported by the project “Plataforma tecnológica para los servicios de 315
teleasistencia, emergencias médicas, seguimiento y monitoreo permanente a los pacientes y apoyo a los programas 316
de promoción y prevención”, code “Ruta-N: FP44842-512C-2013”. A. Sucerquia thanks Instituto Tecnologico 317
Metropolitano –ITM for their support on this work. 318
Author Contributions:All authors conceived and designed the approach; A.S. performed the experiments; A.S. 319
and J.D.L. analyzed the results; and all authors read and approved the final manuscript. 320
Conflicts of Interest:The authors declare no conflict of interest. 321
322
1. Masdeu, J.; Sudarsky, L.; Wolfson, L. Gait Disorders of Aging. Falls and Therapeutic Strategies.; Lippincot
323
-Raven, Philadelphia, 1997. 324
2. Vellas, B.; Wayne, S.; Romero, L.; Baumgartner, R.; Garry, P. Fear of falling and restriction of mobility in
325
elderly fallers. Age and Ageing1997,26, 189–193.
326
3. Lord, S.; Sherrington, C.; Menz, H.Falls in Older People: Risk Factors and Strategies for Prevention., 1st ed.;
327
Cambridge University Press, 2001. 328
4. Delbaere, K.; Crombez, G.; Vanderstraeten, G.; Willems, T.; Cambier, D. Fear-related avoidance of activities,
329
falls and physical frailty. A prospective community-based cohort study.Age and Ageing2004,33, 368–373.
330
5. Lord, S.; Ward, J.; Williams, P.; Anstey, K. An epidemiological study of falls in older community-dwelling
331
women: the Randwick falls and fractures study. Australian Journal of Public Health1993,17, 240–245.
332
6. Henao, G.M.; Curcio Borrero, C.L.; Gómez Montes, J.F. Consecuencias De Las Caídas En Ancianos
333
Institucionalizados.Revista de la asociación Colombiana de Gerontología y Geriatría2009,23, 1221–1233.
7. Igual, R.; Medrano, C.; Plaza, I. Challenges, issues and trends in fall detection systems. BioMedical
335
Engineering OnLine2013,12, 1–24.
336
8. Shany, T.; Redmond, S.J.; Narayanan, M.R.; Lovell, N.H. Sensors-Based Wearable Systems for Monitoring
337
of Human Movement and Falls.IEEE Sensors Journal2012,12, 658 – 670.
338
9. Pannurat, N.; Thiemjarus, S.; Nantajeewarawat, E. Automatic fall monitoring: A review. Sensors2014,
339
14, 12900–12936.
340
10. Habib, M.A.; Mohktar, M.S.; Kamaruzzaman, S.B.; Lim, K.S.; Pin, T.M.; Ibrahim, F. Smartphone-Based
341
Solutions for Fall Detection and Prevention: Challenges and Open Issues. Sensors2014,14, 7181–7208.
342
11. Sucerquia, A.; López, J.; Vargas-Bonilla, F. SisFall: A fall and movement dataset.Sensors2017,17, 1–14.
343
12. Igual, R.; Medrano, C.; Plaza, I. A comparison of public datasets for acceleration-based fall detection.
344
Medical Engineering and Physics2015,37, 870–878.
345
13. Bagala, F.; Becker, C.; Cappello, A.; Chiari, L.; Aminian, K.; Hausdorff, J.M.; Zijlstra, W.; Klenk, J. Evaluation
346
of Accelerometer-Based Fall Detection Algorithms on Real-World Falls. Plos one2012,7, e37062.
347
14. López, J.D.; Ocampo, C.; Sucerquia, A.; Vargas-Bonilla, F. Analyzing multiple accelerometer configurations
348
to detect falls and motion. Latin American Congress on biomedical engineering, 2016. 349
15. Cola, G.; Avvenuti, M.; Vecchio, A.; Yang, G.Z.; Lo, B. An On-Node Processing Approach for Anomaly
350
Detection in Gait. IEEE Sensors Journal2015,15, 6640 – 6649.
351
16. Oner, M.; Pulcifer-Stump, J.A.; Seeling, P.; Kaya, T. Towards the Run and Walk Activity Classification
352
through Step Detection - An Android Application. 34th Annual International Conference of the IEEE 353
EMBS, 2012, pp. 1980 – 1983. 354
17. Wundersitz, D.W.T.; Gastin, P.B.; Richter, C.; Robertson, S.J.; Netto, K.J. Validity of a trunk-mounted
355
accelerometer to assess peak accelerations during walking, jogging and running. European Journal of Sport
356
Science2014,2014, 382–390.
357
18. Clements, C.M.; Buller, M.J.; Welles, A.P.; Tharion, W.J. Real Time Gait Pattern Classification from Chest
358
Worn Accelerometry During a Loaded Road March. 34th Annual International Conference of the IEEE 359
EMBS, 2012. 360
19. López, J.D.; Sucerquia, A.; Duque-Muñoz, L.; Vargas-Bonilla, F. Walk and jog characterization using a
361
triaxial accelerometer. IEEE International Conference on Ubiquitous Computing and Communications 362
(IUCC), 2015, pp. 1406–1410. 363
20. Kalman, R.E. A New Approach to Linear Filtering and Prediction Problems. Transactions of the
364
ASME–Journal of Basic Engineering1960,82, 35–45.
365
21. Bagalà, F.; Klenk, J.; Cappello, A.; Chiari, L.; Becker, C.; Lindemann, U. Quantitative Description of the
366
Lie-to-Sit-to-Stand-to-Walk Transfer by a Single Body-Fixed Sensor. IEEE Transactions on Neural Systems
367
and Rehabilitation Engineering2013,21, 624–633.
368
22. Berg, K.; Wood-Dauphinee, S.; Williams, J.; Maki, B. Measuring balance in the elderly: validation of an
369
instrument. Canadian Journal of Public Health1992,83.
370
23. Otebolaku, A.M.; Andrade, M.T. User context recognition using smartphone sensors and classification
371
models. Journal of Network and Computer Applications2016,66, 33–51.
372
24. Novak, D.; Rebersek, P.; De Rossi, S.M.M.; Donati, M.; Podobnika, J.; Beravs, T.; Lenzi, T.; Vitiello, N.;
373
Carrozza, M.C.; Muniha, M. Automated detection of gait initiation and termination using wearable sensors. 374
Medical Engineering & Physics2013,35, 1713–1720.
375
25. Yuan, X.; Yu, S.; Dan, Q.; Wang, G.; Liu, S. Fall Detection Analysis with Wearable MEMS-based Sensors.
376
16th International Conference on Electronic Packaging Technology (ICEPT), 2015, pp. 1184–1187. 377
26. Noury, N.; Rumeau, P.; Bourke, A.; ÓLaighin, G.; Lundy, J. A proposal for the classification and evaluation
378
of fall detectors. IRBM2008,29, 340–349.
379
27. Noury, N.; Fleury, A.; Rumeau, P.; Bourke, A.; Laighin, G.; Rialle, V.; Lundy, J. Fall detection – Principles
380
![Figure 3. Kalman filtering.(Top panel) Reference filtered acceleration data (Activity F05 of SisFall: jog,trip, and fall) in gravities [G]](https://thumb-us.123doks.com/thumbv2/123dok_us/1079460.1608703/6.595.289.445.516.573/figure-ltering-reference-ltered-acceleration-activity-sisfall-gravities.webp)