Major agricultural changes required to mitigate
phosphorus losses under climate change
M.C. Ockenden
1
, M.J. Hollaway
1
, K.J. Beven
1
, A.L. Collins
2
, R. Evans
3
, P.D. Falloon
4
, K.J. Forber
1
,
K.M. Hiscock
5
, R. Kahana
4
, C.J.A. Macleod
6
, W. Tych
1
, M.L. Villamizar
7
, C. Wearing
1
, P.J.A. Withers
8
,
J.G. Zhou
9
, P.A. Barker
1
, S. Burke
10
, J.E. Freer
11
, P.J. Johnes
11
, M.A. Snell
1
, B.W.J. Surridge
1
& P.M. Haygarth
1
Phosphorus losses from land to water will be impacted by climate change and land
management for food production, with detrimental impacts on aquatic ecosystems. Here we
use a unique combination of methods to evaluate the impact of projected climate change on
future phosphorus transfers, and to assess what scale of agricultural change would be needed
to mitigate these transfers. We combine novel high-frequency phosphorus
fl
ux data from
three representative catchments across the UK, a new high-spatial resolution climate model,
uncertainty estimates from an ensemble of future climate simulations, two phosphorus
transfer models of contrasting complexity and a simpli
fi
ed representation of the potential
intensi
fi
cation of agriculture based on expert elicitation from land managers. We show that
the effect of climate change on average winter phosphorus loads (predicted increase up to
30% by 2050s) will be limited only by large-scale agricultural changes (e.g., 20
–
80%
reduction in phosphorus inputs).
DOI: 10.1038/s41467-017-00232-0
OPEN
C
limate change and the intensi
fi
cation of agricultural food
production pose threats to water quality and aquatic
ecosystem functions and services
1. Biogeochemical
fl
ows,
speci
fi
cally phosphorus (P) and the one-way
fl
ow
2of P from
mineral reserves to farms and into oceans, are already considered
to be beyond the safe operating space for sustainable human
development
3. Although intensi
fi
cation of food production may
well be necessary from the standpoint of human demand and
sustainable human development, this should also take account
of societal concerns about resource use and eutrophication.
Predicting future nutrient transfers into rivers, lakes and
groundwater, for evaluating nutrient abatement strategies, is
challenging, due to the complexity of the landscape processes
involved and the uncertainties in the input data, model structures
and calibration data. Previous studies on the effects of climate and
land use change on water quality have been limited by inadequate
data resolution, lack of appropriate P data, limited model
comparison, and lack of uncertainty analysis
4–7. Here, we
overcome these limitations by combining new high-resolution
catchment discharge and total P (TP) data and climate
projections
with
two
models
of
contrasting
complexity
(process-based Hydrological Predictions for the Environment
(HYPE)
8and a Data-Based Mechanistic (DBM)
9model) for
three diverse agricultural catchments across the UK. The Eden,
Cumbria (predominantly livestock), the Wensum, Norfolk
(predominantly arable) and the Avon, Hampshire (mixed
farming) are representative of the country
’
s different climatic
conditions, soil types, hydrology and farming systems. We
determine possible future agricultural management options by
consultation with stakeholders in the three catchments. We
estimate future P export loads under combined agricultural
intensi
fi
cation and future climate using projections from a new
high-resolution (1.5 km grid) regional climate model (RCM-1.5
km) for the UK
10and from the UK Climate Projections 2009
Weather Generator
11(UKCP09-WG). RCM-1.5 km is able to
simulate sub-daily precipitation characteristics better than coarser
resolution climate models, particularly for short-duration,
summer convective storms
10, and makes a more realistic estimate
of the intensity and duration of extreme events
12,13which have
previously been shown to transfer a large proportion of the
annual total P load
14, 15. We assess what scale of agricultural
change would be needed to mitigate the transfers predicted under
climate change. Michalak
1notes that climate research and water
quality research are usually conducted entirely separately, partly
due to the often differing scales of interest, and recommends
that for better understanding of climate change effects, we need
to
bring
together
the
two
disciplines.
Our
integrated,
multi-disciplinary study follows these recommendations, with the
potential to contribute to the understanding of likely future P
losses. We show that the predicted increase in winter P loads due
to climate change (up to 30% by 2050s) is greater than the
technically feasible reduction from mitigation measures estimated
in previous studies
16. Our study suggests that only large-scale
agricultural changes (e.g., 20
–
80% reduction in P inputs) will
limit the projected impacts of climate change on P loads in these
catchments.
Results
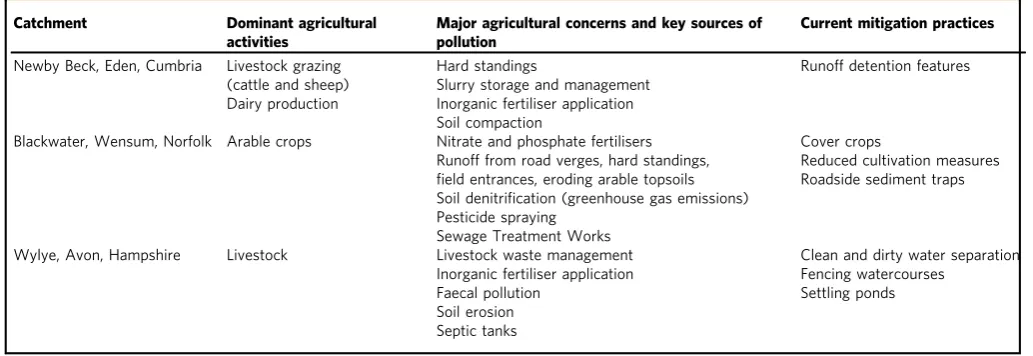
Current phosphorus pollution sources and mitigation
. The
current agricultural practices, management concerns, sources of
pollution and current mitigation practices in each catchment,
established from interaction with farmers, land managers and
other stakeholders, are given in Table
1
. For livestock-dominated
catchments, the storage and spreading of organic livestock waste
is a major concern, with inappropriate storage or insuf
fi
cient
storage capacity frequently resulting in farmers being forced to
spread in suboptimal conditions, when the ground is frozen or
saturated and the chance of heavy rainfall is high. The presence of
heavy machinery on the land when the ground is wet can cause
acute soil compaction, reducing in
fi
ltration and increasing
the likelihood of surface runoff generation. For arable and
horticulture-dominated catchments, diffuse pollution from
nitrate and phosphate fertilisers is a major concern. In addition,
soil erosion from roadside verges and
fi
eld entrances, where
frequent passage of farm machinery can damage the soil
struc-ture, results in sediment and nutrient laden road runoff when it
rains. In both livestock and crop growing catchments, hard
standings are identi
fi
ed as key sources of pollution, particularly
where drain systems do not separate clean rainwater from dirty
yard water.
Current strategies for mitigating phosphorus pollution depend
on the key sources and on the hydrogeology of the catchment. In
surface
–
water-dominated catchments, mitigation practices are
currently aimed at breaking up the pollution transfer pathways.
Hence, runoff detention features and settling ponds, designed to
slow the
fl
ow and capture sediment and nutrients, are in current
use. In groundwater-dominated catchments, mitigation practices
Table 1 Major agricultural practices and pollution concerns for three catchments in the UK
Catchment Dominant agricultural activities
Major agricultural concerns and key sources of pollution
Current mitigation practices
Newby Beck, Eden, Cumbria Livestock grazing
(cattle and sheep)
Hard standings
Slurry storage and management
Runoff detention features
Dairy production Inorganic fertiliser application
Soil compaction
Blackwater, Wensum, Norfolk Arable crops Nitrate and phosphate fertilisers Cover crops
Runoff from road verges, hard standings,
field entrances, eroding arable topsoils
Reduced cultivation measures Roadside sediment traps Soil denitrification (greenhouse gas emissions)
Pesticide spraying Sewage Treatment Works
Wylye, Avon, Hampshire Livestock Livestock waste management Clean and dirty water separation
Inorganic fertiliser application Fencing watercourses
Faecal pollution Settling ponds
are aimed more at tackling sources and preventing mobilisation
of sediment and phosphorus, using reduced cultivation measures
and cover crops, or fencing streams to prevent livestock access.
Stream
fl
ow and phosphorus loads under current conditions
.
Using the parameters and models identi
fi
ed using the observed
fi
eld data (Supplementary Data
3
(HYPE) and Supplementary
Table
1
(DBM)), models are driven with the baseline climate data
from UKCP09-WG to generate a range of P loads valid for
cur-rent conditions (Supplementary Data
1
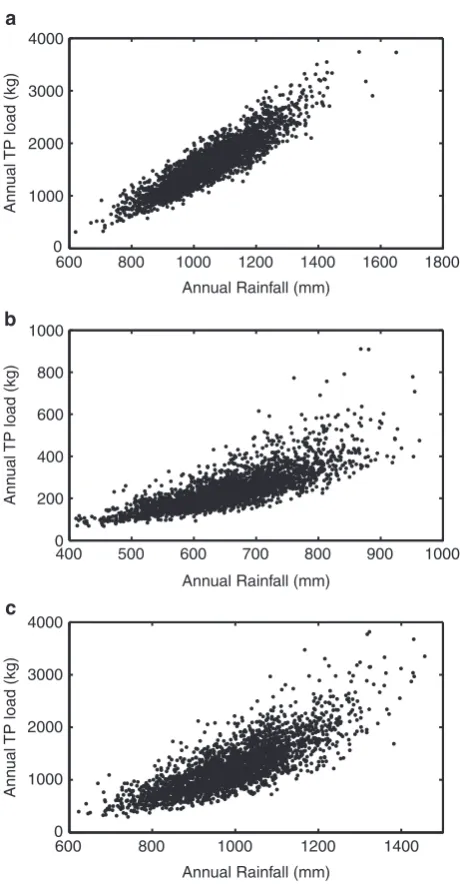
). The dominant effect of
rainfall in driving diffuse P loads from agricultural land is clearly
shown by the relationship between annual rainfall and annual P
load (Fig.
1
), where annual rainfall explains between 61%
(Wensum) and 82% (Eden) of the annual P load, including the
variability over 26 years of each model run. In spite of the
non-linearity introduced by including a representation of the
hydrological and soil processes in the process-based model
HYPE (shown by deviation from the straight line in Fig.
1
), this
non-linearity is still relatively small compared to the dominant
rainfall driver.
Projections under climate change only
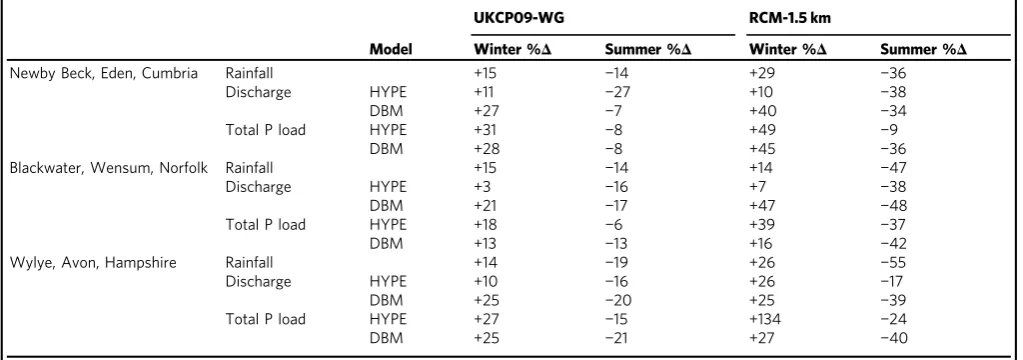
. Considering climate
change alone initially, both the HYPE and DBM models
predict very similar trends for future P exports, with increase
in winter rainfall resulting in larger median winter
fl
ows and
correspondingly larger winter P loads (up to 31% increase,
Table
2
). Larger changes in P load (25
–
31%) are expected in the
wetter Eden and Avon catchments, than the Wensum (13
–
18%).
In summer, decreases in median
fl
ow result in a decrease in
median P load (6
–
21%). Seasonal changes in future rainfall are
pronounced, with a 14
–
15% increase in median winter rainfall
predicted by UKCP09-WG for the 2050s high emissions scenario
across the Eden, Wensum and Avon catchments, and a 14
–
19%
reduction in summer rainfall (Table
2
). Larger percentage
changes in rainfall,
fl
ow and P loads are shown with the
high-resolution climate model, which may re
fl
ect both the better
representation of extreme rainfall and a projection further into
the future. However, as there is only one run of RCM
–
1.5 km,
there can be no assessment of uncertainty
13. These changes in
rainfall patterns, including higher rainfall volumes and intensities,
which have been projected by climate models for some time, are
already being con
fi
rmed in observed rainfall records
17.
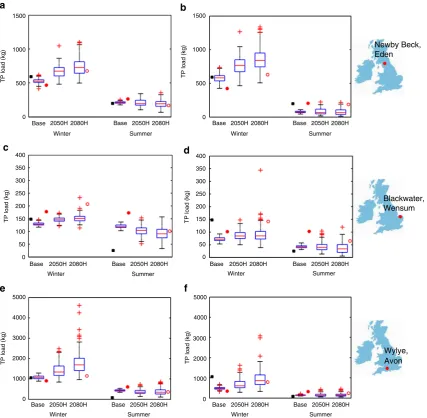
Total P loads from the HYPE and DBM models, driven by
multiple runs of the UKCP09-WG, are shown in Fig.
2
, with the
high emissions scenario chosen as most representative of our
current pathway. The inter-annual variability is very large, but,
for both models, trends in the median winter P load show a clear
increase for all catchments (by 2050s, around 30% in the Eden
and Avon, 10% in the Wensum). In contrast, summer P exports
show a decrease in all catchments (up to 20%), although the
contribution of the summer load to the annual load is small,
typically
<
15%, except in the drier Wensum catchment where
there is less difference between summer and winter loads. For
each of the catchments, the average observed seasonal P load,
based on near-continuous sampling, is shown alongside the
baseline model predictions. The single projection using the
convection-permitting RCM-1.5 km is shown alongside the 2080s
range, and generally lies within the uncertainty range estimated
with the UKCP09-WG probabilistic projections. Compared to its
baseline prediction, the P loads from RCM-1.5 km demonstrate
the same trends as with UKCP09-WG, indicating that although
the rainfall intensity is more realistically predicted, and
particularly for summer convective storms
13, these storms do
not make a signi
fi
cant difference to the median summer P
exports. Although the results from RCM-1.5 km are not directly
comparable to those using UKCP09-WG, because of the different
time frame and the lack of uncertainty, they do not appear to
show signi
fi
cant differences. However, the use of this extra
climate model, giving results that are consistent with those from
UKCP09-WG, adds further credence to the results.
As the estimations of change in phosphorus load from the
DBM and HYPE models are similar, this suggests that the main
mechanism driving the changes in phosphorus load is the change
in seasonal rainfall totals. Other factors, such as temperature,
which are included in HYPE but not in the DBM model, may also
contribute, but this contribution is small compared to the
dominant driver. Similarly, the lack of signi
fi
cant difference
between results using the convection-permitting climate model
and UKCP09-WG indicate that although rainfall intensity may
600 800 1000 1200 1400 1600 1800
0 1000 2000 3000 4000
Annual Rainfall (mm)
Ann
ual
TP load (kg)
400 500 600 700 800 900 1000
0 200 400 600 800 1000
Annual Rainfall (mm)
Ann
ual
TP load (kg)
600 800 1000 1200 1400
0 1000 2000 3000 4000
Annual Rainfall (mm)
Ann
ual
TP load (kg)
a
b
c
Fig. 1The relationship between annual total phosphorus load and rainfall in three UK catchments. Annual total phosphorus (TP) load and rainfall are from one behavioural parameter set in the Hydrological Predictions for the
Environment (HYPE) model, for years 5–30 from 100 runs of baseline
conditions foraNewby catchment, Eden (R2=0.82,p<0.01),bBlackwater
catchment, Wensum (R2=0.61,p<0.01) andcWylye catchment, Avon
(R2=0.63,p<0.01). The dominant driver of annual P load is annual rainfall
also be a contributing factor, it is not as important as the change
in rainfall volumes. All projections for
fl
ow and P load, for all
emissions scenarios, including uncertainty and percentage
changes are given in Supplementary Data
1
.
Projections under combined climate and agricultural change
.
We combine the modelling presented above with a simple
representation of future land management scenarios, which
were determined following structured stakeholder elicitation
workshops in each of the catchments. Stakeholders discussed
and selected likely land management options from a range of
possibilities. Most participants favoured the use of cover
crops; this was strongest in the arable catchment, where this
management measure is already in use and has undergone both
fi
eld testing and modelling of impact
18. Soil conservation is of
high importance in this catchment, where erosion of arable
topsoil has been identi
fi
ed as a key concern (Table
1
). In the more
livestock-dominated catchments, an increase in winter housing
for livestock and increase in slurry spreading were considered
most likely. Both of these measures would affect the P loading on
the soil, either in timing or quantity, and are likely to exacerbate
the already identi
fi
ed concern of spreading livestock waste
(Table
1
). The percentage of stakeholders in agreement with these
scenarios is given in Supplementary Fig.
1
.
Spatial representations of speci
fi
c land uses or land
manage-ment changes are highly uncertain at a local scale
19, and
semi-distributed, process-based models have been shown as not
fi
t for
Newby Beck, Eden
Blackwater, Wensum
Wylye, Avon 1500
a
b
c
d
e
f
400
5000
4000
3000
1000
0 Base 2000
5000
4000
3000
1000
0 2000 350
300
250
200
TP load (kg)
TP load (kg) TP load (kg)
TP load (kg)
150
100
50
0
400
350
300
250
200
150
100
50
0 Base
1000
TP load (kg) 500 TP load (kg)
0
1500
1000
500
0 Base 2050H 2080H Base 2050H 2080H
2050H 2080H Base 2050H 2080H Summer
Base 2050H 2080H Summer Winter
Summer
Base 2050H 2080H Summer
Base 2050H 2080H Summer Base 2050H 2080H
Summer Winter
2050H 2080H Winter
Base 2050H 2080H Winter Base 2050H 2080H
Winter Base 2050H 2080H
Winter
Fig. 2Range of likely seasonal total phosphorus loads exported from three UK catchments in the future. Box and whisker plots show the range of likely winter and summer total phosphorus (TP) loads predicted by Data-Based Mechanistic models (DBM) and process-based Hydrological Predictions for the
Environment model (HYPE). TP loads for Newby Beck catchment, Eden, winter and summer from DBMaand HYPEb; TP loads for Blackwater catchment,
Wensum, winter and summer from DBMcand HYPEd; TP loads for Wylye catchment, Avon, winter and summer from DBMeand HYPEffor present day
conditions (Base), and future conditions representing 2050s (2040–2069) and 2080s (2070–2099) from UK Climate Projections 2009 Weather
Generator, high emissions scenarios (2050H and 2080H respectively). HYPE results are mean of all runs with behavioural parameter sets.Boxindicates
inter-quartile range (25th–75th percentile), with median marked asred line;whiskersextend 1.5 times interquartile range beyond box, or to furthest data point if smaller. Outliers (beyondwhiskers) are marked asred+. Observed winter and summer TP loads for 2012/13 are marked asblack squares. Winter and summer TP loads predicted using rainfall from high-resolution climate model are marked asredfilled circles(baseline conditions) andred unfilled circles
purpose to model such detailed changes when data on parameters
is lacking
20. Therefore, we do not model any mitigation measures
speci
fi
cally; this is justi
fi
ed due to the inability of nutrient transfer
models to include land management changes without large
increases in uncertainty. Instead, we represent the agricultural
changes identi
fi
ed by expert elicitation as degrees of intensi
fi
ca-tion of agricultural practices (+20, +50 and +80% increase in P
inputs or equivalent reductions). An increase in P inputs
represents, for example, increased application of fertilisers and
manures, higher stocking densities or an increase in direct
connectivity of sources to watercourses. Conversely, a decrease in
P inputs can represent decreased application of in fertilisers or
manures, more uptake and removal of phosphorus by plants or
animals, or disruption of transfer pathways. This simple and
transparent method of representing intensi
fi
cation enables the
climate change impact to be evaluated both with and without
management interventions, and without the confounding
uncer-tainty associated with modelling land management changes.
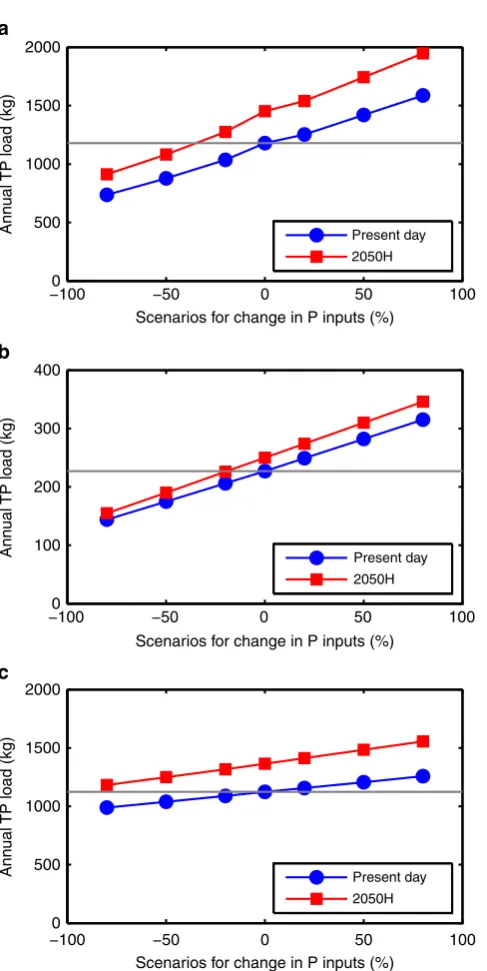
Projections of P load using HYPE under climate change (2050s,
high-emissions scenario) and changing intensi
fi
cation up to
±
80% (Fig.
3
) indicate that reductions in P inputs in all
catchments would be required to offset the increase resulting
from climate change. The model uses parameters based on the
present day calibration, i.e., it assumes that initial soil P status in
the future is the same as for present day. Using this assumption, a
reduction in P inputs of at least 80% would be required in the
Avon, around 20% reduction in the Wensum and 30% reduction
in the Eden to maintain P losses from the catchments at the
present day levels. The full range of modelled P input scenarios
and all emissions scenarios are given in Supplementary Data
2
.
For the present day conditions, decreasing P inputs by 80% in the
Avon makes only a 12% difference to the annual P load,
compared to 37% in the Wensum and 38% in the Eden, meaning
that a much larger reduction in P inputs is required in the Avon
to offset the increase resulting from climate change. This re
fl
ects
the different sources of P in the Avon, which are not all
agricultural: there is a high background concentration of total P at
low
fl
ows (around 0.12 mg l
−1). A signi
fi
cant proportion is due to
sewage treatment works and to rural septic tanks. There may also
be a minor contribution from apatite nodules in the Chalk which
underlies this catchment
21.
Given the importance of rainfall for P transfers
14, and
particularly in winter when catchments are generally more
saturated, it may be prudent for policy advisors and land
managers to prioritise mitigation measures that reduce stores of P
(and other pollutants) in the soil and address winter runoff.
This could also lessen the impact of extreme events on in-stream
ecological communities, which can be reset by large
geomorpho-logical changes and nutrient transfers that may occur during
fl
ooding
22. In summer, our model data suggest that the reduction
in discharge will be accompanied by a comparable reduction in P
loss, keeping concentration levels similar (Supplementary Fig.
2
).
However, where point sources contribute to P loads, unless these
sources are also reduced, a reduction in discharge in summer
could result in an increase in P concentration and greater risk of
degradation in ecological status.
Discussion
The effects of mitigation measures are hard to identify
in observed data, because they are heavily masked by the
inter-annual variability in rainfall, which translates to the large
range in P loads under both simulated present day and future
climate conditions (Fig.
2
). The effects are further obscured in
catchments where non-agricultural sources of P are a dominant
contributor to poor water quality. However, overall trends in the
fl
ow regime between the present day and future are clear in
Table
2
(with full uncertainty ranges in Supplementary Data
1
),
which shows large percentage increases in winter rainfall and
discharge. Increases in rainfall volume and intensity both have the
potential to increase phosphorus transfers, through increased
−1000 −50 0 50 100
500 1000 1500 2000
Scenarios for change in P inputs (%)
Ann
ual
TP load (kg)
Present day
2050H
−1000 −50 0 50 100
100 200 300 400
Scenarios for change in P inputs (%)
Ann
ual
TP load (kg)
Present day 2050H
−100 −50 0 50 100
0 500 1000 1500 2000
Scenarios for change in P inputs (%)
Ann
ual
TP load (kg)
Present day
2050H
a
b
c
Fig. 3Variation in annual total phosphorus load under combined climate change and agricultural change scenarios for three UK catchments. Predicted changes to annual total phosphorus (TP) load from the mean of all behavioural runs from Hydrological Predictions for the Environment model (HYPE). Climate change scenario is 2050s high emissions (2050H) from UK Climate Projections 2009 Weather Generator. Agricultural change
scenarios are represented by modifying P inputs by up to±80%. Present
day and 2050s high emissions scenario with up to±80% change in P
inputs for Newby Beck, Edena, Blackwater, Wensumband Wylye, Avonc.
surface runoff and associated soil erosion. Also, increased
recharge of deeper water reserves may result in more transfer of
dissolved phosphorus forms. The dominance of high rainfall, as
a driver of phosphorus load (Fig.
1
) has been noted in other
studies
14,
particularly
during
high
erodibility
periods.
The relationship could be used on its own as a simple estimator of
future phosphorus load, (e.g., as in Ockenden et al.
15), but the
models used here improve on this simple estimation by including
the non-stationarity of the relationship which results from the
change in rainfall distribution in the future and the resulting
change in effective rainfall.
In addition, measurable mitigation effects are buffered because
stores of
‘
legacy
’
P (and also nitrogen) in the soil and other areas
of catchments have accumulated over several decades
23. These
legacy stores present a challenge to water quality remediation
24as
it may take several more decades of little or no further P input
before the stores are depleted to levels last seen before large-scale
intensi
fi
cation of agriculture in the middle of the 20th Century.
Reductions in P inputs (particularly if P becomes limiting) could
have implications for agricultural production, although this may
be compensated for by higher productivity of crops under future
climate scenarios
25. Indeed, the reduction in P inputs suggested
here for sustainable water quality may not be compatible with the
need for increased agricultural productivity and will require
reassessment of priorities
26. Due to the time lags in response,
such as gradual depletion of soil P or the rate of adaptation by
farmers
27, it is important to adopt an integrated approach to
understanding
climate
effects
on
sustainable
agriculture.
Interactions between climate and agro-ecosystems are highly
non-linear and changes to either will have feedback effects on the
other
28. This is particularly important for hydrology and nutrient
transfer projections, where previous work has shown that the
non-linearities might have different magnitudes of change
depending
on
whether
the
climate
projections
were
bias-corrected
29.
This study shows that the underlying trend of increasing
P losses under climate change (up to 30% by 2050s) is larger
than the theoretical reduction recently predicted for maximum
uptake of farmer-preferred mitigation options (around 15% for
catchment scale
16). These
fi
ndings are also applicable to other
agricultural regions in the world with temperate climates where
wetter winters are projected. Our analysis indicates that we would
need to adopt large agricultural changes (e.g., 20
–
80% reduction
in P inputs) to counter the increased winter P losses projected by
climate change. The example of P inputs has been used here to
demonstrate the relative scale of climate change and land
management change impacts. We have modelled changing P
inputs, which can be easily interpreted, to represent many more
spatially speci
fi
c mitigation measures, which models are not
capable of representing without big increases in uncertainty. We
are not suggesting that P inputs should be the sole focus of
mitigation measures, indeed we recognise that such measures
need to be catchment speci
fi
c, addressing sources, mobilisation
and transfer along the transfer continuum
30. There are
many motives and challenges for farmers and stakeholders in
choosing
31or accepting
32mitigation options. Stakeholders in this
study are already quite well focussed on appropriate measures for
their speci
fi
c catchments, but we demonstrate that these measures
may not be enough in the face of the climate challenge. At a
catchment scale, currently adopted mitigation measures have not
been able to realise a comparable magnitude of reduction to
counter the increase projected by climate change.
Methods
Study catchments andfield data. The study catchments comprised three highly instrumented landscapes within the UK Defra Demonstration Test Catchments (DTC) Programme33: Newby Beck at Newby, Eden, Cumbria (54.59° N, 2.62° W; 12.5 km2); Blackwater at Park Farm, Wensum, Norfolk (52.78° N, 1.15° E; 19.7 km2); Wylye at Brixton Deverill, Avon, Hampshire (51.16° N, 2.19° W; 50.2 km2). Meteorological,flow and nutrient data are available at hourly resolution for parts of the period October 2011–September 2014. Further details of these catchments and the monitoring are available in Outram et al.34.
Hydrological modelling. We applied two hydrological models of different complexity to the three DTC catchments. Parameters for both models were identified on all, or part, of the period 1 October 2011–30 September 2013, and validated on the period 1 October 2013–30 September 2014, using observed
field data.
The Hydrological Predictions for the Environment (HYPE) model8is a hydrological model for simulating waterflow and transport and turnover of nitrogen and phosphorus. The model is semi-distributed, dividing the landscape into classes according to soil type, land use and altitude. In agricultural lands the soil is divided into up to three layers, each with associated parameters. Soil, water and nutrient processes are simulated, with surface runoff, macroporeflow, tile drainage and outflow calculated from individual soil layers. HYPE runs at a daily timestep, although the dailyflows and phosphorus loads were calculated from the sub-daily observed data.
Nutrient inputs into the model in the form of fertiliser and manure were determined from the Defra British Survey of Fertiliser Practice. Nutrient inputs from point sources were added to each reach of the river or stream based on the
Table 2 Future predicted percentage changes in hydrology and total phosphorus loads for three catchments in the UK
UKCP09-WG RCM-1.5 km
Model Winter %Δ Summer %Δ Winter %Δ Summer %Δ
Newby Beck, Eden, Cumbria Rainfall +15 −14 +29 −36
Discharge HYPE +11 −27 +10 −38
DBM +27 −7 +40 −34
Total P load HYPE +31 −8 +49 −9
DBM +28 −8 +45 −36
Blackwater, Wensum, Norfolk Rainfall +15 −14 +14 −47
Discharge HYPE +3 −16 +7 −38
DBM +21 −17 +47 −48
Total P load HYPE +18 −6 +39 −37
DBM +13 −13 +16 −42
Wylye, Avon, Hampshire Rainfall +14 −19 +26 −55
Discharge HYPE +10 −16 +26 −17
DBM +25 −20 +25 −39
Total P load HYPE +27 −15 +134 −24
DBM +25 −21 +27 −40
measured discharges and pollutant concentrations from the Environment Agency national register of consented discharges for the period 2010–2012, as used in a national source apportionment tool35. No changes were made to point sources for the future.
Parameters in the HYPE model were chosen using the Generalised Likelihood Uncertainty Estimation (GLUE) methodology36which samples the multi-dimensional parameter space tofind sets of parameters which produce acceptable models which satisfy the evaluation criteria (termed behavioural models). While we recognise the sampling size is not extensive, given other experimental uncertainties we consider the chosen trajectories are indicative of the potential for change and in balance with all other computational and experimental design constraints. Models were evaluated using the Nash Sutcliffe Efficiency (NSE) coefficient37for discharge (Q) and for P. The thresholds for behavioural parameter sets were chosen to give the best 10–15 behavioural parameter sets. For Eden these were: NSE≥0.6 for Q and NSE≥0.5 for P; for Wensum these were NSE≥0.55 for Q and NSE≥0.53 for P; for Avon these were NSE≥0.6 for Q and NSE≥0.6 for P. The ranges for parameter sets used in the projections are given in Supplementary Data3. The HYPE model calibration and validationfit statistics are given in Supplementary Data4. HYPE allows simple user-specified changes to land use or management by variation of the input parameters.
Data-Based Mechanistic (DBM) modelling38, using the CAPTAIN Toolbox for MATLAB39identified transfer function models for rainfall-runoff and rainfall-phosphorus load directly from the high temporal resolution (hourly) data, requiring very few parameters. Either discrete-time or continuous-time transfer function models9, with the structures and parameters given in Supplementary Table1, were identified directly from the hourly resolution observation data.
A second-order discrete-time linear transfer function with no noise model, denoted by [2, 2,δ] takes the form:
y tð Þ ¼ b1þb2z1
1þa1z1þa2z2
u tð δÞ ð1Þ
wherey(t)is model output at timet, u(t)is model input,z−1is the backwards step operator, i.e.,z−1y(t)=y(t−1). b1, b2, a1, a2are parameters determined during
model identification andδis the number of time steps of pure time delay. For a physical interpretation, models are only accepted if they can be decomposed by partial fraction expansion into twofirst-order transfer functions with structure [1, 1,δ] representing fast and slow pathways, with characteristic time constants and steady state gains, i.e.
y tð Þ ¼ bf 1afz1
u tð δÞ þ bs 1asz1
u tð δÞ ð2Þ
wherebfandbsare gains on the fast and slow pathways, respectively, andafandas
are parameters characterising the time constants of the fast and slow pathways respectively.afandasare roots of the denominator polynomial in the second-order
transfer functions above (Eq. (1)).
A second-order continuous-time linear transfer function with no noise model takes the form:
Y sð Þ ¼ b1sþb2 s2þa
1sþa2
esτU sð Þ ð3Þ
where,Y(s)andU(s)represent the Laplace transforms of the output and input, respectively.b1, b2, a1, a2are parameters in the denominator and numerator
polynomials in the derivative operators¼d
dtthat define the relationship between
the input and the output, andτrepresents the delay. Models are only accepted if they can be decomposed by partial fraction expansion into two parallel,first-order transfer functions, i.e.
Y¼ bf
sþaf
esτUþ bs
sþas
esτU ð4Þ
whereafandasare direct reciprocals of the fast and slow time constants
respectively, which define the fast and slow components of the response.bfandbs
are parameters which determine the gain of the fast and slow components, respectively.
Note that parametersb1,b2,a1,a2(and parametersbf,bs,af,as) have different
interpretation, and therefore different values between discrete-time and continuous-time models. The relationship between the parameters (see most Control Engineering textbooks40) between discrete model denoted by superscript d and continuous time model denoted by superscript c is as follows:
for instance, for denominator parameteraf
ad f ¼ea
c
fΔt ð5Þ
while forbfwe have:
bd f ¼ bc f ac f
1eac
fΔt ð6Þ
Models are evaluated according to the Nash Sutcliffe Efficiency (NSE)37and the Young Information Criterion (YIC)38, an objective statistical measure which combines how well the modelfits the data together with a measure of over-parameterisation.
Linear models, using observed rainfall, were identifiedfirst, and then improved where possible by use of the‘effective’rainfall. The rainfall-runoff non-linearity41 was based on the storage state of the catchment, for which the discharge was used as a proxy, i.e.
Reð Þ ¼t R tð ÞðQ tð 1ÞÞβ ð7Þ
whereRe(t)is the effective rainfall at timet, Ris the observed rainfall,Qis the observed discharge andβis a constant exponent which is optimised from the observed data at the same time as model identification. For rainfall-phosphorus load models, linear models using observed rainfall were identifiedfirst, and then improved using the same effective rainfall relationship as identified with the rainfall-runoff model, with the effective rainfall generated one step ahead, using Eq. (7) and the simulated discharge at time (t−1).
The DBM models are able to make best use of the high-frequency data to capture P dynamics which typically occur at time scales of hours rather than days. High temporal resolution measurements of nutrient dynamics have previously demonstrated that a daily time step is insufficient to capture sediment and P dynamics42, resulting in an underestimation of export loads. Definitions, structure, and parameters for the models identified are provided in Supplementary Table1, along with modelfit statistics for the identification and validation periods (Supplementary Data5).
Both the water quality model HYPE and the simple DBM model assume that relationships and processes identified on the basis of present day data will still hold in the future. However, the HYPE model, despite the uncertainty associated with the large parameter set, allows variation of the parameters to simulate changing environmental and management conditions, whereas the simple DBM model reduces parameter uncertainty but has no explicit way to change the identified parameters. We have used the DBM models to investigate the P response to climate change only.
Future climate data. We drive the models with future climatic rainfall and meteorological data from a convection-permitting (1.5 km grid) regional climate model (RCM-1.5 km), which is a configuration of the Met Office Unified Model43, and with data from the UKCP09 Weather Generator11, at hourly resolution for DBM and daily resolution for HYPE. The differences between UKCP09-WG and RCM-1.5 km are given in Supplementary Table2
The UKCP09 Weather Generator11creates synthetic time series of weather variables at daily and hourly frequency, at 5 by 5 km grid square resolution, which are consistent with the underlying UKCP09 Climate Projections44(from an ensemble of 11 RCMs, 25 km grid). The Weather Generator applies stochastic models to generate many different, but statistically equivalent, time series which are stationary for a given time slice (30-year baseline or future time period) and emissions scenario.
The Weather Generator uses a stochastic rainfall model, with other variables generated according to the rainfall state, based on empirical relationships between climate variables in a baseline dataset of observations (1961–1995, 5 km grid). Future weather generator time series are generated by perturbing with change factors taken from the probabilistic projections of UKCP09. This ensures that the overall statistics (means and standard deviations) of the weather generator distributions are the same as those projected by UKCP09. The generated climate distributions include both the natural climate variability (including the significant spatial signature as observed in the 5 km grid baseline observations) and some uncertainty from the UKCP09 projections (as change factors are derived from the 11 member ensemble), giving a statistically-based distribution of climate at each chosen location, for each emissions scenario.
This study employed random number seeds to generate 100 plausible time series of 30 years (30 year baseline period and 30 year future time period), for each location, for each specified emissions scenario, as detailed below. The parameters used for generation of the UKCP09-WG time series data are given in
Supplementary Table3(Newby Beck, Eden), Supplementary Table4(Blackwater, Wensum) and Supplementary Table5(Wylye, Avon).
RCM-1.5 km is much more computationally demanding and, therefore, we use results from two 12-year simulations: one for the period 1996−2009 and a 12-year simulation representative of the year 2100, under the RCP 8.5 scenario. The high resolution, convective permitting model allows more realistic representation of rainfall at a local scale, particularly for extreme events13.
more crops on the same land. The results of the discussions and the questionnaires were used to define simple land management change scenarios that could be easily incorporated into the HYPE model. Due to the semi-distributed nature of the model, it was not possible to make spatially explicit land use changes. Using lumped land use changes (not related to location, but related to the hydrological response unit) increased uncertainty in the result, as there was large variability in the result from different spatial representations. As the discussions and questionnaires pointed to intensification in farming, it was decided to include this in as simple and transparent a way as possible. The percentage changes for agricultural P inputs (±20,±50,±80% relative to baseline) are arbitrary, but cover a range of different scenarios for intensification. This simplified representation of likely agricultural changes could be applied transparently to all three catchments without the spatial uncertainty associated with more specific measures.
Projections under climate change only. We make future projections of discharge and P load under climate change only using both HYPE and DBM with the same parameter sets as identified with the observedfield data. Using climate data from UKCP09-WG, annual loads (for baseline and scenario conditions) were calculated by taking the average over the last 26 years of each 30 year run, with thefirst 4 years being used as a spin-up period. For each 30 year run with HYPE, the averages were also taken over all behavioural runs. Winter loads were calculated by summing over the months December, January and February for each run. Summer loads were summed over June, July and August. 5th and 95th percentiles were calculated from the spread over 100 runs. Using climate data from RCM-1.5 km (12 year run), annual and seasonal loads were calculated by taking the mean over years 3–12.
Projections under combined climate and agricultural change. We made future projections of P load under combined climate change and agricultural change scenarios using HYPE. The agricultural scenarios, indicating a change in intensification of agriculture, were represented by increasing or decreasing the fertilizer and manure inputs (−80,−50,−20%, no change, +20, +50, +80%). No changes were made to point source inputs. Annual and seasonal loads were calculated as above.
Data Availability. The DTC data are available athttp://www.environmentdata. org/dtc-archive-project/dtc-archive-project(Browse by Collection>Defra Collections>Eden/Hampshire Avon/Wensum Demonstration Test Catchment Data). UKCP09 data and access to the Weather Generator is available at http://ukclimateprojections.metoffice.gov.uk/.
The data underlying thefigures in this manuscript are openly available from Lancaster University data archive athttps://dx.doi.org/10.17635/lancaster/ researchdata/110.
Received: 6 December 2016 Accepted: 14 June 2017
References
1. Michalak, A. M. Study role of climate change in extreme threats to water quality.Nature535, 349–350 (2016).
2. Elser, J. & Bennett, E. A broken biogeochemical cycle.Nature478, 29–31 (2011).
3. Carpenter, S. R., Bennett, E. M. Reconsideration of the planetary boundary for phosphorus.Environ. Res. Lett.6, 014009 (2011).
4. Crossman, J. et al. The interactive responses of water quality and hydrology to changes in multiple stressors, and implications for the long-term effective management of phosphorus.Sci. Total Environ.454, 230–244 (2013). 5. Dunn, S. M., Brown, I., Sample, J. & Post, H. Relationships between climate,
water resources, land use and diffuse pollution and the significance of uncertainty in climate change.J. Hydrol.434, 19–35 (2012).
6. El-Khoury, A. et al. Combined impacts of future climate and land use changes on discharge, nitrogen and phosphorus loads for a Canadian river basin. J. Environ. Manag.151, 76–86 (2015).
7. Hallin-Pihlatie, L., Rintala, J. & Hansen, H. S. Integration of climate change and land-use scenarios in nutrient leaching assessment.Int. J. Clim. Chang. Str.5, 285–303 (2013).
8. Lindström, G., Pers, C., Rosberg, J., Strömqvist, J. & Arheimer, B. Development and testing of the HYPE (Hydrological Predictions for the Environment) water quality model for different spatial scales.Hydrol. Res.41, 295–319 (2010). 9. Young, P. C. & Garnier, H. Identification and estimation of continuous-time,
data-based mechanistic (DBM) models for environmental systems.Environ. Modell. Softw.21, 1055–1072 (2006).
10. Kendon, E. J. et al. Heavier summer downpours with climate change revealed by weather forecast resolution model.Nat. Clim. Change4, 570–576 (2014). 11. Jones, P., Harpham, C., Kilsby, C. G., Glenis, V. & Burton, A. UK Climate
Projections science report: Projections of future daily climate for the UK from
the Weather Generator. Met Officehttp://ukclimateprojections.metoffice.gov. uk/media.jsp?mediaid=87944&filetype=pdf(2010).
12. Chan, S. C. et al. The value of high-resolution met office regional climate models in the simulation of multihourly precipitation extremes.J. Clim.27, 6155–6174 (2014).
13. Kendon, E. J. et al. Do convection-permitting regional climate models improve projections of future precipitation change?Bull. Am. Meteor. Soc.98, 79–93 (2017).
14. Johnes, P. J. Uncertainties in annual riverine phosphorus load estimation: Impact of load estimation methodology, sampling frequency, baseflow index and catchment population density.J. Hydrol.332, 241–258 (2007). 15. Ockenden, M. C. et al. Changing climate and nutrient transfers: evidence from
high temporal resolution concentration-flow dynamics in headwater catchments.Sci. Total Environ.548–549, 325–339 (2016).
16. Collins, A. L. et al. Tackling agricultural diffuse pollution: what might uptake of farmer-preferred measures deliver for emissions to water and air?Sci. Total Environ.547, 269–281 (2016).
17. Fischer, E. M. & Knutti, R. Observed heavy precipitation increase confirms theory and early models.Nat. Clim. Change6, 986–991 (2016).
18. Taylor, S. D., He, Y. & Hiscock, K. M. Modelling the impacts of agricultural management practices on river water quality in Eastern England.J. Environ. Manage180, 147–163 (2016).
19. Dendoncker, N., Schmit, C. & Rounsevell, M. Exploring spatial data uncertainties in land-use change scenarios.Int. J. Geogr. Inform. Sci.22, 1013–1030 (2008).
20. Dean, S., Freer, J., Beven, K., Wade, A. J. & Butterfield, D. Uncertainty assessment of a process-based integrated catchment model of phosphorus. Stoch. Env. Res. Risk A23, 991–1010 (2009).
21. Yates, C. A. & Johnes, P. J. Nitrogen speciation and phosphorus fractionation dynamics in a lowland Chalk catchment.Sci. Total Environ.444, 466–479 (2013). 22. Death, R. G., Fuller, I. C. & Macklin, M. G. Resetting the river template: the
potential for climate-related extremefloods to transform river geomorphology and ecology.Freshwater Biol.60, 2477–2496 (2015).
23. Powers, S. M. et al. Long-term accumulation and transport of anthropogenic phosphorus in three river basins.Nat. Geosci.9, 353–356 (2016).
24. Sharpley, A. et al. Phosphorus legacy: overcoming the effects of past management practices to mitigate future water quality impairment.J. Environ. Qual.42, 1308–1326 (2013).
25. Challinor, A. J. et al. A meta-analysis of crop yield under climate change and adaptation.Nature Clim Change4, 287–291 (2014).
26. Doody, D. G. et al. Optimizing land use for the delivery of catchment ecosystem services.Front. Ecol. Environ.14, 325–332 (2016).
27. Moore, F. C. & Lobell, D. B. Adaptation potential of European agriculture in response to climate change.Nat. Clim. Change4, 610–614 (2014). 28. Falloon, P. & Betts, R. Climate impacts on European agriculture and water
management in the context of adaptation and mitigation-The importance of an integrated approach.Sci. Total Environ.408, 5667–5687 (2010).
29. Cloke, H. L., Wetterhall, F., He, Y., Freer, J. E. & Pappenberger, F. Modelling climate impact onfloods with ensemble climate projections.Q. J. R. Meteor. Soc.139, 282–297 (2013).
30. Haygarth, P. M., Condron, L. M., Heathwaite, A. L., Turner, B. L. & Harris, G. P. The phosphorus transfer continuum: linking source to impact with an interdisciplinary and multi-scaled approach.Sci. Total Environ.344, 5 (2005). 31. Zhang, Y., Collins, A. L. & Gooday, R. D. Application of the FARMSCOPER
tool for assessing agricultural diffuse pollution mitigation methods across the Hampshire Avon Demonstration Test Catchment, UK.Environ. Sci. Policy24, 120–131 (2012).
32. Vrain, E. & Lovett, A. The roles of farm advisors in the uptake of measures for the mitigation of diffuse water pollution.Land Use Policy54, 413–422 (2016). 33. McGonigle, D. F. et al. Developing demonstration test catchments as a platform
for transdisciplinary land management research in England and Wales. Environ. Sci. Process Imp.16, 1618–1628 (2014).
34. Outram, F. N. et al. High-frequency monitoring of nitrogen and phosphorus response in three rural catchments to the end of the 2011-2012 drought in England.Hydrol. Earth Syst. Sci.18, 3429–3448 (2014).
35. Zhang, Y., Collins, A. L., Murdoch, N., Lee, D. & Naden, P. S. Cross sector contributions to river pollution in England and Wales: updating waterbody scale information to support policy delivery for the water framework directive. Environ. Sci. Policy42, 16–32 (2014).
36. Beven, K. & Binley, A. The future of distributed models - model calibration and uncertainty prediction.Hydrol. Process6, 279–298 (1992).
37. Nash, J. E. & Sutcliffe, J. V. Riverflow forecasting through conceptual models part I—A discussion of principles.J. Hydrol.10, 282–290 (1970). 38. Young, P. Top-down and data-based mechanistic modelling of rainfall-flow
dynamics at the catchment scale.Hydrol. Process17, 2195–2217 (2003). 39. Taylor, C. J., Pedregal, D. J., Young, P. C. & Tych, W. Environmental time
40. Franklin, G. F., Powell, J. D. & Emami-Naeini A.Feedback Control of Dynamic Systems, 4th edn (Prentice-Hall, 2002).
41. Beven K.Rainfall-runoff Modelling: the Primer(John Wiley & Sons Ltd 2001). 42. Cassidy, R. & Jordan, P. Limitations of instantaneous water quality sampling in surface-water catchments: comparison with near-continuous phosphorus time-series data.J. Hydrol.405, 182–193 (2011).
43. Walters, D. N. et al. The met office unified model global atmosphere 3.0/3.1 and JULES Global Land 3.0/3.1 configurations.Geosci. Model. Dev.4, 919–941 (2011).
44. Murphy, J. M. et al. UK Climate Projections Science report: Climate Change Projections. Met Office Hadley Centrehttp://ukclimateprojections.metoffice. gov.uk/media.jsp?mediaid=87894&filetype=pdf(2009).
Acknowledgements
This work was funded by the Natural Environment Research Council (NERC) as part of the Nutrients in Catchments to 2050 project (NUTCAT 2050), grants NE/K002392/1, NE/K002430/1 and NE/K002406/1, and supported by the Joint UK BEIS/Defra Met Office Hadley Centre Climate Programme (GA01101). We are grateful to the UK Demonstration Test Catchment (DTC) research platform (Defra projects WQ0210, WQ0211, WQ0212 and LM0304) for provision of thefield data.
The UK Climate Projections (UKCP09, © Crown Copyright 2009) have been made available by the Department for Environment, Food and Rural Affairs (Defra) and the Department of Energy and Climate Change (DECC) under licence from the Met Office, UKCIP, British Atmospheric Data Centre, Newcastle University, University of East Anglia, Environment Agency, Tyndall Centre and Proudman Oceanographic Laboratory. These organisations give no warranties, express or implied, as to the accuracy of the UKCP09 and do not accept any liability for loss or damage, which may arise from reliance upon the UKCP09 and any use of the UKCP09 is undertaken entirely at the users risk.
Author contributions
M.C.O. ran the DBM model and led the writing of the paper. M.J.H. ran the HYPE model. M.L.V. set up HYPE model parameter sets. W.T. assisted with DBM modelling.
C.W. collated the stakeholder information. R.K. ran the 1.5 km climate model for the Northern UK. M.C.O., P.M.H., M.J.H., C.W., K.J.F., P.D.F., R.K., A.L.C., C.J.A.M., K.M.H., R.E. facilitated at stakeholder workshops. P.M.H. was overall project lead with K.J.B., P.D.F., P.J.A.W. and J.G.Z. also helping manage the project. All authors partici-pated in interpretation of results and the writing and editing process.
Additional information
Supplementary Informationaccompanies this paper at doi:10.1038/s41467-017-00232-0.
Competing interests:The authors declare no competingfinancial interests.
Reprints and permissioninformation is available online athttp://npg.nature.com/ reprintsandpermissions/
Publisher's note:Springer Nature remains neutral with regard to jurisdictional claims in published maps and institutional affiliations.
Open Access This article is licensed under a Creative Commons Attribution 4.0 International License, which permits use, sharing, adaptation, distribution and reproduction in any medium or format, as long as you give appropriate credit to the original author(s) and the source, provide a link to the Creative Commons license, and indicate if changes were made. The images or other third party material in this article are included in the article’s Creative Commons license, unless indicated otherwise in a credit line to the material. If material is not included in the article’s Creative Commons license and your intended use is not permitted by statutory regulation or exceeds the permitted use, you will need to obtain permission directly from the copyright holder. To view a copy of this license, visithttp://creativecommons.org/ licenses/by/4.0/.