Volume-5 Issue-2
International Journal of Intellectual Advancements
and Research in Engineering Computations
A bigdata approach for
Student result using mapreduce
1. Ms.K.E.Eswari MCA.,ME., Associate Professor 2. Mr.C.Dineshkumar Final MCA
Department of MCA, Nandha Engineering College, Erode-52 [email protected],[email protected]
Abstract— This paper takes a novel perspective on the problem of clustering high-dimensional data. Instead of attempting to avoid the curse of dimensionality by observing a lower dimensional feature subspace, this project embraces dimensionality by taking advantage of inherently high-dimensional phenomena. More specifically, it is showed that hubness, i.e., the tendency of high-dimensional data to contain points (hubs) that frequently occur in k-nearest-neighbor lists of other points, can be successfully exploited in clustering. The proposed system demonstrates that hubness is a good measure of point centrality within a high-dimensional data cluster, and by proposing several hubness-based clustering algorithms, showing that major hubs can be used effectively as cluster prototypes or as guides during the search for centroid-based cluster configurations. The results demonstrate good performance of the algorithms in multiple settings, particularly in the presence of large quantities of noise. The proposed methods are tailored mostly for detecting approximately hyperspherical clusters and need to be extended to properly handle clusters of arbitrary shapes.
Index Terms— big data analytics; educational data mining; predictive modeling; learning analytics; hadoop; hortonworks sandbox; revolution r enterprise; clustering; regression
INTRODUCTION
Education sector has a lot of data in the form of student information. Application of computers on this data can extract valuable information to provide quality education. Due to this combination of education and computer (data mining), a new research community is growing i.e. Educational Data Mining (EDM). Educational data mining is concerned with mounting methods to
determine facts from data, especially unknown knowledge-driven pattern from educational
repository in order to highlight the strength and weaknesses of the student [1].
An educational institution needs to have an approximate prior knowledge of enrolled students to predict their performance in future academics. This helps them to identify promising students and also provides them an opportunity to pay attention to and improve those who would probably get lower grades. There is no absolute scale for measuring knowledge but examination score is one scale which shows the performance indicator of students. Quality education is one of the most promising responsibilities of any country to his countrymen. Quality education does not mean high level of knowledge produced. But it means that education is produced to students in efficient manner so that they learn without any problem. For this purpose quality education includes features like: methodology of teaching, continuous evaluation, categorization of student into similar type, so that students have similar objectives, educational background etc.
In this paper class X student’s data of Central Board of Secondary Education in all over India is considered for input dataset. Since it contains petabytes of student data, these datasets are considered as big data. In big data concept the traditional data mining algorithms are translated
to Map Reduce algorithms for running them on Hadoop clusters by translating their data analytics logic to the Map Reduce job which is to be run over Hadoop clusters. Hadoop clusters are designed for storing and processing huge amount of data in a distributed computing environment. MapReduce is one of the major hadoop component for distributed data processing. MapReduce programming model consists of two separate and distinct tasks that Hadoop programs perform. The first is the map job, which takes a set of data and converts it into another set of data, where individual elements are broken down into tuples (key/value pairs). The reduce job takes the output from a map as input and combines those data tuples into a smaller set of tuples.
The clustering method is used to identify academically at- risk students and categorize the students accordingly. Since there are many algorithms for data clustering, the K-Means method is used here. The multiple regression algorithm is used for predicting student results. Both algorithms are translated to MapReduce algorithms to run on hadoop clusters. In K- means clustering it consists of 2 parts Map and Reduce. The map function performs the procedure of assigning each sample to the closest center while the reduce function performs the procedure of updating the new centers. In order to decrease the cost of network communication, a combiner function is developed to deal with partial combination of the intermediate values with the same key within the same map task.
The multiple linear regression mapreduce algorithm is applied on student previous result data to build a predictive model. This model can then predict the student final result in the form of grade or marks. This will be helpful for teacher, student and their parents to know in advance about student final predicted result and will enable them to take preventive measure.
RELATED WORKS
There are many institutions that have made use of learning analytics to improve student success and retention. Ourania Petropoulou, Katerina Kasimatis, Ioannis Dimopoulos, and Symeon Retalis, [6] designed LAe-R: A new learning analytics tool in Moodle for assessing students’ performance. A challenging and
demanding task for the teachers in e- learning environments is the assessment of students’ performance. Several learning management systems (LMS) like Moodle offer several assessment tools such as quizzes, scales, ―classic‖ rubrics, etc. Shreyas Kudale, Advait Kulkarni, Asst. Prof. Leena A. Deshpande[8] suggest the use of Hadoop Framework and the ET- L process for Hadoop for performing predictions based on the datasets.
Beth Dietz-Uhler & Janet E. Hurn [5] define learning analytics, how it has been used in educational institutions, what learning analytics tools are available, and how faculty can make use of data in their courses to monitor and predict student performance. They also provide details of several issues and concerns with the use of learning analytics in higher education.
Weizhong Zhao[7] designed Parallel K- Means Clustering Based on MapReduce for clustering , Data clustering has been received considerable attention in many applications, such as data mining, document retrieval, image segmentation and pattern classification. In April of 2011, Clint McElroy[2] designed a system for The Online Student Profile Learning System: a Learner-Centered Approach to Learning Analytics , idea is to take the proven technology-based solution to addressing the retention and success of at-risk students (the Online Student Profile system developed in CPCC’s 2003-08 ) and work with partner colleges to deploy both the OSP and the related faculty and staff development activities in order to improve retention and student success at those colleges.
challenges and research opportunities in the area of LA in relation to each dimension. Kenneth Wottrich[7] propose a research in 2010 to characterize and model the performance of MapReduce applications on typical, scalable clusters based on fundamental application data and processing metrics. He identified five fundamental characteristics which define the performance of MapReduce applications. Then he created five separate bench mark tests, each designed to isolate and test a single characteristic. The results of these benchmarks are helpful in constructing a model for MapReduce applications.
Seyed Reza Pakize[6] make a study on A Comprehensive View of Hadoop MapReduce Scheduling Algorithms which helps researchers. There are three important scheduling issues in MapReduce such as locality, synchronization and fairness. The most common objective of scheduling algorithms is to minimize the completion time of a parallel application and also achieve to these issues. There are many algorithms to solve this issue with different techniques and approaches. Some of them get focus to improvement data locality and some of them implements to provide Synchronization processing.
PROPOSED SYSTEM
The main goal of this paper is to identify academically at- risk students and to develop a predictive model to predict student academic performance in educational institutions, which helps to predict their future results. Student academic performance is affected by numerous factors. The scope of this research is limited to the investigation of learning progression on their academic performance. The proposed system consists of two functionalities:
a) Identifying academically at-risk students b) Prediction of student result
A. Identifying academically at-risk students
The data collected from different applications require proper method of extracting knowledge from large repositories for better decision making. This makes an extreme challenge for institutions using traditional data management mechanism to
store and process huge datasets. So it is required to define a new paradigm called ―Big Data Analytics‖ to re-evaluate current system and to manage and process huge data. We implement a component of Big Data Analytics known as ―Learning Analytics‖. Learning analytics ( LA) refers to the interpretation of a wide range of data produced by and gathered on behalf of students in order to assess academic progress, predict future performance, and spot potential issues. Fig.1 shows the steps for identifying academically at-risk students using LA.
Architecture Diagram over India and is available in SQL format in MySQL Server. Since it contains petabytes of student data, these datasets are considered as Big Data. Hadoop framework can be used for cost effective and faster big data processing, which would enhance the analyzing process. Hadoop is an open-source software framework for storing data and running applications on clusters of commodity hardware, it provides massive storage for data, and enormous processing power. Hadoop is composed of four core components—Hadoop Common, Hadoop Distributed File System (HDFS), MapReduce and YARN.
Distributed File System (HDFS) and used further by various nodes with Mappers and Reducers in Hadoop clusters. The datasets are uploaded to Hortonworks Data Platform (HDP) for analysis, using a tool SQOOP (hadoop echo system project). Sqoop is a tool designed to transfer data between Hadoop and relational database servers. It is used to import data from relational databases such as MySQL, Oracle to Hadoop HDFS, and export from Hadoop file system to relational databases.
Data pre-processing also allows transforming the data into a suitable format that can be used as input for a particular LA method. Several data pre-processing tasks, borrowed from the data mining field, can be used in this step. These include data cleaning, data integration, data transformation, data reduction, data modelling, user and session identification, and path completion. The datasets are managed and pre-processed by Apache Hive. Hive provides a warehouse structure and SQL like access for data in HDFS and other hadoop input sources. The data in required format is available in HDFS by the use of Sqoop. These data is cleaned and integrated by HiveQl language provided by Hive. Pre-processing is used to perform data operation to translate data into a fixed data format before providing data to algorithms or tools. The data analytics process will then be initiated with this formatted data as the input.
After data is available in the required format for data analytics algorithms, data analytics operations will be performed. The data analytics operations are performed for discovering meaningful information from data to take better decisions towards performance with data mining concepts. It may either use descriptive or predictive analytics for student’s performance evaluations. Analytics can be performed with various machine learning as well as custom algorithmic concepts, such as regression, classification, clustering, and model-based recommendation. For Big Data, the same algorithms can be translated to MapReduce algorithms for running them on Hadoop clusters by translating their data analytics logic to the MapReduce job which is to be run over Hadoop clusters. MapReduce is the processing framework for Apache Hadoop. MapReduce helps programming solve data parallel problems for which data set can be sub-divided into small parts and processed independently. The system splits
the input data into multiple chunks, each of which is assigned a map task that can process the data in parallel. Each map task reads the input as a set of (key, value) pairs and produces a transformed set of (key, value) pairs as the output. The framework shuffles and sorts outputs of the map tasks, sending the intermediate (key, value) pairs to reduce task, which groups them into final results.
Parallel K-Means Algorithm Based on MapReduce
The input dataset is stored on HDFS as a sequence file of <key, value> pairs, each of which represents a record in the dataset. The key is the offset in bytes of this record to the start point of the data file, and the value is a string of the content of this record. The dataset is split and globally broadcast to all mappers. Consequently, the distance computations are parallel executed. For each map task, PK-Means construct a global variant centers which is an array containing the information about centers of the clusters. Given the information, a mapper can compute the closest center point for each sample.
Algorithm MAp (key,value)
Input: Global variable centers, the offset key, the sample value
Output: <key’, value’> pair, where the key’ is the index of the closest center point and value’ is a string comprise of sample information
1. Construct the sample instance from value; 2. mindist = Double.maxvalue;
3 in
4. For i=0 to centers.length do dist=
ComputeDist(instance, centers[i]);
End Forr 6. Take index as key’;
7. Construct value’ as a string comprise of the values of different dimensions;
8. output < key, value> pair; 9. End
Algorithm REDUCE (key, V)
Input: key is the index of the cluster, V is the list of the partial sums from different host
Output: < key , value> pair, where the key’ is the
index of the cluster, value’ is a string representing
the new center
1. Initialize one array record the sum of value of each dimensions of the samples contained in the same cluster, e.g. the samples in the list V; 2. Initialize a counter NUM as 0 to record the
sum of sample number in the same cluster; 3. while(V.hasNext())
{
Construct the sample instance from
V.next();
Add the values of different dimensions of instance to the array
NUM += num;
}
4. Divide the entries of the array by NUM to get the new center’s coordinates;
6. Take key as key’;
7. Construct value’ as a string comprise of the center’s coordinates;
8. output < key, value> pair; 9. End
The final stage of the process consists of visualization of the results of data analytics. Visualization is an interactive way to represent the data insights. This can be done with various data visualization software’s like Gephi
etc. Gephi is an open-source network analysis and visualization software package written in Java on the NetBeans platform, initially developed by students of the University of Technology of Compiègne (UTC) in France.
The resulted output of parallel K-Means clustering algorithm in hadoop is in binary format. To understand the result in human readable format we need to convert the binary format into .txt or GraphML, for this we use Clusterdump tool in Mahout. Mahout is the datamining library of Apache Hadoop. The resulted output in GraphML can directly open in Gephi and it will result the statistical analysis. By using algorithms such as modularity, Fruchterman Reingold we can analyse the result and partition them into groups based on the result of clustering algorithm.
B. Prediction of student result
The prediction of students' result is crucial for educational institutions, because the quality of teaching process is the ability to meet students' needs. Analyzing the past performance of these students would provide a better perspective of the probable academic performance of students in the future. This can very well be achieved using the concept of
Predictive Analytics. Predictive analytics
encompasses a variety of statistical techniques from modelling, machine learning, and data mining that analyze current and historical facts to make predictions about future.
Steps for Prediction
Data Analysis phase is done in Hortonworks Sandbox. This phase includes data cleaning, data formatting, data subsetting etc. The Hortonworks Sandbox is a single node implementation of the Hortonworks Data Platform (HDP). In this phase only the appropriate variables for student’s performance evaluation are extracted from the input dataset using the Map Reduce paradigm. The hortonworks sandbox provides a component called Hive, which is used for extracting meaningful data from dataset. The Hive supports a query format, HiveQL which is same as that of SQL, but processing is done based on map reduce programming model.
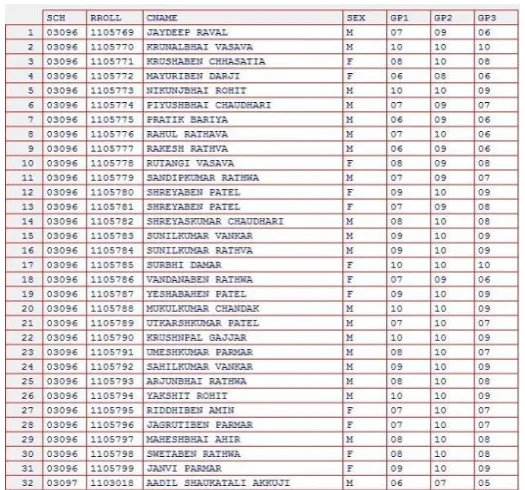
The figure 4 shows input training dataset, using which the predictive model is built. The training dataset contains information like school code (sch), roll number (rroll) of each student, name (cname, mname, fname), sex and marks for 4 tests (gp1, gp2, gp3, gp4). In this training dataset the variable gp4 is taken as dependent variable and gp1, gp2 and gp3 are taken as independent variables. Around 150000 student records are taken in training dataset.
Test Datas
Figure 5 shows the test dataset, a new dataset contains all the columns in training dataset except one column, i.e.; mark for one test (gp4) in training dataset. The gp4 for test dataset is predicted from the statistical relationship found in training dataset.
Figure 6 shows the final predicted result after applying test dataset in predictive model developed using training dataset.
EXISTING SYSTEM
The existing system presented an approach called Learning Analytics and Predictive analytics to identify academically at-risk students and to predict students learning outcomes in educational institutions. The predictive models will help the instructor to understand how well or how poorly the students in his/her class will perform and hence the instructor can choose proper pedagogical and instructional interventions to enhance student learning outcomes. It also helps instructors to predict about students success and failure in examination and also they can give proper advices to prevent failure in the examinations.
It is opted only for an approach that allows observations about the quality of resulting clustering configurations to be related directly to the property of hubness, instead of being a consequence of some other attribute of the clustering algorithm. Since it is expected of hubs to be located near the centers of compact subclusters in high-dimensional data, a natural way to test the feasibility of using them to approximate these centers is to compare the hub-based approach with some centroid-based technique. For this reason, the considered algorithms are made to resemble K-means, by being iterative approaches for defining clusters around separated high-hubness data elements.
The difficulties in dealing with high-dimensional data are omnipresent and abundant. However, not all phenomena that arise are necessarily detrimental to clustering techniques.
3.2 DRAWBACK OF THE EXISTING SYSTEM
Shared-neighbor clustering is not studied.
It is not automatically determine the number of clusters in the data.
The implicit assumption made by density-based algorithms is that clusters exist as high-density regions separated from each other by low-density regions.
In high-dimensional spaces this is often difficult to estimate, due to data being very sparse.
There is also the issue of choosing the proper neighborhood size, since both small and large values of k can cause problems for density-based approaches.
The hubs may not cluster well using conventional prototype-based clustering algorithms, since they not only tend to be close to points belonging to the same cluster
And also tend to be close to points assigned to other clusters (low inter-cluster distance).
Hubs can therefore, be viewed as (opposing) analogues of outliers, which have high inter- and intra-cluster distance, suggesting that hubs should also receive special attention.
PROPOSED SYSTEM
The proposed system is used to identify academically at risk students and to develop a predictive model to predict student academic performance in educational institutions, which helps to predict their future results.
Centroids and medoids in K-means iterations tend to converge to locations close to high-hubness points, which imply that using hubs instead of either of these could actually speed up the convergence of the algorithms, leading straight to the promising regions in the data space. Centroids depend on all current cluster elements, while hubs depend mostly on their neighboring elements and, therefore, carry localized centrality information.
The proposed system also carries out the Hub-Based Clustering process. In addition, Shared-neighbor clustering is also introduced. Also, automatic determination of the number of clusters in the data is also carried out.As an outcome, some data points, which we will refer to as hubs, are included in many more k-nearest- neighbor lists than other points. In the rest of the text, will refer to the number of k-occurrences of point x ε D as its hubness score. In addition, the degree of hubness does not depend on the embedding dimensionality, but rather on the intrinsic data dimensionality. ADVANTAGES OF THE PROPOSED SYSTEM
Shared-neighbor clustering is studied.
Automatic determination of the number of clusters is carried out.
The HPC algorithm defines a search through the data space based on hubness as a kind of a local centrality estimate.
K-hubs exhibited low stability, it converges to cluster configurations very quickly, in no more than four iterations on all the data sets
The proposed scheme, reduce the problem of graph clustering.
The variance of distances to the mean remains non-negligible for any finite number of dimensions which implies that some of the points still end up being closer to the data mean than other points.
Strengthening of correlation can be seen for an increasing number of neighbors k, indicating that larger values of k can be used to adjust to larger data set sizes.
To compute the exact volume of the neighborhood around a given point, for hubness, one only needs the distance matrix.
The proposed algorithms represent the possible approach to using hubness for improving high-dimensional data clustering.
CONCLUSION
In this paper we have presented a new approach called Learning Analytics and Predictive analytics to identify academically at-risk students and to predict students learning
outcomes in educational institutions. The predictive models will help the instructor to understand how well or how poorly performance at the end of the semester. This study will help to the students and the teachers to improve the division of the student. This study will also work to identify those students which needed special attention to reduce fail ration and taking appropriate action for the next semester examination.
REFERENCES
1. Alcala, J., Sanchaz, L., Garcia, S., Del Jesus, M.
ct. (2007). KEEL :A software tool to assess Evolutionary Algorithms to Data Mining problems. Soft compute 10.1007/s00500-008-0323y.
2. Clint McElroy,The Online Student Profile
Learning System: a Learner-Centered Approach to Learning Analytics, April 2011.
3. Dyckhoff, A. L., Zielke, D., Bültmann, M., Chatti,M. A., and Schroeder, U. 2012. Design and Implementation of a Learning Analytics Toolkit for Teachers. Educational Technology & Society 15, 3, 58.
4. George Lepouras, Akrivi Katifori, Costas
Vassilakis, Angeliki Antoniou, Nikos Platis, Towards a Learning Analytics Platform for Supporting the Educational Process.
5. M.A. Chatti, A.L. Dyckhoff, U. Schroeder, and H.Thüs, A Reference Model for Learning Analytics,
International Journal of Technology Enhanced
Learning(IJTEL) – Special Issue on ―State-of-the-Art in TEL‖
6. Ourania Petropoulou, Katerina Kasimatis,