Multilevel Thresholding based on Fuzzy C Partition
and Gravitational Search Algorithm
CHHAVIGUPTA1 SANJEEVJAIN2
Madhav Institute of Technology and Science Gwalior, India
1[email protected] 2[email protected]
Abstract. Entropy based image thresholding methods are widely adopted for multilevel image seg-mentation. Bilevel thresholding partitions an image into two classes, whereas multilevel thresholding partitions an image into multiple classes depending upon thresholding level . The automatic selection of optimal threshold is often treated as an optimization problem. This paper contributes to novel thresh-olding method, that is based on entropy of fuzzy c partition and gravitational search algorithm (GSA). Experiments have been evaluated on the different test images and results were assessed by entropy, sta-bility, computation time and peak signal to noise ratio (PSNR). The analysis of results conveys that the GSA outperform particle swarm optimization (PSO).
Keywords:Fuzzy c partition, Thresholding, Image segmentation, GSA, PSO.
(Received March 6th, 2014 / Accepted April 30th, 2014)
1 Introduction
Image segmentation is an important processing stage in image, video and computer vision application. It is an image analysis step in which input are images and out-put are features extracted from those images. It splits an image into significant regions or objects depending on the particular application. It basically distinguishes objects from the background on the basis of color, in-tensity value of pixels etc. Often, in numerous applica-tions the intensity value of the pixels belonging to the object are greatly different from pixels those belong to background. In such circumstances, thresholding act as a simple but effective tool for separating objects from the background. It is an important issue to search accu-rate threshold value that sepaaccu-rate different objects from background. Though, the automatic selection of opti-mal threshold has remained a challenge in image seg-mentation.
Many approaches that are recommended in the lit-erature for thresholding may be seen as: (i) Histogram
based methods, (ii) Entropy based methods, (iii) Clus-tering based methods, (iv) Higher order statistics based methods and (v) Local characteristics based methods [13]. Of specific interest is the concept of entropy that was introduced by Shannon in information theory. It was introduced into thresholding based segmentation by Pun [10], whose work was based on the principle of maximum entropy. Kapur et al. [8] worked on the shortcoming of Pun’s method and developed a method for selection of optimum threshold which maximizes the sum of the entropy of the segmented regions i.e. the object region and background region.
It is assumed that there exists some fuzziness and vagueness in images. So, fuzzy theory is applied to deal with this ambiguity and proves to be effective tech-nique. Fuzzy c partition is widely used approach to measure the amount of fuzziness in the images[2, 5, 14, 15].Cheng et al.[4], presented fuzzy homogeneity vectors to handle the grayness and spatial uncertainties among pixels to perform multilevel thresholding. In [5],
Cheng et al. used the concept of fuzzy c partition and the maximum entropy principle to select threshold val-ues for gray-level images. They used exhaustive ap-proach for bilevel thresholding for the searching of op-timal combination of fuzzy parameters while using sim-ulated annealing for the multilevel thresholding to re-duce computational complexity. In [6] a new approach for thresholding was presented that involve fuzzy par-titioning on two-dimensional histogram using the prin-ciple of entropy and genetic algorithm to determine the optimal thresholds. Zhao et al. [16] designed three-level thresholding method which is based on the cor-relation between the fuzzy c partition, the probability partition and maximum entropy theory. They utilized genetic algorithm to obtain the optimum fuzzy parame-ters. Tao et al. [15] presented three-level thresholding method using concept of fuzzy entropy through prob-ability analysis. The image is divided into three fuzzy regions determined by membership function. So, in or-der to find out the six parameters in those membership functions, they adopted genetic algorithm to estimate the optimal combination of the fuzzy parameters. Tao et al. [14] extended their work in fuzzy entropy and used the ant colony optimization (ACO) to obtain the opti-mal parameters and compared the results with the ex-isting methods. Assas & Benmahammed [2] performed the particle swarm optimization (PSO) in order to re-duce the time required to obtain thresholding value for multilevel thresholding.
In this paper, our prime goal is to determine a threshold and multiple thresholds for bilevel and mul-tilevel thresholds respectively for the image segmenta-tion. To obtain the accurate threshold values, it is neces-sary to obtain the optimal fuzzy parameters that define the fuzzy partition. But the computational complex-ity increases exponentially when fuzzy regions are cal-culated using fuzzy parameters through the exhaustive search. To remove above issues and for fast threshold-ing, metaheuristic optimization techniques have been applied to multilevel thresholding [1, 12]. Metaheuris-tic optimization provides a common framework for solving a problem. Various stochastic metaheuristic algorithms such as simulated annealing, genetic, ant colony optimization etc. have been applied to multi-level thresholding using fuzzy entropy [5, 14, 15].
To determine the optimal set of fuzzy parameters effectively, this paper utilizes the recently developed gravitational search algorithm (GSA). It is one of the recent heuristic optimization that was introduced by Rashedi et al.[11]. It is new stochastic optimization technique that uses the concept of physical phenom-ena i.e. law of gravity. The group of masses attracted
towards the large mass, which leads to optimum solu-tion. The feasibility of the proposed method is demon-strated on six different real images and compared with particle swarm optimization (PSO). The results show that the proposed method for thresholding can signif-icantly outperform on the basis of the solution qual-ity, stability and objective function. Multilevel thresh-olding provides much meaningful information as com-pared to bilevel thresholding. Thus, multilevel thresh-olding plays significant role in computer vision. Cur-rent literature does not address generalized multilevel thresholding for fuzzy entropy. This paper generalizes multilevel thresholding for the same.
The paper is organized as follows: Section 2 for-mulates the problem of multilevel thresholding. The overview of gravitational search algorithm (GSA) is de-scribed in Section 3. In Section 4, proposed approach using GSA is presented. The performance of proposed method is validated over wide range of images and re-sults are discussed in Section 5 . Finally, the conclusion is given in Section 6.
2 Problem formulation based on Fuzzy c par-tition
With concern towards optimal threshold selection in segmentation, the theory of fuzzy entropy proves to be influential and proficient one. Images are represented as fuzzy c partition that is determined by membership function.
Suppose L be the gray levels in an image and these gray levels are in the range 0, 1, 2... (L-1). The proba-bility of gray level i can be described by Eq.1
pi = h(i)
N (1)
where h(i) represents number of occurrence of each gray level i and N is total number of pixels in an im-age . The probability occurrence of a fuzzy set A is given by Eq.2 :
P(A) = L−1 X
i=0
µAcpi (2)
Our objective function is to maximize entropy of the fuzzy c partition which is obtained by Eq.3
H =−
c
X
j=1
P(A)jlogP(A)j (3)
2.1 Bilevel Thresholding
Bilevel thresholding classifies the pixels into two classes, one including those pixels with gray levels above a certain threshold and the other including the rest. For this purpose, we need a single threshold value. Consider two fuzzy setsA1andA2whose membership
function is given by Eq.45 [5]:
µA1(i) =
1 i≤a1
i−b1
a1−b1
a1< i≤b1
0 b1> i
(4)
µA2(i) =
0 i≤a1
i−a1
b1−a1
a1< i≤b1
1 b1> i
(5)
where i is gray level varies from 0 to L-1 anda1,
b1are the fuzzy parameters required to define the
mem-bership function. The value of threshold is obtained by taking midpoint of fuzzy parametersa1,b1.
2.2 Multilevel Thresholding
Multilevel thresholding partitions the pixels into several classes. The pixels belonging to the same class have gray levels within a specific range defined by multiple thresholds. Here, the membership function for c-level thresholding is presented. For fuzzy c partitions, mem-bership function is defined by Eq.678 :
µA1(i) =
1 i≤a1
i−b1
a1−b1
a1< i≤b1
0 b1> i
(6)
µAc−1(i) =
0 i≤ac−2
i−ac−2
bc−2−ac−2
ac−2< i≤bc−2
1 bc−2< i≤ac−1
i−bc−1
ac−1−bc−1
ac−1< i≤bc−1
0 bc−1> i
(7)
µAc(i) =
0 i≤ac−1
i−ac−1
bc−1−ac−1
ac−1< i≤bc−1
1 bc−1> i
(8)
where i varies from 0 to L-1 anda1,b1..ac−1,bc−1
are the fuzzy parameters which should follow the con-dition0 ≤a1 < b1 <, .., < ac−2 < bc−2 < ac−1 <
bc−1 ≤L−1 to calculate the c-1 threshold values to
partition image into c classes. Hence, fuzzy c partition can be determined by 2(c-1) fuzzy parameters. So, the problem becomes to determine the optimal combination of these fuzzy parameters such that the entropy of the image is maximized.
3 Overview of Gravitational search algorithm
Gravitational search algorithm (GSA) is designed by Rashedi et al. [11] . It is theoretical substitution of Newton’s two laws. First one is the gravitational law which states that every particle in the universe attract other particles with force that is directly proportional to product of their masses and inversely proportional to distance between them. Second one is Newton’s II law of motion which states that acceleration of an agent de-pends on its mass and total force applied on it. Attrac-tion exists between all the masses, but the weaker ones are well pulled by heavy mass. Heavy mass, here repre-sents efficient agent as it has better attraction capability which leads to better outcomes. Detailed description of the GSA is given below [11]:
Each agent has gravitational mass which is calcu-lated using fitness value is given by Eq.910
Mi(t) = mi(t)
PN
j=1mj(t)
(9)
mi(t) =
f iti(t)−worst(t)
best(t)−worst(t) (10)
wheref itiis fitness value of agent i and worst and best are the worst and best fitness value among all the agents. The position of each agent represents solution for problem domain which is defined by Eq.11:
XiD=D1, xD2, ..., xDN} (11)
where D is the dimension of the agent. The velocity and position of an agent for next iteration is calculated by Eq.12 and Eq.13 respectively.
viD(t+ 1) =riviD(t) +a D
i (t) (12)
xDi (t+ 1) =xDi (t) +viD(t+ 1) (13)
where r is random number which lies between [0-1]. The acceleration of the agent i by Newtons II law of motion is obtained by Eq.14
aDi (t) = FiD(t)
Mi(t) (14)
The total forceFiapplied on agent i by other agents is given by Eq.15
FiD(t) = N
X
j∈Kbest,j6=i
rjFijD(t) (15)
where N represents number of agents,rj is random number that lies between 0 to 1 and Kbest are those agents which are heavier. In the beginning all agents belong to Kbest but after each step, value of Kbest de-creases and at the end of the algorithm we will have only one agent that is the optimal solution to the prob-lem. Force exerted on massMiby massMjthat having distanceRij between them is obtained by Eq.16
FijD(t) =G(t)Mi(t)Mj(t) Rij(t) +ε (x
D i −x
D
j) (16)
where G(t) is gravitational constant. It is used to limit the search space and it is the function of time which is decreased after every iteration is given by Eq.17.
G(t) =G0(t)×(
t T)
β (17)
β <1and T is total number of iteration.
4 Proposed Approach
The problem is to segment an image by multilevel thresholding such that the entropy of the image is max-imized. We can rewrite objective function (entropy) which is to be maximized by Eq.18
H = c
X
j=1
( L−1 X
i=0
µAcpilog(
L−1 X
i=0
µAcpi)) (18)
For above objective function, constraint is defined in terms of fuzzy parameter. Fuzzy parameter aj, bj defines shape of fuzzy membership function, where j is defined as1< j ≤c. Fuzzy parameters should satisfy the following conditions:0 ≤a1 < b1 <, .., < ac−2 <
bc−2< ac−1< bc−1≤L−1.
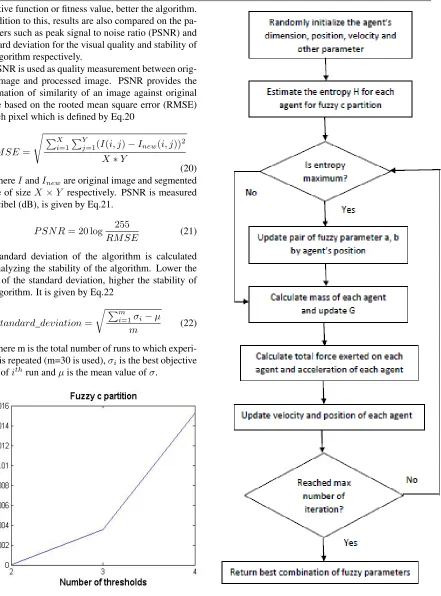
In the proposed approach, GSA is employed to de-termine the pairs of fuzzy parameters a, b that maximize the entropy of fuzzy c partition. The optimal threshold value is obtained by taking midpoint of these pair (aj, bj) [5]. The proposed algorithm using GSA is given as:
a) Take image as input and calculate the histogram of the image.
b) Compute the probability of occurrence of gray level P(i) for i = 0 to L-1 gray level.
c) Randomly initialize the initial values such as agent’s position, velocity, dimension i.e. the number of fuzzy parameters that depends on the threshold used for segmentation,G0=100,β= 0.2.
d) For each agent, calculate the fitness function i.e. en-tropy H for fuzzy c partition. If fitness function is better than previous then store the position of agents as the fuzzy parameters.
e) Calculate the mass M of each agent by Eq.9 and up-date the gravity G by Eq.17
f) Calculate the total force exerted on each agent by Eq.15 and acceleration by Eq.14
g) Update the velocity and position of an agent by Eq.12 and Eq.13 respectively.
h) Repeat steps from d) to g) till the algorithm reaches the point of fixed number of iteration or maximum entropy.
i) The required c-1 threshold values are calculated us-ing pair of fuzzy parameters (a1,b1) .. (ac−1,bc−1)
by Eq.19:
t1=
1
2(a1+b1), .., tc−1= 1
2(ac−1+bc−1) (19)
Flowchart of the proposed algorithm using GSA is presented in Figure 8.
5 Experimental Results
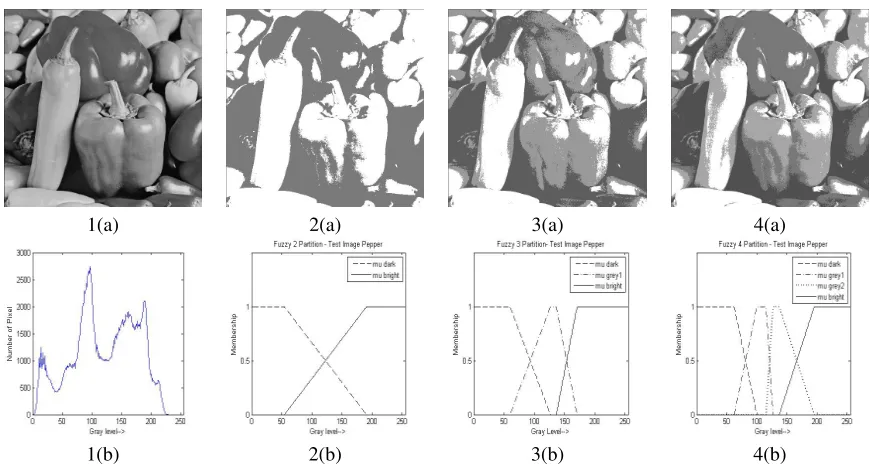
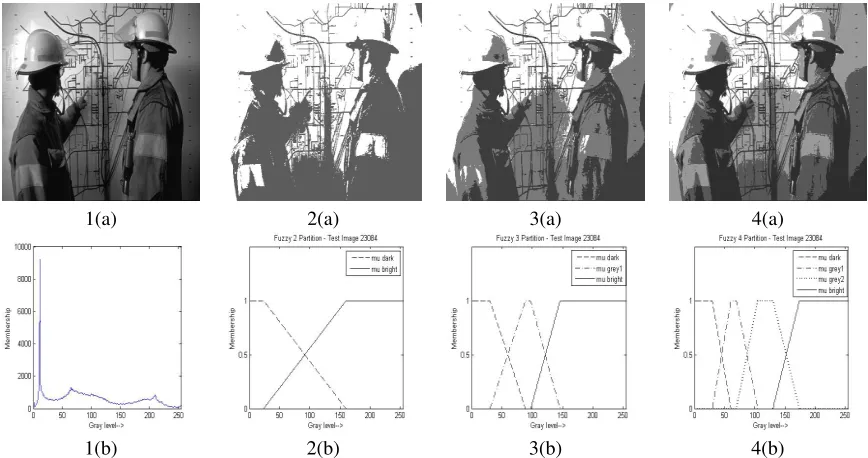
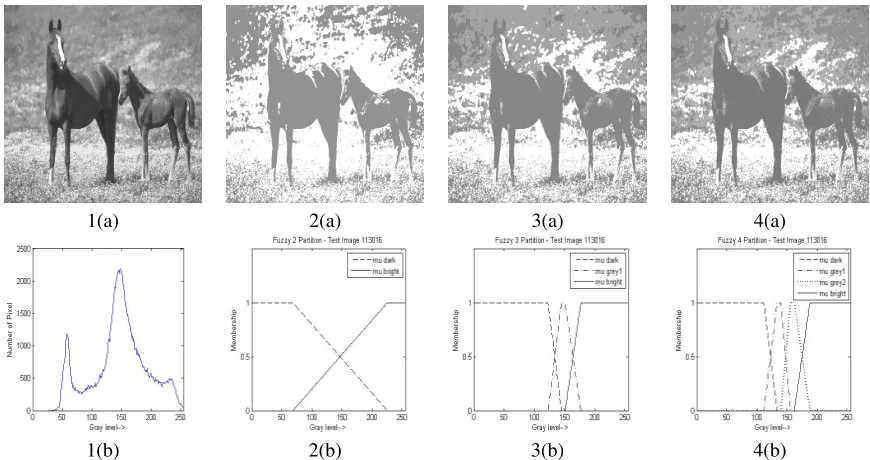
The experiments were carried on Intel core i5 platform with a 2.5 GHz processor and 4 GB memory running under the Windows 7 operating system. Matlab version 7 was used as simulation software. The performance of the proposed method has been tested on the 2 well known images lena, pepper and 4 other images 12003, 23084, 376001, 113016 from the Berkeley Segmenta-tion Dataset and Benchmark. Each image is presented with its histogram along with its segmented image using 2-level, 3-level, 4-level thresholding from Figures 1-6. In each figure from Figures 1-6 (1a) represent the his-togram of the original image (1b) represent the original image (2a) Bilevel segmented image (2b) Membership function of fuzzy 2 partition (3a) 3-level segmented im-age (3b) Membership function of fuzzy 3 partition (4a) 4-level segmented image (4b) Membership function of fuzzy 4 partition.
1(a) 2(a) 3(a) 4(a)
1(b) 2(b) 3(b) 4(b)
Figure 1:1(a) Original Image: Lena 1(b) Histogram 2(a) Segmented image using bilevel thresholding 2(b) Fuzzy 2 partition 3(a) Segmented using 3 level thresholding 3(b) Fuzzy 3 partition 4(a) Segmented image using 4 level thresholding 4(b) Fuzzy 4 partition
1(a) 2(a) 3(a) 4(a)
1(b) 2(b) 3(b) 4(b)
Figure 2:1(a) Original Image: Pepper 1(b) Histogram 2(a) Segmented image using bilevel thresholding 2(b) Fuzzy 2 partition 3(a) Segmented using 3 level thresholding 3(b) Fuzzy 3 partition 4(a) Segmented image using 4 level thresholding 4(b) Fuzzy 4 partition
1(a) 2(a) 3(a) 4(a)
1(b) 2(b) 3(b) 4(b)
Figure 3:1(a) Original Image: 12003 1(b) Histogram 2(a) Segmented image using bilevel thresholding 2(b) Fuzzy 2 partition 3(a) Segmented using 3 level thresholding 3(b) Fuzzy 3 partition 4(a) Segmented image using 4 level thresholding 4(b) Fuzzy 4 partition
1(a) 2(a) 3(a) 4(a)
1(b) 2(b) 3(b) 4(b)
figures/GSA_3girls_gray.jpg
1(a) 2(a) 3(a) 4(a)
1(b) 2(b) 3(b) 4(b)
Figure 5:1(a) Original Image: 376001 1(b) Histogram 2(a) Segmented image using bilevel thresholding 2(b) Fuzzy 2 partition 3(a) Segmented using 3 level thresholding 3(b) Fuzzy 3 partition 4(a) Segmented image using 4 level thresholding 4(b) Fuzzy 4 partition
1(a) 2(a) 3(a) 4(a)
1(b) 2(b) 3(b) 4(b)
Figure 6:1(a) Original Image: 113016 1(b) Histogram 2(a) Segmented image using bilevel thresholding 2(b) Fuzzy 2 partition 3(a) Segmented using 3 level thresholding 3(b) Fuzzy 3 partition 4(a) Segmented image using 4 level thresholding 4(b) Fuzzy 4 partition
objective function or fitness value, better the algorithm. In addition to this, results are also compared on the pa-rameters such as peak signal to noise ratio (PSNR) and standard deviation for the visual quality and stability of the algorithm respectively.
PSNR is used as quality measurement between orig-inal image and processed image. PSNR provides the information of similarity of an image against original image based on the rooted mean square error (RMSE) of each pixel which is defined by Eq.20
RM SE=
s PX
i=1 PY
j=1(I(i, j)−Inew(i, j)) 2
X∗Y
(20) whereIandIneware original image and segmented image of sizeX×Y respectively. PSNR is measured in decibel (dB), is given by Eq.21.
P SN R= 20 log 255
RM SE (21)
Standard deviation of the algorithm is calculated for analyzing the stability of the algorithm. Lower the value of the standard deviation, higher the stability of the algorithm. It is given by Eq.22
standard_deviation=
r Pm
i=1σi−µ
m (22)
where m is the total number of runs to which experi-ment is repeated (m=30 is used),σiis the best objective value ofithrun andµis the mean value ofσ.
Figure 7:Mean entropy gain for all images by the proposed method
Table 1:Objective function and optimal threshold based on fuzzy entropy criteria
Image Data Set c F uzzy Entropy Optimal T hreshold
P SO GSA P SO GSA
Lena 2 0.69314703 0.69314718 125 125
3 1.09830960 1.09861073 103,148 103,149 4 1.38117067 1.38628154 85,128,158 87, 129, 159
Pepper 2 0.69314697 0.69314718 122 122
3 1.09849702 1.09861065 93, 153 93,154 4 1.38496024 1.38628631 81, 120, 166 80, 121,166
12003 2 0.69314663 0.69314718 107 107
3 1.09807945 1.09861025 82,130 82,131 4 1.38354637 1.38628110 67, 106, 145 68, 106, 146
23084 2 0.69314690 0.69314718 91 92
3 1.09843110 1.09861152 60,121 60,122 4 1.38547345 1.38628863 45, 87, 151 45, 87, 152
376001 2 0.69314669 0.69314718 90 98
3 1.09847314 1.09861155 65 , 132 64, 132 4 1.38451488 1.38628943 45, 102 , 147 44, 102, 148
113016 2 0.69314669 0.69314718 147 147
3 1.09767187 1.09860868 134, 164 133,163 4 1.38405567 1.38627881 123, 148, 175 122, 148 , 175
Both the optimization techniques PSO and GSA were operated in their standard version. The size of population in PSO and in GSA algorithm was set to 20. For fair comparison, both algorithms were executed for the same number of iterations i.e. 50 to make the number of function evaluations same as that of the PSO algorithm. The number of thresholds calculated in this paper was 1-3.
GSA and PSO both are stochastic metaheuristic i.e. random in nature. So, the experiments were repeated to 30 runs for each value and for each fuzzy parti-tion. For PSO, other control parameters w_max =0.4, w_min=0.1, c1= c2=2 were used as defined in [12] and for GSA control parameters are defined in the Section 4. Table 1 provides the maximum fuzzy entropy evaluated for the entire test images and the value of the optimal thresholds corresponding to best fuzzy entropy by both the algorithms.
From the experiments, it has been examined that the GSA produces higher fuzzy c entropy than the re-sults obtained by the PSO for 2-4 level thresholding. In the experiment, fuzzy entropy is measured in eight digit floating point number as fuzzy entropy has less range as compared to other entropies. To investigate the stability of both of the optimization technique and visual qual-ity of segmented image, standard deviation and PSNR respectively are used and presented in Table 3 for test images.
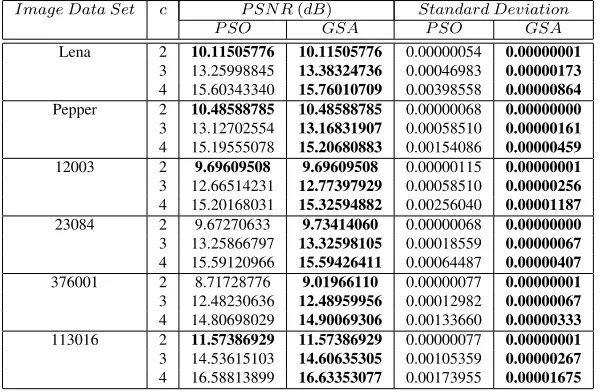
A higher value of PSNR indicates a better quality of thresholding. For all the test images, the proposed method proves to be better than PSO. Results of
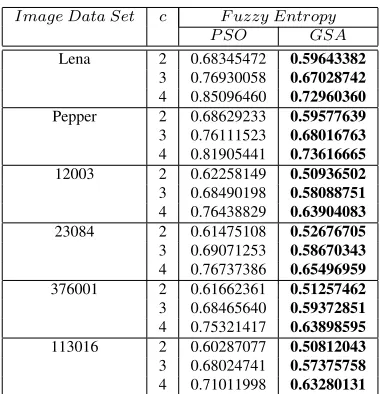
stan-dard deviation in Table 3 shows that GSA has better stability in comparison to PSO. The standard deviation of execution time for an image repeated for 30 runs is given in Table 3. Table 2 shows the computation time of proposed method and it has been observed that the com-putation time of GSA is less than the PSO algorithm.
Table 2:Comparison of computation time in sec
Image Data Set c F uzzy Entropy
P SO GSA
Lena 2 0.68345472 0.59643382
3 0.76930058 0.67028742
4 0.85096460 0.72960360
Pepper 2 0.68629233 0.59577639
3 0.76111523 0.68016763
4 0.81905441 0.73616665
12003 2 0.62258149 0.50936502
3 0.68490198 0.58088751
4 0.76438829 0.63904083
23084 2 0.61475108 0.52676705
3 0.69071253 0.58670343
4 0.76737386 0.65496959
376001 2 0.61662361 0.51257462
3 0.68465640 0.59372851
4 0.75321417 0.63898595
113016 2 0.60287077 0.50812043
3 0.68024741 0.57375758
4 0.71011998 0.63280131
Figure 7 yields the mean entropy gain by the pro-posed method for 2-4 level thresholding i.e. it repre-sents the difference between the mean entropy for all images at each level of thresholding. These results show that GSA outperforms for multilevel thresholding.
Table 3:PSNR and standard deviation of entropy that yields best result
Image Data Set c P SN R(dB) Standard Deviation
P SO GSA P SO GSA
Lena 2 10.11505776 10.11505776 0.00000054 0.00000001
3 13.25998845 13.38324736 0.00046983 0.00000173
4 15.60343340 15.76010709 0.00398558 0.00000864
Pepper 2 10.48588785 10.48588785 0.00000068 0.00000000
3 13.12702554 13.16831907 0.00058510 0.00000161
4 15.19555078 15.20680883 0.00154086 0.00000459
12003 2 9.69609508 9.69609508 0.00000115 0.00000001
3 12.66514231 12.77397929 0.00058510 0.00000256
4 15.20168031 15.32594882 0.00256040 0.00001187
23084 2 9.67270633 9.73414060 0.00000068 0.00000000
3 13.25866797 13.32598105 0.00018559 0.00000067
4 15.59120966 15.59426411 0.00064487 0.00000407
376001 2 8.71728776 9.01966110 0.00000077 0.00000001
3 12.48230636 12.48959956 0.00012982 0.00000067
4 14.80698029 14.90069306 0.00133660 0.00000333
113016 2 11.57386929 11.57386929 0.00000077 0.00000001
3 14.53615103 14.60635305 0.00105359 0.00000267
4 16.58813899 16.63353077 0.00173955 0.00001675
6 Conclusion
In this paper, a novel thresholding method based on fuzzy entropy using gravitational search algorithm has been proposed. The performance of the proposed method has been evaluated on the six test images and compared with particle swarm optimization on vari-ous parameters such as maximum entropy, standard deviation of entropy, PSNR. In proposed method en-tropy has been used as an objective function. We per-formed the experiment for bilevel and extended to mul-tilevel thresholding. The results obtained from test im-ages demonstrated that GSA performs better than PSO in terms of entropy, PSNR, stability and computation time. The experimental results show the effectiveness of GSA.
GSA has better characteristics in searching optimal fuzzy parameters to calculate threshold. The other ad-vantage of the GSA is that it uses few control parame-ters than PSO. In GSA, at every iteration, fitness eval-uation is carried out by best and worst fitness of popu-lation that yields better and efficient results. For future scope, 2D fuzzy entropy may also used in combination with multilevel thresholding for image segmentation.
References
[1] Akay, B. A study on particle swarm optimiza-tion and artificial bee colony algorithms for mul-tilevel thresholding. Applied Soft Computing, 13(6):3066–3091, June 2013.
[2] Assas, O. and Benmahammed, K. Fuzzy c-partition using particle swarm optimization algo-rithm. InIEEE,International Conference on Com-plex Systems, 2012.
[3] Bandyopadhyay, S. and Saha, S. Unsupervised classification : Similarity measures, classical and metaheuristic approaches and application, 2013.
[4] Cheng, H., Chen, C. H., Chiu, H. H., and Hui-juan, X. Fuzzy homogeneity approach to multi-level thresholding. IEEE Transcations on Image Processing, 7(7):1084–1086, July 1998.
[5] Cheng, H., Chen, J.-K., and Li, J. Threshold selec-tion based on fuzzy c partiselec-tion entropy approach.
Pattern Recognition, 31(7):857–870, July 1998.
[6] Cheng, H., Chen, Y. H., and Jiang, X. H. Thresh-olding using two dimensional histogram and fuzzy entropy principle. IEEE Transcations on Image Processing, 9(4):732–735, April 2000.
[7] Cheng, H., Chen, Y. H., and Sun, Y. A novel fuzzy entropy approach to image enhancement and thresholding. Signal Processing, 75(3):277– 301, June 1999.
[9] Kennedy, J. and Eberhart, R. Particle swarm op-timization. InIEEE,International Conference On Neural Networks, 1995.
[10] Pun, T. A new method for gray level picture thresholding using the entropy of the histogram.
Signal Processing, 2(3):223–237, July 1980.
[11] Rashedi, E., Nezamabadi-pour, H., and Saryazdi, S. Gsa: A gravitational search algorithm. Infor-mation Sciences, 179(13):2232–2248, June 2009.
[12] Sarkar, S. and Das, S. Multilevel image threshold-ing based on 2d histogram and maximum tsallis entropy - a differential evolution approach. IEEE Transcations on Image Processing, 22(12):4788– 4797, December 2013.
[13] Sezgin, M. and Sankur, B. Survey over image thresholding techniques and quantitative perfor-mance evaluation.Journal of Electronic Imaging), 13(1):146–165, January 2004.
[14] Tao, W., Jin, H., and Li, L. Object segmentation using ant colony optimization algorithm and fuzzy entropy. Pattern Recognition Letters, 28(7):788– 796, May 2007.
[15] Tao, W., Tian, J., and Liu, J. Image segmenta-tion by three-level thresholding based on maxi-mum fuzzy entropy and genetic algorithm. Pat-tern Recognition Letters, 24(16):3069–3078, De-cember 2003.
[16] Zhao, M., Fu, A., and Yan, H. A technique of three-level thresholding based on probability par-tition and fuzzy 3-parpar-tition.IEEE Transcations on Fuzzy Systems, 9(3):469–479, June 2001.