www.earth-surf-dynam.net/3/577/2015/ doi:10.5194/esurf-3-577-2015
© Author(s) 2015. CC Attribution 3.0 License.
Grain sorting in the morphological active layer of a
braided river physical model
P. Leduc, P. Ashmore, and J. T. Gardner
University of Western Ontario, Department of Geography, London, Ontario, Canada
Correspondence to: P. Leduc ([email protected])
Received: 8 June 2015 – Published in Earth Surf. Dynam. Discuss.: 10 July 2015 Revised: 22 October 2015 – Accepted: 23 November 2015 – Published: 15 December 2015
Abstract. A physical scale model of a gravel-bed braided river was used to measure vertical grain size sorting in the morphological active layer aggregated over the width of the river. This vertical sorting is important for ana-lyzing braided river sedimentology, for numerical modeling of braided river morphodynamics, and for measuring and predicting bedload transport rate. We define the morphological active layer as the bed material between the maximum and minimum bed elevations at a point over extended time periods sufficient for braiding processes to rework the river bed. The vertical extent of the active layer was measured using 40 hourly high-resolution DEMs (digital elevation models) of the model river bed. An image texture algorithm was used to map bed material grain size of each DEM. Analysis of the 40 DEMs and texture maps provides data on the geometry of the morpho-logical active layer and variation in grain size in three dimensions. By normalizing active layer thickness and dividing into 10 sublayers, we show that all grain sizes occur with almost equal frequency in all sublayers. Oc-currence of patches and strings of coarser (or finer) material relates to preservation of particular morpho-textural features within the active layer. For numerical modeling and bedload prediction, a morphological active layer that is fully mixed with respect to grain size is a reliable approximation.
1 Introduction
Information about the distribution of grain sizes within a vol-ume of an alluvial gravel river bed is sought for a variety of reasons. The focus here is the relationship between grain size sorting in the river bed and bed material transport rates, which is central to explaining, modeling and predicting the morphological development of a river. The goal of the anal-ysis described in this paper is to characterize the grain size sorting of the morphological active layer aggregated over an area of the full width of a gravel-bed braided river in a non-aggrading or degrading state.
Gravel braided rivers have intricate patterns of size sort-ing driven by complex flow structures at confluences and in shallow (typically the mean depth/D90in anabranches is 10
or less) flows associated with bifurcations and sorting in low sinuosity bends and point bars as well as in migrating bed-load sheets and low-amplitude bars (Bluck, 1979; Ashworth et al., 1992). The amplitude of topography, and therefore the turnover depth for gravel, related to these local erosional and
depositional features is commonly up to 20 timesD50
(Gard-ner and Ashmore, 2011; Wheaton et al., 2013). The surface and near-surface sorting of grain sizes associated with the active morphological processes of braided rivers results in patterns of grain size related to local bed elevation and flow structure. These patterns are preserved within the river posits as the anabranches migrate and rework previously de-posited material. Surface patchiness has been observed in flume experiments in response to input sediment flux vari-ations or topography control. The importance of this patchi-ness has previously been considered mainly in relation to the bed surface characteristics and the effect on local roughness and bed material load (Nelson et al., 2009, 2010).
lay-ers and aggregated at the scale of the braided channel. The answer to this question is important for understanding the morphodynamic and sedimentary processes of braided rivers and the methods for representing these processes in com-putational models (Viparelli et al., 2010; Sun et al., 2015). Understanding the sedimentology of the morphological ac-tive layer is also important for calculation of bedload trans-port rates using morphological methods from direct river sur-vey (Wheaton et al., 2013) that integrate transport rates over morphologically significant events and extent (Ashmore and Church, 1998). Refining morphological transport estimates may require information on grain sizes encountered at differ-ent depths below the bed or confirmation (or modification) of the simple assumption that, during channel-forming pro-cesses, all grain sizes of the bulk grain size distribution are available with equal probability.
Data on three-dimensional patterns of sorting within the bed are difficult to acquire, especially for an entire volume of the bed in a river reach. In sedimentological analyses, de-scriptions of braided river gravels have tended to emphasize the sedimentary structure and sedimentological detail with little direct analysis of grain size sorting except for limited vertical sections, trenches or cores using direct physical grain measurement or indirect grain size methods such as image-based automatic sizing (Storz-Peretz and Laronne, 2013a). Analyses have typically focused on facies patterns and sed-imentary structure, but several have mentioned that there is little vertical trend in grain sizes in braided river gravels (e.g., Bluck, 1979; Sambrook Smith, 2000; Heinz et al., 2003; Lunt and Bridge, 2004; Guerit et al., 2014; Marren, 2005; Storz-Peretz and Laronne, 2013b). Similarly, physical models of aggraded braided gravel alluvium show patches and threads of distinct facies but no clear trend in grain size (e.g., More-ton et al., 2002). However, these generalities, while useful indications, are based on limited sampling and quantification of trends in particle size sorting.
Analyses of the statistics of vertical tracer particle ex-change for different size fractions have been used in develop-ing observations and theories of particle kinetics for bedload prediction based on long-term mixing and burial/exhumation within the particle exchange layer (Haschenburger, 2011). This relates partly to the development of bed surface armor and the size of material available for transport at different phases of particle mobility. These analyses are usually re-stricted to the bedload exchange layer, which is generally taken to extend to about 2×D90 beneath the river bed
(al-though deeper exchange is possible; Haschenburger, 2011) and is also observationally restricted by the methods for lo-cating tracer particles beneath the bed. These analyses pro-vide information for particle exchange and bedload theory for vertically stable beds with limited topographic amplitude. In braided rivers, bed topography can change rapidly during normal channel-forming events due to local bed scour, de-position and channel avulsion so that exchange depths are likely to extend through the entire range of bed elevation (of
the order of 10×D90) rather than the relatively thin grain
exchange layer of more stable river beds. This is a primary reason to define a morphological active layer that is distinct from the grain exchange active layer related to flood events on a stable gravel bed with limited topographic amplitude.
The grain size characteristics of the morphological ac-tive layer are needed for implementing numerical models of braided river morphodynamics. Prior studies of gravel bed stratigraphy under aggradation/degradation have used plane beds in narrow flumes, rather than fully developed river mod-els (Viparelli et al., 2010). In the plane bed case, with no lat-eral or other morphological sorting, the surface layers of the bed tend to be coarser than the lower layers (Viparelli et al., 2010). The variety of sorting mechanisms at work in later-ally unstable rivers with substantial depths of scour and de-position associated with, for example, confluences and braid bars may modify this trend (Leduc, 2013). New numerical model results have begun to yield predictions of local grain size sorting in braided channels (Sun et al., 2015), and phys-ical experiments in small-scale models will be valuable in developing and testing these numerical models.
2 Flume procedure and data collection
The experiment described here previously formed the basis for an analysis of the topography, grain size and formation of the basal surface of braided river deposits (Gardner and Ash-more, 2011). Here we expand the analysis to focus on grain size characteristics within the entire vertical extent of DEM data and based on refinement of the topographic and textural data, extraction of complete grain size maps, and extension of the time period analyzed from 20 to 40 h of model running time.
2.1 Flume procedure
The data are taken from a single experiment using a Froude-scale physical model of a gravel-bed braided river in a flume 18 m long, 3 m wide and 0.3 m deep. The grain size distri-bution was scaled at 1/30 from measurements of the gravel (truncated at 8 mm in the field) particle size distribution of a pro-glacial braided reach of Sunwapta River in the Canadian Rocky Mountains. Consequently, bed material in the model was composed of sand with sieve sizes ranging from 0.3 to 8 mm and a median size of about 1.3 mm. The geometric sort-ing defined byσ=d84−d16
4 +
d95−d5
6.6 is equal to 1.3, withdX
being thexth percentile of the distribution. This grain size distribution was designed to model the morphology and as-sociated grain sorting mechanisms and patterns of the gravel fraction of the sediments. The water discharge was main-tained constant at 2.1 L s−1 throughout the experiment and the bed slope was set at 1.5 %. These values maintain 1/30 Froude scaling of the Sunwapta River based on known high-flow discharges, the bed material grain size distribution and the surveyed gradient of the river (Chew and Ashmore, 2001; Ashmore et al., 2011). The sediment system was closed to simulate long-term equilibrium conditions; a sediment pump transferred the output material to the upstream end of the flume, where it was returned continuously to the model river using a feed chute that allowed excess water to drain away. The 40 h period analyzed in this paper began at hour 140 of the experiment. Consequently, the flume bed was fully braided at the time of the initial DEM, some bed features were inherited from earlier in the experiment, and the braided pattern was maintained throughout the experiment.
2.2 Bed topography
Vertical stereo images of the dry bed were taken at 1 h in-tervals and DEMs were derived photogrammetrically (us-ing Leica Photogrammetry Suite software v. 9.1) with a mean elevation error of ν= −0.02 mm, standard deviation ofσ =0.78 mm and a cell size of 3 mm (Gardner and Ash-more, 2011). We consider an absolute error on height of 3σ=2.3 mm, which corresponds to a confidence interval of 99.7 % for a normal distribution. The DEM extent in this analysis was 10 m long and 2.5 m wide to remove
pho-togrammetric artifacts apparent near the edges and ends of the raw DEMs while covering the full braided river width. The final size on the DEM is 3334×868 cells. The flow in-crease and dein-crease lasted only a few minutes, and changes induced during that period are considered as negligible at the experiment scale.
2.3 Grain size analysis
The grain size analysis and mapping used the image texture method developed and tested by Carbonneau (2005) and Car-bonneau et al. (2005) for field mapping of gravel-bed rivers but adapted for the sand texture in the physical model. The image texture calculation was made using the co-occurrence gray matrix level based on 64 gray level vertical bed im-ages. The sampling window size of 7×7 pixels was chosen due to the median grain size (1.3 mm) and the camera res-olution, and the best fit of the data was found using the en-tropy index. The enen-tropy measures the quantity of common pattern on a picture. To calibrate the predictive relationship between an entropy value and the real grain size, two sets of measurements were used. Surface patches on the model river bed were sampled using adhesive and grain size was measured using physical sieving. The first set of 58 samples corresponded to patches with uniform grain size covering the range of sizes in the distribution (Gardner and Ashmore, 2011). This first set of 58 was extended with an additional 125 samples spread over an image area regardless of the sur-face composition and covering the full range of grain sizes and gradations. The 183 grain samples were split randomly into two sets: the first set was used to calibrate the linear relationship between sampled grain size and texture value (Fig. 1a) and the second set was used to validate the rela-tionship and estimate the measurement error (Fig. 1b). With the validation set, we find that the mean value of the absolute error is 0.38 mm with a standard deviation of 0.61 mm. The relative error on the absolute value ranges from 0 to 100 % and half of the set had error less than 20 %.
We refer to the estimated grain size from the textural cal-ibration as the “equivalent texture” because it is a texture value calibrated to only the median grain size (not the full distribution) for a patch and is not strictly a grain size value as conventionally defined in physical measurements of grain size.
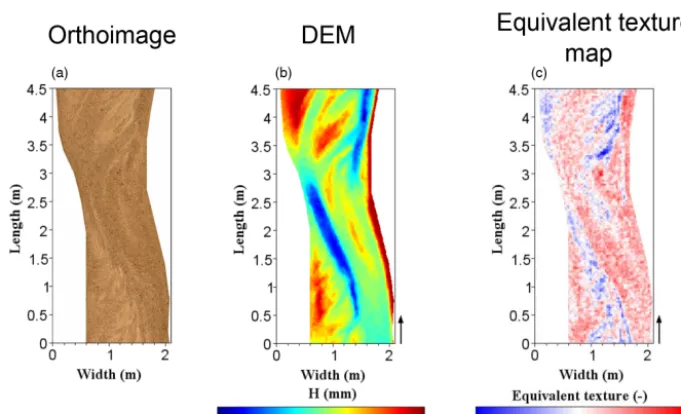
A grain size map is associated with each DEM, and for every bed location the bed elevation and local bed texture is known (Fig. 2).
2.4 Dimensionless bed depth
(a) (b)
Figure 1.Calibration (a) and validation (b) data set for the predictive relationship between the surface grain size and the picture texture (entropy). A simple linear equation is used. The error estimation on the validation data set is 0.38 mm on the absolute mean value and 0.61 mm for standard deviation of the absolute value.
Figure 2.Summary of data acquisition. (a) Orthoimage: vertical pictures are taken at 1 h interval (note patterns of sorting of fine and coarse material). (b) DEM: the topography is derived photogrammetrically, the cell size is 3 mm, and the flume slope is removed. (c) Equivalent texture map: the map is derived from the texture calculation of vertical pictures, and the median grain size error is less than 20 %.
the 40 h (Gardner and Ashmore, 2011). The difference be-tween these two surfaces over the areal extent of the data is the morphological active layer (Fig. 3). The morphologi-cal active layer differs from deposit thickness because it is a virtual layer developed over time with virtual vertical extent larger than the deposits at any time. Moreover, the deposit thickness is time-related and changes with successive topog-raphy, whereas for a certain time interval the morphological active layer is constant. The morphological active layer is also different from the active layer involved in particle ex-change during bedload transport because it extends over a depth related to overall scour and deposition of the river bed over the time-scale of reworking of the bed by braiding pro-cesses, rather than the near-surface particle exchange on a vertically stable bed during single bed-mobilizing events.
Although the river reworked the whole flume width during the experiment, some areas of the river bed were not active
during the 40 h. Those areas corresponded mainly to the tops of stable braid bars developed in earlier stages of the experi-ment. We define the areas that showed no measurable change by setting a uniform threshold of 4.6 mm according to the precision of the DEM. These “no-change” areas have been removed from DEMs and grain size maps so as to retain only the active part of the braided pattern in the analysis.
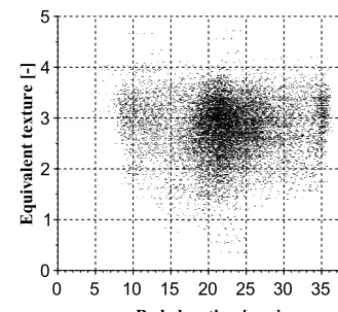
In a single set of DEM/equivalent texture maps, there is no clear link between the surface grain size and the bed el-evation (Fig. 4). The longitudinal bed slope or the local bed topography might induce a complex relation even on a single set of bed elevation and local features (bar vs. channel). Yet, to study the grain sorting in the morphological active layer, the layer should be scaled relative to the absolute elevation to remove residual local topographic effects.
Figure 3. The minimum surface, the maximum surface and the morphological active layer. The minimum surface (a) is defined at the lowest elevation for each location throughout 40 h. The maxi-mum surface (b) is the highest elevation for each location through-out 40 h. The morphological active layer (c) is the difference be-tween the maximum surface (b) and the minimum surface (a). Whites parts are the no-change areas. The arrow indicates flow di-rection, and the flume slope is removed.
the dimensionless bed elevation, H(x, y) the bed elevation in meters,Hmin(x, y) the minimum elevation in meters, and
1h(x, y) the morphological active layer thickness in meters. Dimensionless bed value ranges from 0 to 1.
h(x, y)=H(x, y)−Hmin(x, y)
1h(x, y) (1) The normalization allows analysis of grain size changes in relation to the active layer thickness and local position within the vertical extent of the active layer.
3 Analysis and results
3.1 Natural and modeled surface grain sorting
During the period of analysis, a large proportion of the bed area was reworked by processes typical of braided rivers, i.e., channel avulsions, bar migration, bedload transport, con-fluence and bifurcation evolution, and active and non-active anabranches (e.g., Egozi and Ashmore, 2009).
Natural grain sorting is observed over the entire bed sur-face; fine and coarse sediments are organized in relation to local topography, flow bifurcation, bed roughness or flow constriction, which lead to a complex pattern of different sur-face grain size (e.g., Carson and Griffiths, 1987). Figure 5 shows a bar located at the downstream end of a confluence from a field site (Fig. 5a) and on the 1/30 downscaled flume model (Fig. 5b). In both pictures, small uniform fine grain
Figure 4.Example of equivalent texture as a function of bed ele-vation for a part of a single DEM: there is no clear trend between the equivalent texture and the local elevation for one set of measure-ments.
units are observed on the bar surface, with a longitudinal shape in bar length direction. The longitudinal shape of bars on the edge define a developed sorting pattern, as also de-scribed in Nelson et al. (2010). The braided channel in the flume also showed complex and diverse grain sorting pat-terns of the kind seen in full-scale braided rivers, including lateral sorting at confluences, coarse deposits on bar heads at bifurcations, fine-grained lateral bars on the downstream margins of braid bars, and lateral fining in bends and on bars (see also Moreton et al., 2002; Gardner and Ashmore, 2011).
3.2 Bed layer construction
From the normalized bed topography, 10 classes of dimen-sionless bed depth (Eq. 1 and Fig. 6a and b) are considered:
]0,0.1], ]0.1,0.2] ...]0.9,1[. Values 0 and 1, which corre-spond respectively to the minimum surface and the maxi-mum surface, are not included in the sublayer division to avoid imbalance in the amount of data within each layer – the maximum and the minimum values always exist for each cell, whereas the intermediate values do not necessarily.
Figure 5.Grain sorting and natural pattern. (a) Vertical view of the Sunwapta River in the Canadian Rockies and (b) on the 1/30 model. Flow is from left to right in both bar pictures. Fine sediments are lighter gray than coarse sediments.
40 DEMs (m), 1 hour apart
40 normalized bed topographies (-), 1 hour apart
Dimensionless equation, eq. 1
40 normalized bed topographies (-), 1 hour apart.
Depth sorted within 10 depth layers
40 *10 equivalent texture maps. At each time and depth step
Depth sorting
For each normalized bed topography and each depth layer, the equivalent texture value is associated with the cell
10 equivalent texture map, at each depth step
For each depth, median value of the 40 equivalent texture maps (a)
(b)
(c)
(d)
(e)
Figure 6.Construction of the texture maps: (a) the bed topogra-phy derived from the photogrammetry process, (b) the normalized bed topography using Eq. (1), (c) normalized bed topography sorted in 10 layers (the minimum and maximum surface are not included in the layers), (d) 400 equivalent texture maps, and (e) 10 median equivalent texture maps for each normalized bed depth.
3.3 Equivalent texture distribution
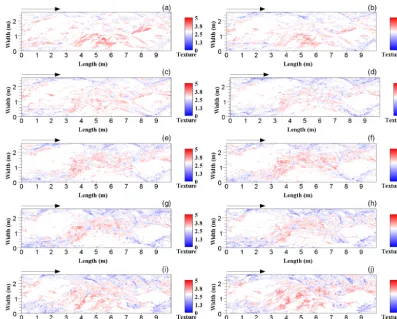
The equivalent textures of the different layers all cover the same range of values. Within the morphological active layer each equivalent texture can be found in every layer, every layer has the full range of equivalent texture values, and the proportion of equivalent textures is almost identical for all layers (Fig. 9).
The shift of the equivalent texture distribution for the first two layers just above the minimum surface indicates that the average equivalent texture is slightly coarser for layers near the minimum surface (Fig. 9). The total number of data points is small compared to other layers due to the slight lo-cal aggradation in part of the flume during the experiment.
Figure 7.The bed elevation is normalized by the morphological active layer thickness. On initial topography (a), local topographic gradients affect local elevation of features. On normalized topog-raphy (b), equivalent features all have elevation shown by the same range of color over the model extent; for example, channels are blue and high bar tops dark red. The flume slope is removed.
Nevertheless, among those points, this small coarse shift re-flects the increased presence of coarse patches in the lower parts of the morphological active layer.
Figure 8.Equivalent texture maps: layer 1 (a), layer 2 (b), layer 3 (c), layer 4 (d), layer 5 (e), layer 6 (f), layer 7 (g), layer 8 (h), layer 9 (i), and layer 10 (j). The white part of the color scale is centered around the median value (2.7) of the distribution combined.
Figure 9.Equivalent texture histogram. The dashed lines represent the lower layers: layers 1 and 2. The shift of the equivalent distribu-tion of those two layers indicates that the median equivalent texture is slightly higher close to the minimum surface.
confluences. Confluences were identified manually (Gardner, 2009), and the map (Fig. 10) shows time-integrated conflu-ence positions. The majority of coarse patches are located on the confluence area or in the downstream channel. These coarse patches may correspond to “fixed” grain patches be-cause of their location close to confluences (Nelson et al., 2009, 2010). Further analysis of these and other features is needed to understand the relationship between texture and
Figure 10.Confluence and coarse patches map. Black lines are the boundaries of confluence areas over 40 h. Gray dots are coarse patches.
channel morphology at the reach scale to explain details of size sorting within the morphological active layer.
4 Discussion
observations suggesting very little general vertical sorting trends within gravelly braided alluvium (Lunt and Bridge, 2004; Guerit et al., 2014). In morphological approaches to computing bedload transport in braided rivers (Ashmore and Church, 1998) it is implicit that transport involves the en-tire morphological active layer. From our results a good first-order approximation of grain sizes available for transport is that all grain sizes are equally available at all elevations in the morphological active layer over relevant morphodynamic timescales.
Therefore, available sediments at any location and time match the bulk size distribution of the morphological active layer. This also provides both an initial basis for numerical modeling of bedload transport in braided rivers with mixed sediment sizes (e.g., Sun et al., 2015) and a means for mu-tual testing of grain size sorting in physical and numerical models, for which limited and strategic field sampling could provide validation.
5 Conclusions
A physical model of a gravel braided river provided data on the range of elevation values from a sequence of photogram-metric DEMs covering 40 h of model time. From these data the vertical extent of the morphological active layer of the river can be defined at any location. Textural analysis of the photogrammetric images yields equivalent texture (median grain size) at any location on each DEM and therefore a com-plete three-dimensional picture of grain size variation in the morphological active layer during active development of the braided river. Analysis of the bed elevation layers normal-ized by active layer depth shows that the morphological ac-tive layer is approximately homogeneously mixed except for some slightly higher proportions of coarse texture in the low-ermost layers. Further analysis of the distributions is needed to understand how this mixing develops in relation to bed scour and deposition in braided rivers. The result provides an initial approximation of grain size variation for numerical modeling of morphodynamics of braided rivers with mixed size sediment incorporating local size sorting and tracking the grain sizes at any location within the morphological ac-tive layer.
Acknowledgements. This research was supported by a Natural Sciences and Engineering Research Council of Canada award to P. Ashmore. The Canada Foundation for Innovation and Newalta Resources Inc. funded the flume construction. We thank Jim Chandler and Rene Wackrow for their support in applying the photogrammetric methods. Several people assisted with the experiments, especially Roey Egozi and Beth Hundey.
Edited by: D. Parsons
References
Ashmore, P. and Church, M.: Sediment transport and river morphol-ogy: a paradigm for study, Water Resources Publications LLC, Highlands Ranch, Colorado, 115–148, 1998.
Ashmore, P., Bertoldi, W., and Gardner, T. J.: Active width of gravel-bed braided rivers, Earth Surface Processes and Land-forms, 36, 1510–1521, 2011.
Ashworth, P., Ferguson, R., and Powell, D.: Bedload transport and sorting in braided channels, 497–518, 1992.
Bluck, B.: Structure of coarse grained braided stream alluvium, Transactions of the Royal Society of Edinburgh, 70, 181–221, 1979.
Carbonneau, P. E.: The threshold effect of image resolution on image-based automated grain size mapping in fluvial environ-ments, Earth Surface Processes and Landforms, 30, 1687–1693, 2005.
Carbonneau, P. E., Bergeron, N., and Lane, S. N.: Automated grain size measurements from airborne remote sensing for long pro-file measurements of fluvial grain sizes, Water Resour. Res., 41, doi:10.1029/2005WR003994, w11426, 2005.
Carson, M. A. and Griffiths, G. A.: Bedload Transport in Gravel Channels, New Zealand Hydrological Society, J. Hydrol., 26, 1– 151, 1987.
Chew, L. and Ashmore, P. E.: Channel adjustment and a test of ra-tional regime theory in a proglacial braided stream, Geomorphol-ogy, 37, 43–63, 2001.
Egozi, R. and Ashmore, P.: Experimental analysis of braided chan-nel pattern response to increased discharge, J. Geophys. Res.-Earth, 114, doi:10.1029/2008JF001099, f02012, 2009.
Gardner, J.: Morpho-dynamics and sedimentology of confluences in gravelly braided rivers, PhD thesis, University of Western On-tario, London, Canada, 235 pp., 2009.
Gardner, J. and Ashmore, P.: Geometry and grain-size characteris-tics of the basal surface of a braided river deposit, Geology, 39, 247–250, 2011.
Guerit, L., Barrier, L., Narteau, C., Métivier, F., Liu, Y., Lajeunesse, E., Gayer, E., Meunier, P., Malverti, L., and Ye, B.: The Grain-size Patchiness of Braided Gravel-Bed Streams – example of the Urumqi River (northeast Tian Shan, China), Adv. Geosci., 37, 27–39, doi:10.5194/adgeo-37-27-2014, 2014.
Haschenburger, J. K.: Vertical mixing of gravel over a long flood series, Earth Surf. Proc. Land., 36, 1044–1058, 2011.
Heinz, J., Kleineidam, S., Teutsch, G., and Aigner, T.: Hetero-geneity patterns of Quaternary glaciofluvial gravel bodies (SW-Germany): application to hydrogeology, Sediment. Geol., 158, 1–23, 2003.
Leduc, P.: Etude expérimentale de la dynamique sédimentaire des rivières en tresses, PhD thesis, Université de Grenoble,Grenoble, France, 236 pp., 2013.
Lunt, I. and Bridge, J.: Evolution and deposits of a gravelly braid bar, Sagavanirktok River, Alaska, Sedimentology, 51, 415–432, 2004.
Marren, P. M.: Magnitude and frequency in proglacial rivers: a geomorphological and sedimentological perspective, Earth-Sci. Rev., 70, 203–251, 2005.
Nelson, P. A., Venditti, J. G., Dietrich, W. E., Kirchner, J. W., Ikeda, H., Iseya, F., and Sklar, L. S.: Response of bed surface patchiness to reductions in sediment supply, J. Geophys. Res.-Earth, 114, F02005, doi:10.1029/2008JF001144, 2009.
Nelson, P. A., Dietrich, W. E., and Venditti, J. G.: Bed topography and the development of forced bed surface patches, J. Geophys. Res.-Earth, 115, F04024, doi:10.1029/2010JF001747, 2010. Sambrook Smith, G.: Small-scale cyclicity in alpine proglacial
flu-vial sedimentation, Sediment. Geol., 132, 217–231, 2000. Storz-Peretz, Y. and Laronne, J. B.: Automatic grain sizing of
verti-cal exposures of gravelly deposits, Sediment. Geol., 294, 13–26, 2013a.
Storz-Peretz, Y. and Laronne, J. B.: Morphotextural characteriza-tion of dryland braided channels, Geol. Soc. Am. Bull., 125, 1599–1617, 2013b.
Sun, J., Lin, B., and Yang, H.: Development and application of a braided river model with non-uniform sediment transport, Adv. Water Resour., 81, 62–74, doi:10.1016/j.advwatres.2014.12.012, 2015.
Van De Lageweg, W., Van Dijk, W., and Kleinhans, M.: Morpho-logical and stratigraphical signature of floods in a braided gravel-bed river revealed from flume experiments, J. Sediment. Res., 83, 1032–1045, 2013.
Viparelli, E., Haydel, R., Salvaro, M., Wilcock, P. R., and Parker, G.: River morphodynamics with creation/consumption of grain size stratigraphy 1: laboratory experiments, J. Hydraul. Res., 48, 715–726, 2010.