EEA algorithm model in estimating spread and
evaluating countermeasures on high performance
computing
Si-Yuan Liu1,3, Chao Liu2, Yu Liu4, Yi-Ming Luo3, Gao-Jin Wen1, Jian-Ping Fan1
1Shenzhen Institute of Advanced Technology, Chinese Academy of Sciences, Shenzhen, China. 2Institute of Computing Technology, Chinese Academy of Sci-ences, Beijing, China. 3Hong Kong University of Science and Technology, Hong Kong, China. 4Royal Institute of Technology, Stockholm, Sweden. Correspon-dence should be addressed to Si-Yuan Liu ([email protected]).
Received March 12th, 2008; revised December 7th, 2008; accepted December 29th, 2008
ABSTRACT
This work started out with the in-depth feasibil-ity study and limitation analysis on the current disease spread estimating and countermea-sures evaluating models, then we identify that the population variability is a crucial impact which has been always ignored or less empha-sized. Taking HIV/AIDS as the application and validation background, we propose a novel al-gorithm model system, EEA model system, a new way to estimate the spread situation, evaluate different countermeasures and analyze the development of ARV-resistant disease strains. The model is a series of solvable ordi-nary differential equation (ODE) models to es-timate the spread of HIV/AIDS infections, which not only require only one year’s data to deduce the situation in any year, but also apply the piecewise constant method to employ multi- year information at the same time. We simulate the effects of therapy and vaccine, then evaluate the difference between them, and offer the smallest proportion of the vaccination in the population to defeat HIV/AIDS, especially the advantage of using the vaccination while the deficiency of using therapy separately. Then we analyze the development of ARV-resistant dis-ease strains by the piecewise constant method. Last but not least, high performance computing (HPC) platform is applied to simulate the situa-tion with variable large scale areas divided by grids, and especially the acceleration rate will come to around 4 to 5.5.
Keywords: EEA, ODE, HIV/AIDS, Spread Esti-mating, Countermeasure Evaluation, High Per-formance Computing
1. INTRODUCTION
There is an ancient Arabic saying, those who predict the future, lie, even if they think they are telling the truth.
This saying succinctly sums up the great uncertainty in projecting the future, especially for a complex problem such as HIV/AIDS spread estimation issues. As the HIV/ AIDS pandemic enters its 27th year, both the number of infections and number of deaths due to the HIV/AIDS continue to leap. Even though an enormous amount of effort, our global society remains uncertain on how to most effectively estimate the spread of this disease, evaluate different countermeasures to it and allocate resources to fight this epidemic.
Nevertheless, attempts to predict future trends and prevalence of HIV/AIDS have been carried out with a wide range of errors, using the following methods for estimating HIV/AIDS prevalence, such as back-calculation method, “ratio” method, multiplying the estimated annual HIV/AIDS cases by 20, using the results of serological surveys and extrapolating these data to the total 15-49 years old population and some recently developed methods, the workbook method, and the special computer models [1,2].
Based on the differential equation theory,we propose a novel algorithm model system, EEA model system, a new way to estimate the spread of HIV/AIDS, evaluate different countermeasures to HIV/AIDS and analyze the development of ARV-resistant disease strains. It is a se-ries of solvable ordinary differential equation (ODE) models to estimate the spread of HIV/AIDS infections, which not only require only one year’s data to deduce the situation in any year, but also apply the piecewise constant method to employ multi-year information at the same time, overcoming the limitation of the classic in-fection model (SI model) which ignores the change of the population, and the scarcity and error of data.
We simulate the effects of therapy and vaccine, then evaluate the difference between them, and offer the smallest proportion of the vaccination in the population to defeat HIV/AIDS, especially the advantage of using the vaccination while the deficiency of using therapy separately. At last, we analyze the development of ARV-resistant disease strains by the piecewise constant method.
SciRes
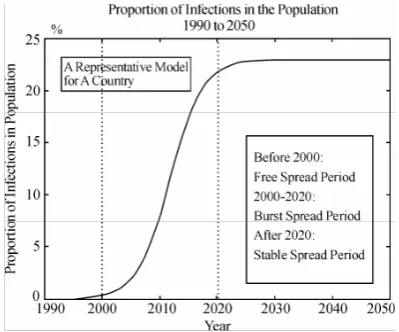
According to our models, we can firstly outline the spread period of HIV/AIDS without any control in a country can be reasonably divided into three main peri-ods (Figure 1.) [3,4]: free spread period, burst spread period and stable spread period.
In recent years, the demand on modeling capability has increased rapidly in the areas of disease analysis, drug design study, environmental assessment, etc. Most modeling approaches are still based on the tra-ditional single-CPU reservoir simulators and have reached their limits with regard to what can be ac-complished with them. During the same period, high performance computing (HPC) technology has in-creasingly been recognized as an attractive alternative modeling approach to resolving large-scale or multi- million-cell simulation problems [5]. As a result, par-allel computing techniques have received more atten-tion in this modeling community.
2. AN IDEAL MODEL TO ESTIMATE THE
SPREAD OF HIV/AIDS
Build a solvable model to estimate the proportion of the number of HIV/AIDS infections in the population for any country in any year, in the absence of any additional interventions. Model 1 2.1. Assumptions and Definitions
Ⅰ. All the derivatives referred in the equations exist. Ⅱ. t is time (unit: year).
N (t) is the population of the country at t. N (t) obeys Logistic Population Model
Ⅲ. The crowd is divided into the susceptible crowd and the infective crowd.
i (t) is the proportion of the infected population in the total population at t.
The rest of the N (t) is the susceptible crowd. Ⅳ. Two main transmission ways:
[image:2.595.71.271.569.735.2]Cross infections: T-1
Figure 1. Proportion of infections in the Population 1990 to 2050
Sharing drug injecting equipment and transfusion of blood or blood-derived products. Vaginal intercourse without a condom (man to woman and woman to man) and anal sex without a condom (both partners are at risk). We assume as the average number of persons infected by an HIV patient per year. Single-chain infections: T-2
An infected mother to her baby during pregnancy, at childbirth, or by breast feeding. And is the birth rate of infected infants in infected crowd per year.
Ⅴ. K3 is the rate of patient death.
2.2. Design of the Model
Through the first transmission way, every patient can infect K1(1−i t( )) healthy people, so there are
1(1 ( )) ( ) ( )
K −i t i t N t people infected every year.
Through the second transmission way, the number of infected people is K N t i t2 ( ) ( ).
We can get
(
( ) ( ))
1 ( )(1- ( )) ( ) 2 ( ) - 3 ( ) ( )d
N t i t K N t i t i t K N t K N t i t
dt = +
(1) After deduce, we can get
2
1 2 3 1
'( )
'( ) ( )i(t) ( ) (t)
N( ) N t
i t K K K i t K i
t
= + − − − ,
So that we can get
2 1 3
2
1 ln ())() ()
( )
( N t it Kit
dt d K K K t
i′ = + − − −
The following question is how to solve those equa-tions. Based on the classic Logistic population model, N (t) should satisfy
, 2 bN aN dt dN
+ − =
Its solution is
bt
ce a
b t
N −
+ =
)
( , where α and β are constants. c
is determined by initial condition.
After fitting, we find out, for the countries in the chart,
α is smaller than β by several orders of magnitude averagely. So we let α= 0 in computation.
The population data of China in this diagram come from[13].Then,
1
( ) t
N t ≈c−βeβ
(2)
So ln dt
d N β
=
)
(t is a constant value for the same
country. Let a=K1,
) ( ln ) ( 3 2
1 K K ddt N t K
b= + − − (3)
and add the initial condition I (t0) = c, meaning c is the
2
0
'( ) ( ) ( ) ( )
i t ai t bi t
i t c
= − + =
⎧
⎨
⎩
(4)Finally we get
) ( 0
) ( ) (
t t b e c b a a
b t
i
− − − −
= (5)
where a, b are undetermined coefficients.
When it comes to how to get a and b, we believe the best way is to get the statistical value of K1, K2, K3
and ln(N(t))
dt
d , then get a and b by (3). Of course this
will burden the workload of the public health department, but that worth it greatly, because these two constants will tell people the destination and rapidity of the HIV/AIDS infections.
It’s easy that
lim ( ) t→∞i t = a
b
(6)
That means, without any additional interventions, the proportion of infected population will steadily come to
a
b . Meanwhile b indicates the speed of i (t) which tends
to limit. So the larger the value of b of a country is, the faster the rate of change in the number of HIV/AIDS infections for this country, and the more attention should be paid to this country. So based on abundant data, it’s significant to estimate the value of a and b. Then we can realize the potential destroy of HIV/AIDS to a country.
It is a pity that we can not get the believable conclu-sion about K1,K2,K3, so we have to apply the fitting
method as a makeshift.
The detailed method is as the followings.
Because the solution of (4) exists and only exists, we can get a series of equations about a and b by referring to the data between 1995 to 1997, and get a series of proximate solutions, while the rest of the data are ap-plied to test the model.
The reason why we take the data in early times is that in those days the infection situation we take as without too many additional interventions which is very neces-sary and reasonable for our model.
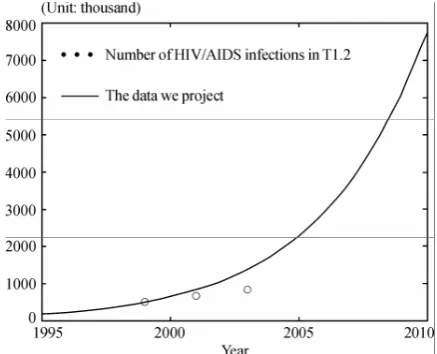
[image:3.595.314.533.560.737.2]Also we can forecast the trend of HIV/AIDS infec-tions in a country, especially the coming of the peak and the appropriate time to take appropriate measures to control the situation.
Table 1. Data of china
Year 1997 1999 2001 2003
Number of HIV/AIDS infections
300,000 [8]
500,000 [12]
660,000 [10]
840,000 [10]
This model ignores some additional interventions, but is easy to be modified to satisfy the requirements in the following models, focusing on two interventions: sion of antiretroviral (ARV) drug therapies, and provi-sion of a hypothetical HIV/AIDS preventative vaccine.
The data in Figure 2 refer to Table I.
The situation of the spread of HIV/AIDS in China accords with our three main periods (as Figure 3 shows). The spread of HIV/AIDS in China is in the free spread period.
3. MODELS TO EVALUATE
COUNTER-MEASURES TO HIV/AIDS
Based on the estimating model, we take the following scenarios into consideration to build three models to solve different problems and come to the significant re-sults.
1. Antiretroviral (ARV) drug therapy. Model 2.1
2. A preventative HIV/AIDS vaccine. Model 2.2
3. Both ARV provision and a preventative HIV/AIDS vaccine. Model 2.3
Assume in these scenarios that there is no risk of emergence of drug-resistant strains of HIV which we will examine this issue later.
3.1. Model in Scenario 1: Antiretroviral (ARV) Drug Therapy
3.1.1. Assumptions and Definitions
First, based on , , Ⅰ Ⅱ Ⅳand in Ⅴ Model 1. And,
. Ⅲ
i(t) is the percentage of the infection in the population (N (t)) at t, which is infective.
r(t) is the percentage of patients accepting ARV in the population at t (r t( )≤i t( )).
These people take the lower death rate p and are stopped to take the infection actions, while all the non-infected are susceptible.
[image:3.595.57.287.703.757.2]Figure 3. Proportion of infections in population China, 2000 to 2100
Ⅵ.
∀ n, ∃ rn s.t. 1
max | ( ) n |
n t n
r t r
− < ≤ − is very small, so,
n r t
r()≈ , at n−1<t≤n
During solve the equation, we consider r (t) is a con-stant in the same year, that is, when n≤t<n+1,
( ) n
r t = r, where n is the number of years.
We can assert the expression of i(t), which is not a ap-proximate solution calculated by computer simulation. Meanwhile, from the subsequent data, we can find out there is no obvious error. Actually, our calculated result is very accurate.
And because we can take ln () ) (t N t d
d as a constant
value (see (1)), the deformation course of the equation will be
2
1 1 2 3
( ( (1 n) ) ) ,
dN di
i N K i K r K K c N
dt + dt= − + − + − −
2 ( ) ,
= − + + n −
di
ai b r a i c
dt
where 2
1 1 2 3
( ( (1 ) ) )
+ = − + − n + − −
dN di
i N K i K r K K c N
dt dt ,
and c=(a-b-p)rn.
These are all undetermined coefficients, while
r
n is determined by outside conditions.With an initial condition, i n( )=in
,
(0≤ ≤in 1)2
' ( )
( ) ( 1)
n
n
i ai b r a i c
i n i n t n
⎧ = − + + − ⎪
⎨
= ≤ ≤ + ⎪⎩
Let in+1=i n( +1), we can backwards calculate all the values in n years.
Similarly we can get
2
1
' ( )
( 1) ( 1)
n
n
i ai b r a i c
i n i+ n t n
⎧ = − + + −
⎪ ⎨
+ = ≤ ≤ +
⎪⎩
Let in =i n( ), so we can calculate forwards. Then we finish the solving course of Model 2.1.
Now we consider how to apply it into the numeric
calculation.
First, based on assumptions IV, a and b here are the same with those are in the Model 1.
So we can continue to use the precious fitted data in
Model 1, while r (n) is determined by outside aid and the population in this country which is given before. So based on the above solving course of the two problems, we just have to get the proportion of the infections in the population in any year after the appearance of HIV/ AIDS, and put the data into them inductively to forecast or backdate the value of t in this country in any year.
Then the calculation of the rate of the change of the
infections this year is as follows, d ( )Ni aN i r( )
dt = −
(1 ) (− + +i b β)Ni, where N can be looked up in the data[13], while d lnN
dt
b= can be fitted by the least-square estimation based on N, which is different for different countries.(Figure 1)
3.1.2. Model Analysis and Application
[image:4.595.322.526.363.535.2]The following results base on the credible data from [10] [12]. From the diagram (Figure 4), we can find out the effect
Figure 4. Rate of change in the number of HIV/AIDS in-fections for Russia from 2005 to 2050
[image:4.595.325.520.565.733.2]of the Antiretroviral (ARV) drug therapy is tiny, as Rus-sia is in Burst Spread Period, despite of the number of infections who received the treatment is very large.
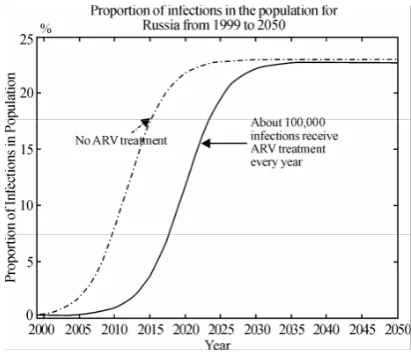
However, if the therapy can be offered earlier, the ef-fect is delectable. As we can see in the diagram (Figure 5) below, about 280,000 infections have received ARV treatment every year since 2002. At that time, Russia is in the end of Free Spread Period.So the ARV drug ther-apy should be offered as early as possible (better before the Burst Spread Period).
So what is the effect of the ARV drug therapy? Based on our model, we can find out it will delay the coming of the infection peak. As what the following diagram shows, the peak will come late at least 5 years, which means we have 5 more precious years to solve it.
3.2. Model in Scenario 2: Preventative HIV/ AIDS Vaccine
3.2.1. Assumptions and Definitions
First, based on , , Ⅰ Ⅱ Ⅳand . Ⅴ And, Ⅲ’’.
We assume vaccine is fully effective without any inef-ficacy and drug-resistant strains, and it will give the pa-tient whole life immunity.
i(t) is the percentage of the infections in the popula-tion (N (t)) at t, which is infective.
s(t) is the percentage of vaccine injections in the population at t, which is not susceptible.
The rest of the N (t) is the susceptible crowd. .
Ⅶ
∀ n, ∃
s
n s. t.1
max | ( ) n|
n− < ≤t n s t −s is very small, so,
n
s t
s()≈ , when n-1<t≤n.
During solving the equation, we consider r(t) is a constant in the same year, that is, when n t≤ ≤ +n 1,
( ) n
s t =s , where n is the number of years.
[image:5.595.67.273.552.729.2]So we can directly deduce the expression of i(t), which is not a approximate solution calculated by com-puter simulation. Meanwhile, from the subsequent data,
Figure 6. Proportion of infections in the population for Russia from 1999 to 2050
we can find out there is no obvious error. Actually, our calculated result is very accurate.
And because we can take ln ( ) ( )
d N t
d t as a constant
value (Model 1), the deformation course of the equation will be
2
1 1 2 3
( ( (1 n) ) ) ,
dN di
i N K i K s K K i N
dt + dt = − + − + −
2 ( ) ,
n di
ai b s a i
dt = − + − (7)
where a K1, b K1 K2 K3 d (ln )N dt
= = + − − , and these
are all undetermined coefficients, while
s
n is deter-mined by outside conditions.With an initial condition, i n( )=in,(0≤ ≤in 1)
2
' ( )
( ) ( 1)
n
n
i ai b s a i
i n i n t n
⎧ = − + −
⎪ ⎨
= ≤ ≤ +
⎪⎩ (8)
So we can get
( )( )
( )
( ) ( ) / ( )
( 1)
n
b as t n
n n
n
n
a i s b
i t b as a e
i n t n
− − −
+ −
= − −
≤ < +
(9) Similarly we can get
2
1
' ( )
( 1) ( 1)
n
n
i ai b s a i
i n i+ n t n
⎧ = − + −
⎪ ⎨
+ = ≤ ≤ +
⎪⎩
E.2-2-3’
( )( )
1
1
( )
( ) ( ) / ( )
( 1)
n
b as t n
n n
n
n
a i s b
i t b as a e
i n t n
− − −
+
+
+ −
= − −
≤ < +
(10) Then we finish the solving course of Model 2.1. From (11), we can get lim ( )
t
b i t s
a
→∞ = − , so when
b s
a= , i(t)=0. That is, when b s
a
≥ , maybe we will clear
up HIV/AIDS. That means, when the percentage of vac-cine injections in the population is lower than b/a, the percentage of the infections in the population will finally tend to b/a-s, so only when it equals to or is higher than b/a, we can finally defeat HIV/AIDS. That really pro-vides a great meaning suggestion to the government layout and deployment.
Now we consider how to apply it into the numeric calculation.
the above solving course of the two problems, we just have to get the proportion of the infections in the popu-lation in any year after the appearance of HIV/AIDS, put the data into the inductive formula,
0
( ) lim ( ) n
x n
i i n i x
→ −
= = ,
so we can forecast or backdate the value of t of this country in any year.
3.2.2. Model Analysis and Application
Take the situation in Brazil as an example to explain our model and result.
The reason why we take Brazil as an example is that the percentage of ARV treatment there has come to 100 %. [12] So we believe it’s reasonable and representative to select Brazil to show the effect of the vaccination.
So in Brazil we let the proportion of vaccination is 0.081, which approximates to b/a (refer to Model 1). When we use the vaccine measurement in 2010, the rate of change in the number of HIV/AIDS infections will slow down obviously. So if the proportion of vaccination is over 0.08 every year (see Figure 7), and the trend of defeating HIV/AIDS maybe will appear.
So we come to the conclusion: Compared with ARV treatment, vaccination is a better way to clear up the HIV/AIDS, which has the following advantages:
Less cost
Convenient application
Better efficiency in short period Clearing up HIV/AIDS finally
But, it’s a pity that the efficient vaccine is not avail-able now.
4. MODEL IN SCENARIO 3: BOTH ARV
PROVISION AND PREVENTATIVE HIV/
AIDS VACCINE
4.1. Assumptions and Definitions
First, based on , , Ⅰ Ⅱ Ⅳ,Ⅴ,Ⅵ,and . Ⅶ And, ’’’
Ⅲ
[image:6.595.65.275.546.732.2]i(t) is the percentage of the infection in the popula-
Figure 7. Proportion of infections in population Brazil from 2000 to 2050
tion (N (t)) at t, which is infective.
s(t) is the percentage of patients accepting ARV in the population at ( ( )t s t ≤i t( )). These people take the lower death rate p and are stopped to take the infection actions, while all the non-infected are susceptible.
r(t) is the percentage of vaccine injection in the popu-lation at t, which is not susceptible.
4.2. Design of the Model
During solving the equation, we consider r(t) and r(t) are constants in the same year, that is,
when n t≤ < +n 1, ( ) ( )
n
n
s t s r t r
= =
⎧
⎨
⎩
, where n is thenum-ber of years.
So we can directly deduce the expression of i(t), which is not a approximate solution calculated by com-puter simulation. Meanwhile, from the subsequent data, we can find out there is no obvious error. Actually, our calculated result is very accurate.
And because we can take ln ( ) ( )
d N t
d t as a constant
value (Model 1), the deformation course of the equation will be
2
1 1 2 3
( ( (1 n n) ) ) ,
dN di
i N K i K s r K K i c N dt + dt= − + − + + − −
2 ( ) ,
n n
di ai b s a r a i c
dt= − + − + −
where a K1, b K1 K2 K3 d(ln )N dt
= = + − − , and
(1
n)
nc a
=
−
s r
, and these are all undetermined coeffi-cients, whiles
n is determined by outside conditions. With an initial condition,i n
( )
=
i
n,(0
≤ ≤
i
n1)
d 2
' ( ( ) ) r(-as+b+ lnN-p)
dt
( 1) n ( 1)
i ai b rn s a in
i n i n t n
⎧ ⎪ ⎨ ⎪ ⎩
= − + + − −
+ = ≤ ≤ +
(11)
(n n)
d b= + r −s a,
( d ln( ))
c r as b p N
dt
= − + − + , (n t n≤ ≤ +1).
Similarly we can get
2
1
d
' ( ( ) ) r(-as+b+ lnN-p)
dt
( 1) n ( 1)
i ai b rn s a in
i n i+ n t n
⎧ ⎪ ⎨ ⎪ ⎩
= − + + − −
+ = ≤ ≤ +
(12)
2
2 1
2
1 1
( ) ( ( ( 1) 4
2 2
( 2 )
) 4 )
4
n
i t arctg t n ca d
a
arctg d i a
ca d d
ca d +
= − − − −
− +
+ − +
−
(13)
( n n)
d b= + r −s a , c r as b p( d ln( ))N dt
= − + − + ,
(n t n≤ ≤ +1).
Then we finish the solving course of Model 2.1
First, it’s not hard to find out, a, b here have the same definitions with those are in the Model 1. So we can continue to use the precious fitted data in Model 1, while s(n) is determined by outside aid and the population in this country which is given before. So based on the above solving course of the two problems, we just have to get the proportion of the infections in the population in any year after the appearance of HIV/AIDS, and put the data into the above formulas inductively, to forecast or backdate the value of t of this country in any year. Then the calculation of the rate of the change of the in-fections this year is as follows,
( ) ( )(1 ) ( ) ( )
d Ni aN i rn i sn b N i rn pNrn dt = − − − + +β − + ,
where N can be looked up in the data that ICM provides, while dlnN
dt
β= can be fitted by the least-square es-timation based on N, which is different for different countries.
4.3. Model Analysis and Application
In this model, we can estimate the expected rate of change in the number of HIV/AIDS infections for a country under realistic assumptions for two scenarios: Antiretroviral (ARV) drug therapy and a preventative HIV/AIDS vaccine.
Take the situation in India as an example to explain our model and result [12].
The reason why we take India as an example is that India, a developing country, will have the largest popula-tion in the world in the not far future.
[image:7.595.64.277.547.725.2]As the above two conclusions we come to, the effi ciency of vaccination is better than treatment. So in the
Figure 8. Rate of change in the number of HIV/ADIS infections for India from 2005 to 2050
less fund situation, vaccination is the first choice.
To India, a developing country with a very large population, should apply vaccination, under the condi-tion, certain amount of treatment.
5. Models to Analyze the Development
of ARV-resistant Disease Strains
We will re-formulate the three models developed in last section, taking into consideration the following assump-tions about the development of ARV-resistant disease strains.A person receiving ARV treatment with adherence below 90 percent has a 5 percent chance of producing a strain of HIV/AIDS which is resistant to standard first-line drug treatments. Second-and third-line ARV drug therapies are available, but assume that these drugs are prohibitively expensive to implement in countries outside of Europe, Japan, and the United States. Model 3 5.1. Assumptions and Definitions
First, based on , , , , Ⅰ Ⅱ Ⅳ Ⅴ Ⅵ,and .Ⅶ And,
’’’ Ⅲ
i(t) is the percentage of the infection in the population (N (t)) at t, which is infective.
r(t) is the percentage of patients accepting ARV in the population at t (s t( )≤i t( )).
These people take the lower death rate p and are stopped to take the infection actions, while all the non-infected are susceptible.
s(t) is the percentage of vaccine injection in the popu-lation at t, which is not susceptible.
Ⅷ
p in ’’’ is the functiⅢ on of t , and ∀ n, ∃ pn s.t. max | ( ) |
1 p t pn
n− < ≤t n − is very small, so,
p(t)≈ pn, at n− < ≤1 t n.
5.2. Design of the Model
At first, we have to do some necessary modifications. The development of ARV-resistant disease strains doesn’t have effect on the model without ARV treatment,
Model 2.2. So we just have to focus on Model 2.1 and
Model 2.3. Because of the similarity between these two models, we just take Model 2.1 as an example.
The development of ARV-resistant disease strains will cause the rising of the proportion of the patients with ARV treatment, that is, p is bigger. To get the more general result, we assume p is the function of t, p(t).
Remain the rest of the assumptions, the model will be modified into
1
2 3
( ( ) ( )) ( )(1 ( ))( ( ) ( )) ( ) ( )( ( ) ( )) ( ) ( )
( ) ( ) n n
d N t i t K N t i t i t r t
dt
K K N t i t r t p t Nr t
N n i n N i
⎧ ⎪ ⎪⎪ ⎨ ⎪ ⎪ ⎪⎩
= − −
+ − − −
Just as how we deal with r(t) and s(t), we assume p(t)=p n t nn( ≤ < +1).
Then deduce functions, we get
2 ( )
( ) n n t n 1
di ai b ar i c
dt i n i
⎧ ⎪ ⎨ ⎪ ⎩
= − + + −
= ( ≤ ≤ − )
and
2
1
( )
( 1) n n t n 1
di ai b ar i c
dt
i n i+
⎧ ⎪ ⎨ ⎪ ⎩
= − + + −
+ = ( ≤ ≤ − )
where a= K ,1 b=K1 K2 tlnN
d d
+ − , c=(a+b- pn )
n
r , ( n∈Z).
The solutions of the above questions is uniquely exists, and have the expressions, which we will not give unnec-essary details to.
Then with im =i( ) lim i(x)m =x→m , we can get a satisfied
curve of the rate of the change of infections starting at one point.
5.3. Model Analysis and Application
The result of the model is as the following diagram shows (Figure 9).
We take India as an example to explain the result. (HIV/AIDS infections data from [10])
The development of ARV-resistant disease strains will cause the rising of the proportion of the patients with ARV treatment. And India has a long way to solve the HIV/AIDS problem.
[image:8.595.62.280.548.733.2]We can satisfy all the requirements in the last section, under the conditions in this section, using our models with the similar methods, so we will not give unneces-sary details to the realization of other models in this sec-tion.
Figure 9. Rate of change in the number of HIV/ADIS infections for India from 2005 to 2050
6. HIGH PERFORMANCE COMPUTING
PLATFORM
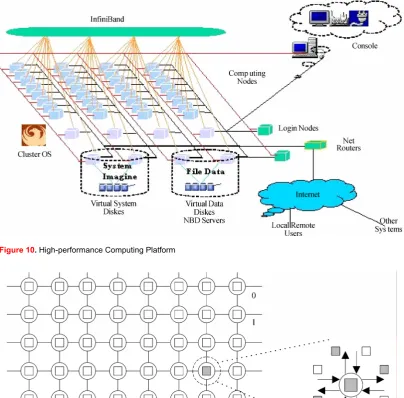
Dawning 4000L, IDC data processing machine, as Fig-ure 10, shows, located in Shenzhen Institute of Ad-vanced Technology, Chinese Academy of Sciences, has been designed to provide more than 3 teraflops comput-ing capability with 644 processors, 644GB physical memory and 100 terabytes storage. The machine can be upgraded online to 6.75 teraflops computing capability with 1300 processors, 4000GB physical memory and 600 terabytes storage.
The computing capability of the common PC will be enough for our model, while in simulating a large scale and establish the relation between time and variation ratio in real time, especially when amount of data be-come very large, the performance of database manage-ment system will drop sharply , ability of data of or-ganization and management weaken greatly , can't real-ize the rapid searching for the a great deal of data .And what is more, it can even cause the breakdown of system when amount of data is getting larger, so high perform-ance computing platform will come to be necessary.
Each CPU will compute the variable situation in a certain area which divided by grids (P( ) :n M n( )→n, P is the processor, M is the certain area, and n is the number. As Figure 11 shows, with the communication in the results, finally, we can get the whole situation in a large scale area, such as a country, a continent and the global world, and the acceleration rate will come to around 4 to 5.5.
7. CONCLUSION AND FUTURE WORK
We identify the scenarios and problems in spreading and countermeasures evaluating, and propose a novel algo-rithm model system, the EEA model system, with three distinctive main conclusions. First, three main periods spread of HIV/AIDS, and finally comes to the stable spread period. Secondly, the limitations and applications of the antiretroviral (ARV) drug therapies. Thirdly the minimum proportion of vaccination in a country to eliminate HIV/AIDS.Based on the design, analysis, and application of our model system which based on high performance com-puting platform, we can safely draw the conclusion that the EA model system exploits a new way to estimate the spread of HIV/AIDS, evaluate different countermeasures to HIV/AIDS and analyze the development of ARV-resistant disease strains and will behave a great positive effect on defeating HIV/ AIDS.
Figure 10. High-performance Computing Platform
Figure 11. Computation and communication in the CPUs
REFERENCES
[1] B. H. Reinhard; K. S. Bernd; G. Peter; K. Bernhard; S. Shlomo; H. Eilke B 1. (1997) ‘Changing incidence of AIDS-defining ill-nesses in the era of antiretroviral combination therapy’, AIDS. 11(14): 1731-1738, November 15, 1997.
[2] B. Rapatski, P. Klepac, S. Dueck, M. X. Liu and L. I. Weiss, (2001) ‘Mathematical epidemiology of HIV/AIDS in Cuba dur-ing the period 1986-2000’, Mathematical Biosciences and En-gineering, Vol. 3, No. 3, pp. 545-556.
[3] C. Willard JR. MD, MPH; The American Social Health Asso-ciation Panel (1999) ‘Estimates of the Incidence and Prevalence
of Sexually Transmitted Diseases in the United States’, Sexually Transmitted Diseases. Vol .26, No.4, Supplement: S2-S7, April. [4] Lewis. (2001) ‘Three stage AIDS incubation period: a
worst case scenario using addict-needle interaction as-sumptions’. Mathematical Biosciences, Vol. 169, No.01, pp. 53-87.
[5] F. Berman, G. Fox, T. Hey. (2003) Grid Computing: Making the Global Infrastructure a Reality. John Wiley and Sons. P747-771.
[7] D. J. Gregory, C. K. Patricia, Y. M. Li,; J. M. Kaldor,.; C. A. David, B. J. Bruce (1999) ‘Epidemiology and Social’, AIDS, Vol.13, No.10, pp.1249-1253, July 9.
[8] H. L. Wu. (2000) ‘Modeling the HIV epidemic: a state-space approach’. Mathematical and Computer Modeling, Vol. 32, No. 1-2, pp.197-215.
[9] Ministry of Health of the People’s Republic of China (2003) ‘Report on the Chinese AIDS Epidemic (Chinese version, De-cember 2003)’, DeDe-cember 1.
[10] UNAIDS/WHO. (2003) ‘Overview of making estimates of HIV/AIDS and its impact in countries with low-level or concen-trated epidemics: The Workbook Method’. UNAIDS/WHO, June.
[11] UNAIDS. (2004) ‘Report on the global AIDS epidemic (English original, June 2004)’.
[12] UNGASS. (2003) ‘Program monitoring data from UNGASS (United Nations General Assembly Special Session) country reports 2003’.
[13] UNAIDS. (2000) ‘UNAIDS Epidemiological Fact Sheets by Country’, June.
[14] United Nations. (2005) ‘Population Division, Department of Economic and Social Affairs (2005) World Population Prospects: The 2004 Revision’.
[15] I. Foster, C. Kesselman. (1999) The Grid Blueprint for a New Computing Infrastructure [M]. Morgan Kaufmann Publishers, Inc., 6-8.
[16] I Foster, C Kesselman, S Tueeke. (2001) The anatomy of the grid: Enabling scalable virtual organizations. International Journal of Supercomputer Applications, 15(3): 200-222. [17] Z. W. Xu, W. Li, L. Zha, et al. (2004) Vega: A Computer
Sys-tems Approach to Grid Computing. Journal of Grid Computing. Vol. 2(2): 109-120.
[18] Y. L. Gong, F. P. Dong, W. Li, Z. W. Xu. (2003) VEGA Infra-structure for Resource Discovery in Grids. Journal of Computer Science & Technology. Vol. 18, No.4, 413-422.
[19] W Allcock, J Bresnahan, J Bester. et a1. (2002) Grid FTP Protocol Specification [Z]. GGF Grid FTP Working Group Document. [20] J Bester, I Foster, C Kessdman et a1. (1999) GASS:A data
movement and access service for wide a computing systems [A]. Sixth Workshop on I/O in Parallel and Distributed System[C]. [21] S. Y. Liu, C. Liu, C. Z. Zhao and Yu Liu. (2007) Mathematical
Models and Optimization Discussions on EA System on AIDS/ HIV Spread Estimating and Countermeasures Evaluating. IEEE 7th International Symposium on Bioinformatics and Bioengi-neering.
[22] D. Patterson, A. Brown el a1. (2002) Recover oriented comput-ing (ROC): Motivation, definition, techniques, and ease studies. UC Berkeley, Tech Rep: UCB/CSD-02-1175.
[23] L. Chen, C.L. Wang, F. C. M. Lau, and R. K. K. Ma, (2002) “A
Grid Middleware for Distributed Java Computing with MPI Binding and Process Migration Supports,” International Work-shop on Grid and Cooperative Computing (GCC-2002), De-cember 26-28, Hainan, China, pp. 640-652.
[24] M. J. M. Ma, C. L. Wang, F. C. M. Lau. (2000) “JESSICA: Java-Enabled Single-System-Image Computing Architecture,” Journal of Parallel and Distributed Computing, Vol. 60, No. 10, pp. 1194-1222.
[25] H. Stockinger, F. Donno, E. Laure, S. Muzaffar, P. Kunszt, G. Andronico, P. Millar. (2003) Grid Data Management in Action: Experience in Running and Supporting Data Management Ser-vices in the EU Data Grid Project. Computer Science.
[26] K. Gor, D. Ra, S. Ali, L. Alves, N. Arurkar, I. Gupta, A. Chak-rabarti, A. Sharma, S. Sengupta. (2005) Scalable enterprise level workflow and infrastructure management in a grid computing environment. Cluster Computing and the Grid.
[27] K. Yang, A. Galis, C. Todd, (2002) Policy-based active Grid management architecture. Networks. ICON 2002.
[28] A. Boukerche, A. Roy. (2002) Dynamic Grid-Based Approach to Data Distribution Management. Journal of Parallel and Dis-tributed Computing.Volume 62, Issue 3, Pages 366-392. [29] A. -M. Vandamme, K. Van Laethem, and E. De Clercq, (1999)
“Managing Resistance to Anti-HIV Drugs: An Important Con-sideration for Effective Disease Management,” Drugs, Vol. 57, >No. 3, 337-361.
[30] H. Walter et al., (1999) “Rapid, Phenotypic HIV-1 Drug Sensi-tivity Assay for Protease and Reverse Transcriptase Inhibitors,” J. Clinical Virology, Vol. 13, Nos. 1-2, 71-80.
[31] D. Wang, S. Bloor, and B. A. Larder, (2000) “The Application of Neural Networks in Predicting Phenotypic Resistance from Genotypes for HIV-1 Protease Inhibitors,” Antiviral Therapy, Vol. 5, supplement 3, 51-52.
[32] J. R. Quinlan, (1993) C4.5: Programs for Machine Learning, Morgan Kaufmann, San Francisco.
[33] C. J. C. Burges, (1998) “A Tutorial on Support Vector Machines for Pattern Recognition,” Data Mining and Knowledge Discov-ery, Vol. 2, No. 2, 121-167.
[34] T. Joachims, (1999) “Making Large-Scale Support Vector Ma-chine Learning Practical,” Advances in Kernel Methods: Sup-port Vector Learning, B. Schölkopf, C. Burges, and A. Smola, eds., MIT Press, Cambridge, Mass., 169-184.
[35] J. Selbig, T. Mevissen, and T. Lengauer, (1999) “Decision Tree-Based Formation of Consensus Protein Secondary Structure Prediction,” Bioinformatics, Vol. 15, No. 12, 1039-1046. [36] X. Shen, W. K. Liao, A. Choudhary, G. Memik, M. Kandemir,