* Corresponding author.
E-mail: [email protected] (A. M. Golmohammadi) © 2016 Growing Science Ltd. All rights reserved.
doi: 10.5267/j.ijiec.2015.12.002
International Journal of Industrial Engineering Computations 7 (2016) 481–488
Contents lists available at GrowingScience
International Journal of Industrial Engineering Computations
homepage: www.GrowingScience.com/ijiec
A multi-objective location routing problem using imperialist competitive algorithm
Amir Mohammad Golmohammadia*, Shahrokh Amanpour Bonabb and Amir Parishanic
aPh.D Student of Industrial Engineering,University of Yazd, Yazd, Iran
bYoung Researchers and Elite Club, Central Tehran Branch, Islamic Azad University, Tehran, Iran cDepartment of Industrial Engineering, Naragh Branch, Islamic Azad University, Naragh, Iran
C H R O N I C L E A B S T R A C T
Article history: Received August 31 2015 Received in Revised Format Septmber 26 2015 Accepted December 2 2015 Available online
December 7 2015
Nowadays, most manufacturing units try to locate their requirements and the depot vehicle routing in order to transport the goods at optimum cost. Needless to mention that the locations of the required warehouses influence on the performance of vehicle routing. In this paper, a mathematical programming model to optimize the storage location and vehicle routing are presented. The first objective function of the model minimizes the total cost associated with the transportation and storage, and the second objective function minimizes the difference distance traveled by vehicles. The study uses Imperialist Competitive Algorithm (ICA) to solve the resulted problems in different sizes. The preliminary results have indicated that the proposed study has performed better than NSGA-II and PAES methods in terms of Quality metric and Spacing metric.
© 2016 Growing Science Ltd. All rights reserved
Keywords:
Optimization
Mathematical Programming Locating storage unit Vehicle routing
The meta-heuristic Algorithm
1. Introduction
(2006) considered a vehicle routing problem with backhauls (VRPB) where a set of costumers are categorized in two subsets consisting of linehaul and backhaul costumers. They used memetic algorithm to solve the resulted VRPB. Arvan et al. (2015) designed a bi-objective and multi-product supply chain network for the supply of blood. Teimuory et al. (2013) devloped a multi-objective reliable programming model for disruption in supply chain.
This paper presents a mathematical programming model to optimize the storage location and vehicle routing. The first objective function of the model minimizes the total cost associated with the transportation and storage of rental fee, and the second objective function minimizes the difference distance traveled by vehicles.
2. The proposed study
We first introduce the mathematical model by introducing sets, parameters and variables, etc.
Sets
Set of all distribution centers I
Set of all customers J
Set of all transportation facilities K
Parameters
Demand for each customer j Number of customers
N
Vehicle service time of customer j by transportation k
sjk
Distance between customer i and j
Vehicle waiting time of customer j by transportation k
wjk
Unit cost of travelling between i and j
Fixed capacity of transportation vehicle Unit time of travelling between i and j
tij
Total traveling time spent by vehicle Fixed cost of establishing distribution center i
Unbalanced distance spent Fixed cost of using transportation facility k
Variables
One of the set of customers and storages i in path k is located after node j and zero, otherwise One if storage i is established and zero, otherwise
One if customer i is assigned to storage j and zero, otherwise A dummy variable to remove sub tour
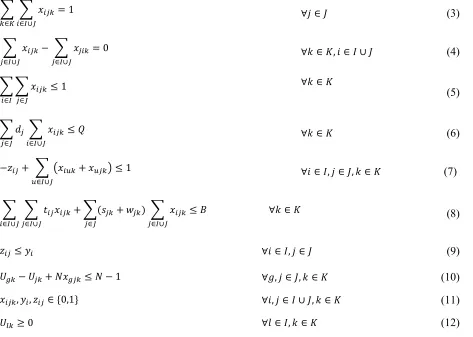
Mathematical model
∈ ∈ ∈ ∈ ∈ ∈ ∈ (1)
∈
∈ ∈ ∈ ∀ ∈
) 2 (
∈ ∪ ∈
1 ∀ ∈ (3)
∈ ∪ ∈ ∪
0 ∀ ∈ , ∈ ∪ (4)
∈ ∈
1 ∀ ∈ (5)
∈ ∈ ∪ ∀ ∈ (6)
∈ ∪
1 ∀ ∈ , ∈ , ∈ (7)
∈ ∪
∈ ∪ ∈ ∈ ∪
∀ ∈ (8)
∀ ∈ , ∈ (9)
1 ∀ , ∈ , ∈ (10)
, , ∈ 0,1 ∀ , ∈ ∪ , ∈ (11)
0 ∀ ∈ , ∈ (12)
The first objective function minimizes transportation cost as well as fixed costs associated with storages and facilities. The second objective function minimizes unbalanced distance travelled. In other words, this objective function tries to setup a balance on distance travelled by all vehicles. According to Eq. (3), every customer uses only one vehicle while Eq. (4) states the sum of flows. Eq. (5) specifies that there is only one distance between two customers. Eq. (6) shows the capacity limitation for each vehicle. According to Eq. (7), a customer can only use a path when the path belongs to the same storage. Eq. (8) demonstrates total amount of traveling time. Eq. (9) specifies that we can assign a customer to a storage when the storage has already been established. Eq. (10) eliminates all sub-tours. Finally, Eq. (11) and Eq. (12) show the types of variables.
3. Solutionstrategy
The proposed study of this paper uses a hybrid of genetic and imperialist to solve the mathematical problem.
3.1. Solution representation
As is obvious, the efficiency and quality of a metaheuristics is entirely dependent on the representation of the solution. In addition, we have to be able to search the entire space using a good solution representation. Fig. 1 demonstrates the string, which is used for solution representation.
Suppose there are n customers, m vehicles and d candidates for storage. The solution representation
contains n+2m components, consists of three parts. The first two parts are used for assignment of
customers and sequencing and the third part is devoted for locating facilities. In fact, the first n part shows the sequence of customers, the second m part identifies the customers and finally, the third part represents the location of storage and where each vehicle should start its operations.
The Imperialist Competitive Algorithm (ICA) (Atashpaz-Gargari & Lucas, 2007) begins by creating a set of candidate random solutions in the search space of the optimization process called the initial countries. Countries in this method are the counterpart of Chromosomes in genetic algorithms (GAs), which is an array with values of a candidate solution of optimization procedure and the objective function of the
optimization problem detects the power of each country ( , , , … , ). Based on their
power, some of the best initial countries become Imperialists and begin taking control of other colonies and form the initial Empires. Here the objective function is calculated as follows,
(13)
, , ,
,
,, ,,
where , represents the normalized objective function ,, , ,, and ,, represent the best, the
maximum and the minimum objective functions, respectively. Next, the final normalized cost is calculated as follows,
(14)
,
In addition, the power of each empire is calculated as follows,
∑
(15)
The number of colonies ( ) is calculated as follows,
. , (16)
where represents total number of colonies. Total power of empire ( ) is calculated as follows,
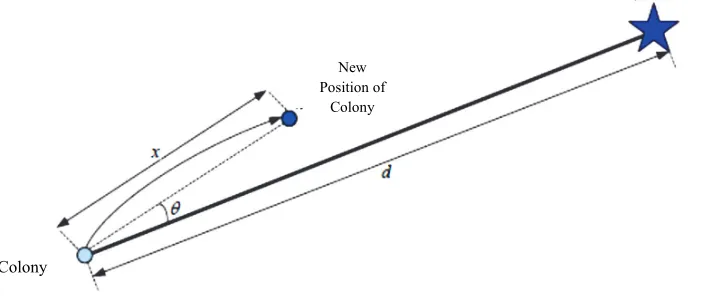
(17) where is a positive number between zero and one. Fig. 2 shows the movement of colony towards Imperialist.
Fig. 2. The movement of colonies towards Imperialist New
Position of Colony
Imperialist
As we can observe from Fig. 2, d represents the distance between colony and Imperialist, x is a random number between zero and β×d where β > 1. The movement is shown with θ and the rate of responses, which get close to Imperialist is demonstrated by PA. To transfer data between the colonies crossover
operator in genetic algorithm is used. For crossover, the proposed study uses single point and two point operations. Tournament selection method used to select the colonies. Also, Pc represents a portion of the
population chosen for crossover operations. In order to escape from local min, we use revolution. In competition, the power of weaker imperialist becomes less and more powerful imperialist become dominant. The likelihood of capturing each imperialist is calculated as follows,
(18)
where represents total normalized power of imperialist n, states the power of imperialist
n and denites the power of imperialist i. The possibility of capturing each imperialist is also calculated as follows,
∑ .
(19)
Finally, when there is only one imperialist, the algorithm terminates.
Deb et al. (2000) is the first who developed the idea of non-dominated sorting GA for multi-objective optimization known as NSGA-II method. Since we encounter with more than one optimal solution we have to handle multiple objective functions. Therefore, we show all efficient solutions in a set of Pareto optimal solutions. The following demonstrates the implementation of NSGAII originally developed by Parhizkari et al. (2013).
Step 1: Chromosome setting: The structure of the chromosome is designed based on a matrix.
Step 2: Evaluation: All generated solutions are assessed according to objective functions.
Step 3: Split solutions into two groups of dominated and non-dominated groups,
Step 4: Calculate design parameter: In this step, for each member of groups, calculate a parameter to compute the distance from the other members of group.
Step 5: Make a strategy to choose parents for the next generation,
Step 6: Execute two mutation and crossover operations to generate the new generation of solutions.
Step 7: Termination criteria: The proposed study of this paper terminates after some stopping criteria are met.
The results of the proposed method are compared with two other techniques of NSGA II and Pareto Archived Evolution Strategy (PAES) (Knowles & Corne, 1999).
3. The results
In this section, we present details of the implementation of Imperialist and compares the method with two
other methods, NSGA II and PAES. We have solved the problem for problems with different sizes. When
∑ ̅
1 ̅
(20)
where di is the Euclidean distance between consecutive solutions in the calculated nondominated set of
solutions and ̅is the average of these distances. Table 1 shows details of input parameters for the proposed method.
Table 1
The summary of the parameter used for the proposed study
Factors Optimal real value
S L
n-Pop 193 300
N-imp 5 8
A
P 0.54 0.64
C P
0.60.6
R
P 0.12 0.32
ξ
0.1250.195
β 1.8 2.15
Tables (2-5) represent the performance of the proposed study for different size and number of distributions.
Table 2
The results of the survey for problems with sizes between 10 to 30 and distribution channels of 3 to 8
Problem No. Quality Metric (QM) Spacing Metric (SM)
NSGA-II
PAES MOICA PAESNSGA-II MOICA
10#3 0.235 0 0.765 0.827 0.625 0.741
10#4
0.105 0.8950 0.4950.661 0.778
15#3 0.250 0 0.750 0.791 0.788 0.920
15#4 0 0 1 0.7850.693 0.868
15#5 0 0 1 0.571 1.092 0.634
20#3 0 0 1 0.9991.184 0.881
20#4 0.235 0 0.765 0.778 1.257 0.973
20#5
0.434 0.5650 1.0360.560 0.874
20#6 0.347 0.217 0.434 0.733 1.031 0.924
25#3
0.100 0.9000 1.1201.207 1.361
25#4 0.272 0 0.727 1.001 0.878 1.287
25#5
0.292 0.7080 1.3600.977 1.220
25#6 0.190 0 0.809 0.940 0.977 1.481
30#3
0.167 0.083 0.750 1.0840.651 1.116
30#4 0.059 0.294 0.647 1.059 1.322 0.810
30#5 0 0 1 0.9650.942 0.978
30#6 0 0 1 0.670 0.916 0.980
30#7
0.118 0.8820 1.4780.986 1.041
30#8 0 0 1 0.586 0.911 0.642
As we can observe from the results of Table 2, the proposed multi-objective ICA (MOICA) performs better than alternative methods; namely NSGA-II and PAES in terms of QM and SM.
Table 3
The results of the survey for problems with size of 40 and distribution channels between 3 to 10
Problem No. Quality Metric (QM) Spacing Metric (SM)
NSGA-II
PAES MOICA NSGA-II PAES MOICA
40#3 0.071 0 0.928 1.302 1.417 1.390
40#4
0.3634 0.272 0.364 1.019 1.167 1.267
40#5 0.357 0 0.642 1.628 1.295 1.649
40#6
0.318 0.182 0.500 1.059 1.272 1.321
40#7 0.370 0 0.630 0.984 1.374 1.372
40#8
0.0416 0.9580 1.037 1.296 0.935
40#9 0.240 0 0.760 1.2678 1.049 1.410
40#10
The results of Table 3 and Table 4 indicate that MOICA in most cases perform better than the other alternative methods for medium size problems.
Table 4
The results of the survey for problems with size of 50 and distribution channels between 3 and 12
Problem No. PAESNSGA-II Quality Metric (QM) MOICA NSGA-II PAESSpacing Metric (SM) MOICA
50#3 0.434 0.086 0.478 1.339 1.461 1.479
50#4
0.105 0.8950 1.342 1.181 1.292
50#5 0.238 0 0.762 1.465 1.548 1.466
50#6 0 0 1.0761 1.346 0.764
50#7 0 0 1 1.042 1.249 1.446
50#8 0 0 1.4691 1.212 0.893
50#9 0 0 1 0.753 1.202 1.432
50#10 0.1070 0.892 1.127 1.043 0.795
50#11 0.160 0 0.840 0.952 0.998 0.863
50#12 0 0 1.0011 1.020 1.033
Table 5
The results of the survey for problems with size of 70 and distribution channels between 3 and 16
Problem No. PAESNSGA-II Quality Metric (QM) MOICA NSGA-II PAESSpacing Metric (SM) MOICA
70#3 0 0 1 0.672 0.501 0.905
70#4 0 0 0.5171 1.299 0.811
70#5 0 0 1 0.586 0.593 0.878
70#6 0 0 0.7371 0.402 0.752
70#7 0.200 0 0.800 0.826 0.514 0.953
70#8 0 0 0.4951 1.032 0.427
70#9 0 0.076 0.924 1.230 0.559 0.893
70#10 0 0 0.9941 0.789 0.806
70#11 0 0 1 0.726 1.119 0.850
70#12 0 0 0.6321 0.904 0.608
70#13 0 0 1 1.019 1.069 1.071
70#14
0.352 0.6470 0.721 1.024 0.721
70#15 0.273 0 0.727 0.491 1.151 0.993
70#16 0 0 1.0391 0.550 0.673
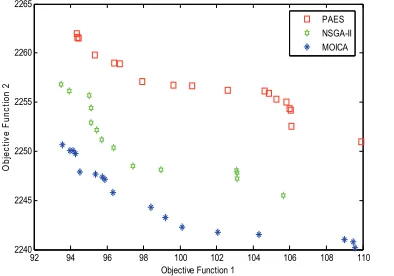
Finally, Table 5 presents the results of the implementation of the proposed method when the sizes of the problems are relatively large. Once more, the proposed method has appeared to outperform the other alternative methods. Fig 3 shows the Pareto solutions for two different sizes of the problems solved.
Pareto solutions for size = 30 and 6 distribution channels Pareto solutions for size = 70 and 12 distribution channels
Fig. 3. The results of the Pareto solutions for small and large instances
92 94 96 98 100 102 104 106 108 110
2240 2245 2250 2255 2260 2265
Objective Function 1
O
bj
ec
tiv
e F
unc
tion 2
PAES NSGA-II MOICA
1000 1050 1100 1150 1200 1250 1300 1350 1400
2.636 2.638 2.64 2.642 2.644 2.646 2.648
2.65x 10
4
Objective Function 1
O
bj
ec
tiv
e F
unc
tion 2
4. Conclusion
In this paper, we have presented a mathematical programming model to optimize the storage location and vehicle routing. The first objective function of the model minimized the total cost associated with the transportation and storage of rental fee, and the second objective function minimized the difference distance traveled by vehicles. We have used Imperialist Competitive Algorithm (ICA) to solve the resulted problem for different sizes of small, medium and large. The preliminary results have indicated that the proposed study has performed better than NSGA-II and PAES methods in terms of Quality metric and Spacing metric. As a future study, we may solve the problem by considering uncertainty in input parameters and we leave it for interested researchers as future studies.
Acknowledgement
The authors would like to thank the anonymous referees for constructive comments on earlier version of this paper.
References
Arvan, M., Tavakkoli-Moghaddam, R & Abdollahi, M. (2015). Designing a bi-objective and
multi-product supply chain network for the supply of blood.Uncertain Supply Chain Management, 3(1),
57-68.
Atashpaz-Gargari E, & Lucas C. (2007). Imperialist competitive algorithm: an algorithm for optimization
inspired by imperialistic competition. In: IEEE conference CEC.
Christofides, N., & Eilon, S. (1969). An algorithm for the vehicle-dispatching problem. Operations
Research, 20(3), 309-318.
Deb, K., Agrawal, S., Pratap, A., Meyarivan, T. (2000). A fast elitist non-dominated sorting genetic algorithm for multi-objective optimization: NSGA-II. In: proceedings of the parallel problem solving from nature VI (PPSN-VI) conference, 849-858.
Knowles, J., & Corne, D. (1999). The pareto archived evolution strategy: A new baseline algorithm for
pareto multiobjective optimisation. In Evolutionary Computation, 1999. CEC 99. Proceedings of the
1999 Congress on (Vol. 1). IEEE.
Parhizkari, M., Amiri, M., & Mousakhani, M. (2013). A multiple criteria decision making technique for supplier selection and inventory management strategy: A case of multi-product and multi-supplier problem. Decision Science Letters, 2(3), 185-190.
Tavakkoli-Moghaddam, R., Saremi, A. R., & Ziaee, M. S. (2006). A memetic algorithm for a vehicle
routing problem with backhauls. Applied Mathematics and Computation, 181(2), 1049-1060.
Teimuory, E., Atoei, F., Mohammadi, E & Amiri, A. (2013). A multi-objective reliable programming
model for disruption in supply chain. Management Science Letters, 3(5), 1467-1478.
Webb, M. H. J. (1968). Cost functions in the location of depots for multiple-delivery