International Journal of Environmental Monitoring and Analysis
2013; 1(5): 230-236Published online October 30, 2013 (http://www.sciencepublishinggroup.com/j/ijema) doi: 10.11648/j.ijema.20130105.18
A framework for coupling land use and hydrological
modelling for management of ecosystem services
J. van der Kwast
1, S. Yalew
1, C. Dickens
2, L. Quayle
2, J. Reinhardt
3, S. Liersch
3, M. Mul
4,
M. Hamdard
1, W. Douven
11
UNESCO-IHE Institute for Water Education, Delft, the Netherlands 2
Institute of Natural Resources, Scottsville, South Africa 3
Potsdam Institute for Climate Impact Research (PIK), Potsdam, Germany 4
International Water Management Institute (IWMI), Ghana
Email address:
[email protected](J. van der Kwast), [email protected](S. Yalew), [email protected](C. Dickens), [email protected](L. Quayle), [email protected](J. Reinhardt), [email protected](S. Liersch), [email protected](M. Mul), [email protected](M. Hamdard), [email protected](W. Douven)
To cite this article:
J. van der Kwast, S. Yalew, C. Dickens, L. Quayle, J. Reinhardt, S. Liersch, M. Mul, M. Hamdard, W. Douven. A Framework for Coupling Land Use and Hydrological Modelling for Management of Ecosystem Services.International Journal of Environmental Monitoring and Analysis. Vol. 1, No. 5, 2013, pp. 230-236. doi: 10.11648/j.ijema.20130105.18
Abstract:
It is well known that land-use changes influence the hydrological cycle and that those changes in the hydrological cycle influence land use. The sophisticated spatial dynamic planning tools that have been developed in the last decades to support policy makers in the decision making process do not take into account the mutual feedbacks between land use and hydrology. In this study a framework for an integrated spatial decision support system is presented where the feedbacks between land use and hydrology are taken into account by coupling the SITE (Simulation of Terrestrial Environments) land-use model to the SWIM hydrological model. This framework enables policy makers to assess the impact of their planning scenarios on ecosystem services using a web-based tool that interactively presents trends in space and time of spatial indicators derived from both models. This approach is tested for the uThukela area, which is located along the northern areas of the Drakensberg Mountains which form the border between Lesotho and South Africa. The region is extremely important for its catchment-services as water derived from it is pumped into the Vaal River supplying water to the city of Johannesburg. Because of poor management of ecosystem services, less water is produced by the catchment more erratically, siltation levels are increasing and less carbon is retained in the soil. Biodiversity is threatened by grazing livestock, alien plants and other poor land management practices. In addition, overstocking, frequent burning and lack of soil protection measures have caused rill and gully erosion in areas of communal ownership where an overall management policy is lacking. The presented framework for a spatial integrated decision support system is currently being implemented and will be used by policy makers to assess policies developed for an Environmental Management Framework (EMF). Scenarios will be defined during stakeholder workshops. A prototype of the decision support system has been developed, but not all data necessary for modelling and calibration is yet available. From the analysis of land-use maps of 2005 and 2008 it was observed that forest and bush decreased, while settlements, subsistence farming, commercial farming and grassland increased.Keywords:
Integrated Water Resources Management, Spatial Planning, Land-Use Modelling, Ecosystem Services1. Introduction
Increasing recognition of the interdependencies between natural resources has prompted the need for integrated natural resources management. Spatial planning tools play an important role in providing information on these interdependencies and the outputs allow policy maker to
opt for prudent natural resource management strategies. Spatial planning tools such as ecosystem services maps,
multi-criteria analysis (MCA), land-use models,
hydrological models, etc., are used for different purposes and at different stages of the integrated natural (land and water) resource planning[1].
analyze the main issues at stake. These tools usually aim to identify management objectives, criteria and requirements, and develop the analytical framework. In subsequent steps in the planning process, problem-solving and decision-aiding tools, such as conflict maps, multi-criteria analysis and analytical hierarchy processes, are used for priority setting and optimisation, particularly in case of competing management objectives or criteria. In addition, negotiation support tools are aimed to facilitate and support stakeholder participation in the decision-making and planning process.
These tools, however, can only be used to assess part of the complexity of the system. Important feedbacks between different components of the system are often neglected leading to bias in the assessment procedures. Many examples in literature exist where hydrological models have been developed for flood forecasting, drought prediction and pollutant fluxes that do not take into account land-use changes (e.g.[2]). On the other hand land-use models are increasingly used by spatial planners to assess the effect of changes in socio-economic conditions on urbanization for the next decades, while neglecting the feedback between land use and hydrology [3, 4, 5, 6].
Multiple feedbacks between land use and hydrology, however,can be identified. A decrease in moisture availability for crops, for example, will decrease the yields and farmers will look for other means to make a living. Another example is that increased flooding frequency will increase economic loss in flood plains and change the land use in flood plains.
The sophisticated spatial dynamic planning tools that have been developed in the last decades do not take into account these mutual feedbacks between land use and hydrology. Coupling of models can be a solution. Development of integrated models, however,is complicated due to the different disciplines involved, different modelling approaches and differences in spatial and temporal scales[7, 8].
Another problem of integrated models is the presentation of outputs to the end users (e.g. policy makers). Due to the complicated nature of the models, end users need the outputs at a higher level of abstraction that fits with their world of decision making and planning, which is different from the scientific world.
This study presents a framework for an integrated spatial decision support system where the feedbacks between land use and hydrology are taken into account by coupling the a
land-use model, SITE (Simulation of Terrestrial
Environments[6]), to an ecohydrological model,
SWIM(Soil and Water Integrated Model [9]). This framework enables policy makers to assess the impact of their planning scenarios on ecosystem services using a web-based tool that interactively presents trends in space and time of spatial indicators derived from both models.
2. Study Area
This approach is tested for uThukela catchment, also
known as the Thukela Water Management Area (TWMA) in the province of KwaZulu-Natal, South Africa (Fig. Figure 1). The entire TWMA is contained in the uThukela District Municipality (UDM), which borders directly on Lesotho to the south-west. The UDM is one of ten District Municipalities in the Province and is approximately 11500 km². The UDM consists of five local Municipalities with the focus of the case study stretching across three of these namely, Indaka, Okhahlamba and Imbabazane, and one District Management Area (DMA) 23 (known as uKhahlamba-Drakensberg Park or World Heritage Site).
The uThukela District Municipality (UTDM) is predominately rural (Approx 70%), with three of its five Local Municipalities, being rural in nature[10]. Rural and urban settlements cover 3.5% of the land. Agriculture in terms of cultivated land makes up 13% of the land cover when combining commercial (7.9%) and subsistence agriculture(5.1%). The Municipality is characterised by socio-economic challenges such as a low revenue base, poorly maintained infrastructure and limited access to social and other services [10]. High levels of poverty, unemployment, shortage of skills, a lack of resources and low levels of education are also prevalent[10].
The people and environment in the uThukela catchment are therefore highly vulnerable to changes in policy and economic factors, biophysical processes and human-induced activities. The grassland ecosystem that dominates the uThukela catchment is rapidly degrading mainly due to
anthropogenic driven land transformation and
unsustainable land-use practices. Water is locally not a scarce resource, but its allocated is unevenly distributed. Water demand will continue to rise as the urban population and water-dependent industries increase, making the rural population and the upstream area of the catchment more vulnerable to excessive extraction of water. If the status quo is left unchanged, the catchment is at the interface of persistence in rural poverty and economic development, requiring a tighter balance of actions to simultaneously achieve economic growth and environmental sustainability.
232 J. van der Kwast et al.: A Framework for Coupling Land Use and Hydrological Modelling for Management of Ecosystem Services
Management Framework which will identify zones and associated management practices required, 5) Strategic Environmental Management Plan, which will describe the
plans and projects needed to move from present to a desired future state.
Figure 1: Location of the uThukela catchment. Source: DWAF [13]
The integrated modelling framework presented in this paper will be used to support the development of EMF phases 3 (Desired future state), 4 (Environmental Management Framework) and 5 (Strategic Environment Management Plan).
3. Methods
3.1. Conceptual Framework
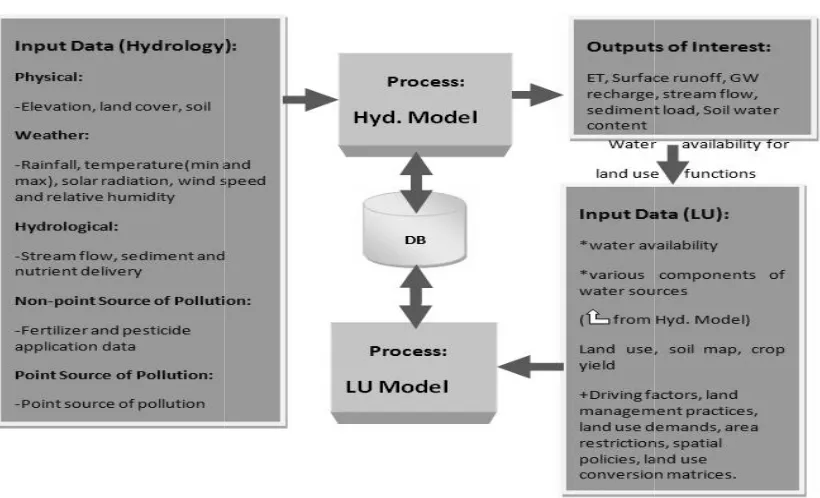
Figure 2 shows the conceptual framework of the proposed integrated spatial decision support system. First the main socio-economic drivers are defined in scenarios. Examples are combinations of changes in demography and employment. These can be combined with climate change scenarios. Furthermore the system needs input for the parameterization of the hydrological model and land-use model through bio-physical data and socio-economic data. The land use and hydrological model are run simultaneously, although they have a different temporal resolution. A coupling framework takes care of this. Dynamic data on water resources availability, biomass production and land use are exchanged between the models. The different outputs from both models are combined in a
GIS module that produces spatial indicators. The indicators are provided in an interactive way through a web interface. The policy maker is better able to analyse trends of different indicators or combinations of indicators than the raw model results. In this way the framework supports the decision making in the sense that a policy maker or planner can assess if the proposed management strategy results in the desired future state of the environment. If this is not the case, the scenarios can be adjusted and reassessed.
3.2. Model Coupling
The conceptual framework of this study is based on the theory that land use and water resources dynamically interact in a basin or a catchment, and that the change in location or magnitude of either land use or water resources, or their respective components affect the other. Furthermore, it works on the assumption that land use change is affected not only by environmental or biophysical components but also with various socio-economic factors, which makes the understanding of it rather complex.
socio-economic and biophysical constraints (including water resources availability) in the catchment. The water resources part of the input for the land
same time, are computed using the SWIM model
SWIM in return requires land use as its input, this value is
Figure 2: Conceptual framework of an integrated spatial decision support system
Figure 3: Concept of coupling of the land
economic and biophysical constraints (including water resources availability) in the catchment. The water rces part of the input for the land-use model, at the same time, are computed using the SWIM model [9]. Since SWIM in return requires land use as its input, this value is
provided to it from the SITE model. Dynamic linking/feedback between the two models results in a more realistic representation of the interaction between land use and water resources assessment.
of coupling the land-use model and the hydrological model.
Conceptual framework of an integrated spatial decision support system
Concept of coupling of the land-use model and the hydrological model
provided to it from the SITE model. Dynamic linking/feedback between the two models results in a more realistic representation of the interaction between land use er resources assessment.Figure 3 shows the concept use model and the hydrological model.
Conceptual framework of an integrated spatial decision support system
234 J. van der Kwast et al.: A Framework for Coupling Land Use and Hydrological Modelling for Management of Ecosystem Services
Model coupling is way of making two or more independent models exchange data at real-time, that is, on a time-step basis. The output of a time step from one model can, therefore, be an input to the other model in the next time step. The time steps setup for each of the models can be different: for land-use models, one time step is usually one year, whereas for hydrological models, one time step can be much smaller than one year.A scheduler in a coupling framework can deal with that [15].
Coupling can be achieved in two-ways: by loosely integrating the models using file-based systems (loose coupling), or by hardcoding the data exchange parameters inside the software tools (hard coupling). Data exchange through file-based system is often computation time intensive, especially if it involves large scale models. Direct and strong coupling, though it requires more technical skill for implementation, is faster during simulation. Source code modification on the models to be coupledis often a requirement. Strong coupling can also be
achieved through standardized model integration
frameworks such as the Open Modelling Interface (OpenMI) standard which allows time-dependent models to exchange data at run-time[16]. Strongly coupled models can be run simultaneously and share information at each time step, exchanging memory-based data in a predefined way and in a predefined format, rather than exchange it from data files. This method can be especially interesting because SWIM is already an OpenMI compliant model.
3.3. The SITE Model
The SITE land-use modelling framework has been developed over the past few years as a tool to simulate regional land-use dynamics and their impacts on environmental and socio-economic parameters. SITE has been applied in several studies in Europe, Central, South and South-East Asia[6, 12, 17, 18]. SITE currently uses the concept of cellular automata (CA) models which are defined as spatially and temporary discrete systems consisting of cells arranged in a lattice of n (>1) dimensions[18]. The cells represent a discrete moment in time which change their state via certain sets of rules, mostly deterministically formulated in a local transition function taking into account, among others, the current state of neighbouring cells[19].
Suitability of the land restricts the potential locations assigned by the cellular automata algorithm. Suitability is determined per land use and can be divided in biophysical suitability (e.g. elevation, terrain slope, soil fertility, precipitation) and suitability based on socio-economic factors, such as gross margins, accessibility and farmers’ preferences [6] and zoning by policy makers. It is obvious that a lot of GIS data is needed to produce the suitability maps for the model.
3.4. The SWIM Model
SWIM [9] simulates ecohydrological processes at the mesoscale such as runoff generation, nutrient and carbon cycling, river discharge, plant growth and crop yield, and erosion. A single model framework is used to simulate the processes, their relations and feedbacks at a regional scale. The amount of input data needed is limited making it a feasible model for many river basins or regions. The model simulates daily timesteps and the spatial support can be chosen: basin, subbasins or hydrotopes. For the coupling with the grid based SITE model the hydrotope output of SWIM will be matched with the SITE grid. More details on the SWIM model can be found in [9].
3.5. Spatial Indicators
The data provided by the SWIM and SITE will be integrated in a GIS module that calculates indicators that the end-user can use to assess the results. Examples of spatial indicators for assessment of the environment and ecosystem services can be found in Aspinal[20]and Pearson[21]. Furthermore, the Flemish Institute for Technological Research (VITO) has published a web-based indicator atlas (http://rma.vgt.vito.be/verkenner/index.jsf) showing the results of the Environment and Nature Outlook 2030 for Flanders (Belgium) in an interactive way including maps, map animations, graphs and descriptions. Using this tool it is also possible to evaluate alternative scenarios. Examples of indicators are: fragmentation of the landscape, cluster size of grassland with natural value, forest cohesion, etc. In order to be useful, the indicators need to be developed in close cooperation with the policy makers.
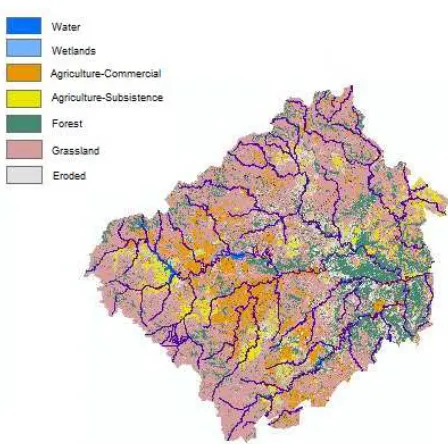
Figure 5: Observed land-use map of 2008. Source: Ezemvelo KZN Wildlife (2011)
4. Results and Discussion
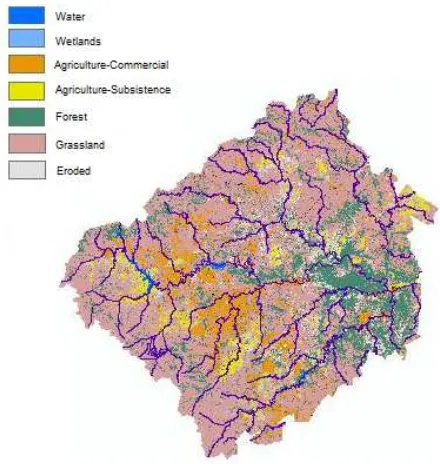
Based on limited data that was available, the SITE model was implemented with a grid resolution of 1 km and a total number of 11702 cells. Calibration, however, was not possible due to the small time period between the available maps (Figure 4 and 5). If the time period is too small, not enough land-use changes occur for a proper comparison with simulation results. The trends that were visible between 2005 and 2008 are a decrease in forest and bush, an increase in settlement, an increase in subsistence farming, a slight increase in commercial farming and an increase in grassland.
The main driver for land-use change is population growth (8.8% increase from 2001 to 2007). Due to increased needs for cattle overgrazing causes land degradation in the grasslands. Furthermore, in the culture the social status depends on the amount of cattle. In addition, the communal land tenure system causes a lack of the sense of ownership. Combined with changes in climate conditions the situation of the natural resources can worsen. The SWIM model is being prepared for coupling, and will be available soon. Prototypes of the GIS module for the calculation of spatial indicators and the web-based tool for visualisation of the indicators exist and are being further developed.
5. Conclusions and Recommendations
This paper presented a conceptual framework for an integrated spatial decision support system.This framework couples a land-use model with a hydrological model and exchanges data in both directions. In this way mutual feedbacks between the two models can be incorporated. Outputs from both models are processed in a GIS module
that calculates indicators that policy makers and planners can use to assess the impact of their decisions on ecosystem services.
Implementation of the framework is ongoing. The data requirements from the stakeholders have been defined and will be processed and implemented as soon as they become available. The SWIM model will also be available soon and will be connected to the framework. Workshops with policy makers and planners will be organised to discuss the needs for spatial indicators that can support the decision making. During these workshops also the scenarios for the EMF will be discussed.
Acknowledgements
The authors would like to thank the EU/FP7 AFROMAISON project for the financial support to this research.
References
[1] G. Arciniegas, R. Janssen, Spatial decision support for collaborative land use planning workshops, Landscape Urban Plan. 107 (2012) 332–342.
[2] J. E. Vermaat, S. Broekx, B. Van Eck, G. Engelen, F. Hellmann, J. L. De Kok, H. Van der Kwast, J. Maes, W. Salomons, W. Van Deursen, Nitrogen Source Apportionment for the Catchment, Estuary, and Adjacent Coastal Waters of the River Scheldt,Ecol. Soc. 17 (2012) art30.
[3] R. White, B. Straatman, G. Engelen, Planning scenario visualization and assessment: a cellular automata based integrated spatial decision support system, in:M. F. Goodchild, D. G. Janelle (Eds.), Spatially Integrated Social Science (Spatial Information Systems), Oxford University Press, Oxford, 2004, pp. 420–443.
[4] H. Van Delden, P. Luja, G. Engelen, Integration of multi-scale dynamic spatial models of socio-economic and physical processes for river basin management,Environ. Modell. Softw. 22 (2007) 223–238.
[5] G. Engelen, C. Lavalle, J. L. Barredo, M. van der Meulen, R. White, The MOLAND modelling framework for urban and regional land-use dynamics, in: E. Koomen, J. Stillwell, A. Balkema, H. J. Scholten (Eds.), Modelling land-use change progress and applications, Springer, Dordrecht, 2007, pp. 297–320.
[6] C. Schweitzer, J. A. Priess, S. Das, A generic framework for land-use modelling, Environ. Modell. Softw. 26 (2011) 1052–1055.
[7] R. M. Argent, An overview of model integration for environmental applications—components, frameworks and semantics, Environ Modell Softw. 19 (2004) 219–234.
[8] J. Hinkel, The PIAM approach to modular integrated assessment modelling, Environ Modell. Softw. 24 (2009) 739–748.
236 J. van der Kwast et al.: A Framework for Coupling Land Use and Hydrological Modelling for Management of Ecosystem Services
Ecol.Model. 106 (1998) 261–289.
[10] DSPED, UThukela District Municipality Integrated Development Plan (I.D.P.) Draft 2010/2011, Ladysmith, 2010.
[11] DEAT, Environmental Management Plans, Integrated Environmental Management, Pretoria, 1998.
[12] DAEA&RD, KwaZulu-Natal State of the Environment: Terrestrial Specialist Report, Pietermaritzburg, 2010.
[13] DWAF, Internal Strategic Perspective: Thukela Water Management Area, 2004.
[14] M. Mimler, J. Priess, Design and complementation of a generic modeling framework-a platform for integrated land use modeling. Kassel university press GmbH, Kassel, 2008.
[15] O. Schmitz, D. Karssenberg, K. de Jong, J. de Kok, Constructing integrated models: a scheduler to execute coupled components, Proceedings of the 14th AGILE conference, Utrecht, 2011.
[16] J. B. Gregersen, P. J. A. Gijsbers, S. J. P. Westen, OpenMI: Open modelling interface,J. Hydroinf. 9 (2007) 175–191.
[17] J. A. Priess, M. Mimler, A. Klein, S. Schwarze, T. Tscharntke, I. Steffan-Dewenter, Linking deforestation scenarios to pollination services and economic returns in coffee agroforestry systems, Ecol. Appl. 17 (2007) 407–417.
[18] J. A. Priess, C. Schweitzer, F. Wimmer, O. Batkhishig, M. Mimler, The consequences of land-use change and water demands in Central Mongolia, Land Use Policy28 (2011) 4– 10.
[19] J. Schiff, Cellular automata: a discrete view of the world. John Wiley & Sons, Hoboken, 2008.
[20] R. Aspinall, D. Pearson, Integrated geographical assessment of environmental condition in water catchments: Linking landscape ecology, environmental modelling and GIS, J. Environ. Manage. 59 (2000) 299–319.
![Figure 1: Location of the uThukela catchment. Source: DWAF [13]](https://thumb-us.123doks.com/thumbv2/123dok_us/8487592.1715634/3.595.111.501.118.453/figure-location-uthukela-catchment-source-dwaf.webp)