ISSN: 2231-5381
http://www.ijettjournal.org
Page 10Improved Brain Tumor Detection Using Object Based
Segmentation
Harneet Kaur1, Sukhwinder Kaur2
Electronics and Communication engineering, Rayat Institute of Engineering and Information Technology
ABSTRACT - This paper has focused on the brain tumor detection techniques. The brain tumor detection is a very important vision application in the medical field. This work has firstly presented a review on various well known techniques for automatic segmentation of heterogeneous image data that takes a step toward bridging the gap between bottom-up affinity-based segmentation methods and top-down generative model based approaches. The main objective of the work is to explore various techniques to detect brain tumor in an efficient way. It has been found that the most of existing methods has ignored the poor quality images like images with noise or poor brightness. Also the most of the existing work on tumor detection has neglected the use of object based segmentation. So to overcome the limitations of earlier work a new technique has been proposed in this research work. The technique has shown quite effective results than neural based tumor detection technique. The design and implementation of the proposed algorithm is done in MATLAB using image processing toolbox. The comparison has shown that the proposed technique has achieved up to 94 % accuracy which was 78 % in neural based technique. Also for high corrupted noisy images the proposed technique has shown quite effective results than the neural based tumor detection.
KEY WORDS: Brain Tumor, Segmentation, Object Detection, Neural Network.
1. INTRODUCTION
Image segmentation is the process of partitioning a digital image into multiple segments (sets of pixels, also known as superpixels). The aim of segmentation is to make simpler and/or modify the representation of an image into something that is more meaningful and easier to analyze. Image segmentation is normally used to place objects and boundaries (lines, curves, etc.) in images. More precisely, image segmentation is the method of conveying a label to each pixel in an image such that pixels with the similar label divide certain visual characteristics.
MRI Images of brain tumor cannot exactly denote the position of brain tumor, so to find the exact position of tumor in the
MRI image preprocessing, segmentation, morphological operation and subtraction are used. This gives the exact shape of the tumor in that MRI image and finally detection of brain tumor in MRI images is achieved.
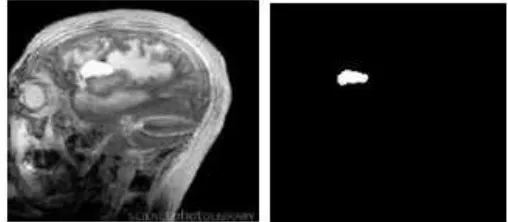
Fig. 1 left: original image, right: Segmented image
The outcome of image segmentation is a set of segments that jointly wrap the whole image, or a set of contours extracted from the image (see edge detection).All of the pixels in a area are comparable with respect to a few characteristic or computed property, such as color, intensity, or texture. Neighbouring areas are considerably dissimilar with respect to the similar characteristic(s). While useful to a heap of images, typical in medical imaging, the resultant contours following image segmentation can be used to generate 3D reconstructions with the help of exclamation algorithms like Marching cubes.
1.2BRAIN TUMOR
ISSN: 2231-5381
http://www.ijettjournal.org
Page 11located in other organs (metastatic tumors).Any brain tumor is inherently serious and life-threatening because of its invasive and infiltrative character in the limited space of the intracranial cavity. Though, brain tumors are not consistently incurable, particularly lipomas which are intrinsically kind.
Brain tumors or intracranial neoplasms can
be cancerous (wicked) or non-cancerous (incurable); though, the definitions of malignant or benign neoplasms differs from those generally used in other types of cancerous or non-cancerous neoplasms in the body. Its danger level depends on the grouping of factors like the form of tumor, its place, its dimension and its condition of growth. Since the brain is fine confined by the head, the early on discovery of a brain tumor occurs just while diagnostic equipment is focussed at the intracranial cavityMain brain tumors are usually situated in the posterior cranial fossa in children and in the frontal two-thirds of the cerebral hemispheres in adults, though they can influence any fraction of the brain. Visibility of cipher and symptoms of brain tumors mostly depends on two factors: the tumor dimension (quantity) and tumor place.
1.3 BRAIN TUMOUR TECHNIQUES: There are five main techniques for brain tumour detection as given follows:
1.3.1 Tumor detection using Active Contour: The technique is based on active contours evolving in time according to intrinsic geometric measures of the image. The developing contours naturally crack and combine, allowing the concurrent discovery of some objects and both interior and exterior limits. This approach is based on the relation between active contours and the computation of geodesics or minimal distance curves. This geodesic approach for object segmentation allows connecting classical “snakes” based on energy minimization and geometric active contours based on the theory of curve evolution. Experimental results of applying the method to actual images together with objects with holes and medical data imagery reveal its influence. The results may be extended to 3D object segmentation as well.
1.3.2 Based on Region Growing: Region growing is a simple region-based image segmentation method. It is too classified as a pixel-based image segmentation method as it involves the collection of original seed points. This approach to segmentation examines closest pixels of initial “seed points” and determines whether the pixel neighbours should be supplementary to the area. The method is iterated on, in the similar way as common data clustering algorithms.
The pixel value within the window having a minimum deviation from the mean is selected as the single initial seed for growing the car. The region is grown using the conventional region growing with the initial seed (xi, yi) computed.
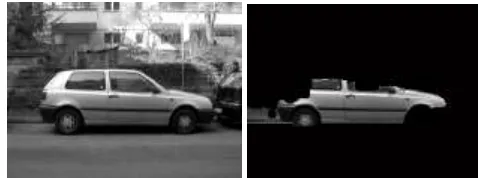
Fig 2.left: Original image, right: segmented image
Read the input image and convert it to gray. Consider a centre window w of size 20x20 which contains some parts of the object, in this case, the car. The difference between the median of the pixel values in the window and the mean pixel value is selected as the threshold. The pixel value within the window having a minimum deviation from the mean is selected as the single initial seed for growing the car. The region is grown using the conventional region growing algorithm with the initial seed (xi, yi) computed and threshold T determined. Find the nearest edge to each pixel in the grown region with the Canny edge detector being the popular choice for a robust, strong edge detector giving strong connected edges. The Euclidean distance norm is used to compute the nearest edge pixel for every pixel in the grown region. The set of nearest edge pixels for the region grown.
ISSN: 2231-5381
http://www.ijettjournal.org
Page 12If f (x, y) is an image, then the gradient vector magnitude and the angle at which maximum rate of change of intensity level occurs for the image can be computed using the following two equations.
√ ( )
Where g1(x, y)and g2(x, y)are the gradients in the x, y direction of the image. The magnitude of the gradient can be achieved by using sobel mask
Fig.3 left: original image, right: watershed segmented image From the above fig. it can be seen that the algorithm has performed well to detect the brain tumor. Tumor region can be detected effectively with the help of watershed algorithm, but after applying the canny operator the tumor portion is detected more accurately
1.3.4 Using neural network: Artificial neural networks (ANNs) are non-linear data driven self adaptive approach as opposed to the traditional model based methods. They are influential equipment for modeling, particularly while the fundamental data relationship is unknown. An extremely important characteristic of these networks is their adaptive character, where “learning by example” replaces “programming” in solving problems. This feature makes such computational models very appealing in application domains where one has little or incomplete understanding of the problem to be solved but where training data is readily available. The intensity, shape deformation, symmetry, and texture characters were extracted from every image. The AdaBoost classifier was used to choose the mainly discriminative character and to segment the tumor region. Multi-modal MR images with simulated tumor have been used as the ground truth for training and validation of the detection method.
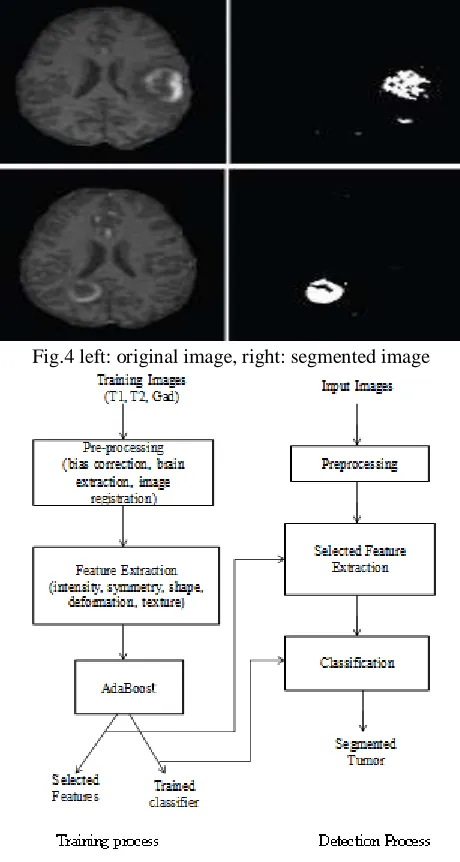
Fig.4 left: original image, right: segmented image
Figure 5: Block diagram of Automatic detection using neural network
The images were pre-processed as aforementioned and the four types of features were extracted from the images to be used as the training data set for the classification. A leave-one-out validation was performed on the images. The result of the tumor detection and the ground truth are shown in the above Figure.
Equation used by this technique is given as:
∑
( )
ISSN: 2231-5381
http://www.ijettjournal.org
Page 13behave as a blob detector. The size of the window, M, is calculated based on the Gabor filter frequency.
The workflow of this method is shown in the figure 5. Each MRI in the training set is first pre-processed to minimize the intensity bias and to remove the non-brain tissue. The preprocessing also includes multi-modality within-subject registration and co-registration to a standard template for cross subject comparison.
Next, four types of features (i.e., intensity, symmetry, shape deformation, and texture features) are extracted from the pre-processed images. Feature selection and fusion are performed using AdaBoost. For new subjects, only the selected features computed in the training process will be extracted and tumor will be detected using the trained classifier.
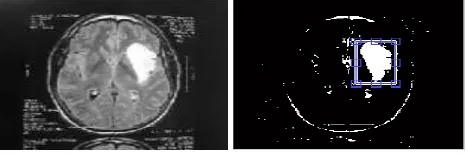
1.3.5Brain Tumor Detection and Segmentation Using Histogram Thresholding: The concept is based mainly on three points: (i) the symmetrical structure of the brain, (ii) pixel intensity of image and (ii) binary image conversion. It is a well known detail that human brain is regular about its central axis and all through it has been supposed that the tumor is moreover on the left or on the right side of the brain. MR image of the human brain can be divided into sub region such that white matter, gray matter, blood cells and cerebrospinal fluid can be easily detected. Tumor is nothing but the collection of blood cells at some specific point/s. The image of a brain in MRI is represented through pixel intensity. In gray color images the intensity lies between 0-255 with 0 indicating for black and 255 is assigned for the white color. The blood cells (RED color in RGB) are represented by white color and 255 pixel intensity. All the gray matter is having pixel intensity less than 255.
Figure 6: (a) Original Image (b) Cropped Image
Area of an image is the total number of the pixels present in the area which can be calculated by multiplying the number of pixels with the length of one pixel. To calculate the number of pixels in the cropped image the function Bwarea()is used. This function calculates the number pixels present in the image. A right click on the image and exploring the detail property will provide the following detail of the image:
Size of image, e.g., 600X400 Horizontal resolution, e.g., 96 dpi. Vertical resolution, e.g., 96 dpi
From the horizontal and vertical resolution one can find the dimension of a single pixel. The algorithm used is follows: There are 96 pixels in one inch. Hence vertical dimension of a pixel is 1/96 inch. Similarly horizontal dimension of a single pixel is 1/96 inch. Area of single pixel is equal to (1/96)*(1/96) square inch.
A = (1/96)*(1/96) Area of the tumor = A*total
The flowchart below depicts the stages of the work using Histogram Thresholding brain tumor detection.
2. LITERATURE SURVEY
Kharrat et al. (2009) [1] introduces an proficient detection of brain tumor from analytical MRI images. It consists of three steps: enhancement, segmentation and classification. To recover the superiority of images and bound the threat of different regions fusion in the segmentation phase an enhancement process is applied. Then Wavelet Transform is applied in the segmentation method to decompose MRI images. At very last, the k-means algorithm is implemented to take out the suspicious regions or tumors. Somasundaram and Kalaiselvi (2010) [2] described a method to sense the tumor from magnetic resonance imaging brain scans. Generally tumors reside in the normal tissues and their intensity characteristics vary from the neighboring normal tissues. At first it extracts the brain by removing the useless non-brain regions like skull, scalp, fat and muscles. After that the brain is segmented into well-known regions. In T2 scans the tumor intensity characteristics are parallel to CSF. Then this CSF class is analyzed for symmetric property along the middle vertical line. Bourouis and Hamrouni (2011) [3] described that specific demarcation of brain Tumor in MRI is a challenging problem due to the inconsistency of tumor geometry, appearance properties and the resemblance between tumor and normal tissue. Automating the method of segmentation is another challenge because manual segmentation is a mostly time-consuming task. Popuri et al. (2011) [4] described that
ISSN: 2231-5381
http://www.ijettjournal.org
Page 14automatic natural object segmentation technique. The salient object points are in use as the seeds of curved hull to produce the original contour for our automatic object Segmentation system.. Joung et al. (2012) [6] described that object recognition and segmentation method utilize an inpainting method. Inpainting is a concept of improving absent picture regions based on their environment, which were initially used for re-establishment of spoiled painting. By means of measuring the resemblance between the inpainted area and the original image area, this approachfilters out fake detections whereas maintaining right object detections. Susan et al. (2012) [7] explained that Region growing is a fine recognized technique for image segmentation. Though it suffers as of definite restrictions such as uncertainty about initial seed collection and threshold determination for region growing. The possibility of using region growing technique for segmenting out the foreground object and recommend to solve the damaged consequences by incorporate the adjacent edge information. Parisot et al. (2012) [8] explained that new technique for detection, segmentation and characterization of brain tumor. Towards most favourable use of prior information, a two layer organized graph is measured with one layer equivalent to the low-grade glioma type (description) and the next layer to voxel-based decisions of tumor occurrence. Han et al. (2012) [9] discussed that an object segmentation method to take out the identical object as of images that are captured from unlike views. By means of matting method, the target object easily segmented with effortless strokes given by a user to the preferred object and backdrop in the reference figure. After that, homography is predictable after keypoint matching between the segmented object image and the target image, which is acquired from a dissimilar point of view, containing the identical object. Bhattacharjee and Chakraborty (2012) [10] explained that algorithm is developed to trait out tumor from unhealthy brain Magnetic Resonance (MR) imagery. This is based on quality factor contrast of two filters, adaptive median filter is chosen for de-noising the imagery. Picture slicing and recognition of important planes are completed. It verifies the individual efficiency of the developed picture processing algorithm to identify brain tumor. Kenkre et al. (2012) [11] described that medicinal Image Processing is a difficult and demanding field these days. Processing of MRI imagery is one of the parts of this meadow. It proposes a policy for well-organized detection of a brain tumor in MRI brain imagery. The method consists of the following steps: preprocessing by means of sharpening and mean filters, improvement of picture is performed by histogram equalization, segmentation of the picture is performed by thresholding. Then it is followed by the additional application of morphological operations. At last the
tumor section can be obtained with the method of image subtraction. Kowar and Yadav (2012) [12] explained that the information of size of a tumor plays an vital role in the treatment of spiteful tumors. Manual segmentation of brain tumors as of Magnetic Resonance images is a demanding and time consuming job. This Li et al. (2012) [13] discussed that Automatic detection of brain tumor is a complex job due to variations in type, size, location and shape of tumors. In this, a multi-modality structure for automatic tumor detection is offered, fusing dissimilar Magnetic Resonance Imaging modalities including T1-weighted, T2-weighted, and T1 with gadolinium contrast agent. The amount, outline deformation, regularity, and consistency features were extracted from every picture. Dahab et al. (2012) [14] discussed that customized image segmentation techniques were applied on MRI scan images to sense brain tumors. A modified Probabilistic Neural Network (PNN) model based on learning vector quantization (LVQ) with picture and data examination and manipulation techniques is carried out an automated brain tumor categorization using MRI-scans. Kanimozhi and Dhanalakshmi (2013) [15] described that a simple algorithm for detecting the variety and outline of tumor in brain MR imagery is described. Normally, CT scan or MRI that is going to into intracranial cavity produces a entire image of brain. To keep away from that, it uses computer aided technique for segmentation (detection) of brain tumor based on the grouping of two algorithms. At the ending of the procedure the tumor is extracted from the MR image and its accurate location and the outline too determined. The period of the tumor is displayed based on the quantity of region calculated from the cluster.
3. Proposed algorithm
ISSN: 2231-5381
http://www.ijettjournal.org
Page 15ALGORITHM-1
Step 1: Read the input Brain image.
Step 2: Apply Decision based median filter. Using the algorithm 2
Step 3: Locate Brain
a = sum ( sum( L==i) ); if a>maxa,
maxa=a; maxi=i; end end
Step 4: Locate Centroid of brain using region properties
0,
−9
M = imrotate(l, 9 I = imrotate(I, 9 end
Step 5: Divide image into various segments. Step 6: Find largest segment using the following
equations
left x1 = 2* mid x-right x rightx1 = 2* mid x- left x left x = left x1
right x = right x1 isleft =1
end
Step 7: Apply bounding box on detected segment.
Step 8: End.
ALGORITHM-2
Step 1: Select image from computer memory into existing program and Read Noisy Image.
Step 2: Set initial window of size 3x3. Take centre pixel
of window as kernal. Where m=row, n=column, k=channel (k=1 for R, 2 for G, 3 for B) and P is the pixel. Step 3: If is an uncorrupted pixel (that is, 0< <255), then its value is not changed.
Step 4: If = 0 or 255, then is a corrupted pixel.
Step 5: If all pixels in the selected window are 0’s and 255’s, then replace with the median of the pixels in the window else go to step 6.
Step 6: Replace with the mean.
Step 7: Repeat steps 2-6 until all the pixels of whole image are processed.
Step 8: Apply gradient based smoothing to preserves edges in more efficient manner.
4. Experimental results
By taking different brain tumor images for experimental purpose we have seen the outcome of the existing and proposed approaches. It is revealed in the following figures why proposed algorithm is more beneficial over existing approach in case of noisy images. Figure 7 is showing the noisy input image. It is clearly shown that the visibility of the image is quite poor.
Figure 7: Input noisy Image
Figure 7 is showing the noisy input image. It is clearly shown that the visibility of the image is quite poor.
ISSN: 2231-5381
http://www.ijettjournal.org
Page 16Figure 8 shows the filtered image. It is clearly shown that the visibility of the Figure 8 is better than the image shown in figure 7.
Figure 9: output image by Ghanavati Figure 9 shows the output results given by Ghanavati.
Figure 10: Output image using proposed method Figure 10 demonstrates the output image using proposed method. It has better results than the existing approaches as shown in figure 9. Figure 10 shows the tumor using bounding box.
Table 1 is demonstrating the comparative study of the Peak Signal to Noise Ratio (PSNR). As PSNR require being maximized; thus the main goal is to increase the PSNR as much as possible. Table 1 has revealed that the PSNR is highest in the case of the proposed algorithm so proposed algorithm is providing better results than the existing methods
Table 1: PSNR
IMAGE NEURAL PROPOSED
1 7.1611 12.2577
2 7.4237 12.1246
3 7.5054 12.4245
4 8.7467 13.5689
5 9.3136 14. 0239
6 3. 0661 14.9459
7 0.7053 24.4572
8 2.6656 16.8081
9 3.2220 14.8582
10 0.8839 24.1741
Table 2 is showing the comparative study of Accuracy between the proposed and the existing technique. In the areas of science, engineering, industry, and statistics, the accuracy
of a measurement system is the degree of nearness of measurements of a quantity to that quantity's real (true) value. Accuracy is arithmetical measures of the performance of a binary classification test. Accuracy require to enlarge. Table 2 has shown that the new technique is better than the existing as the value is more in the proposed algorithm; so proposed algorithm has shown efficient result.
Table 2: ACCURACY
IMAGE NEURAL PROPOSED
1 0.5615 0.7562
2 0.5746 0.7524
3 0.5786 0.7608
4 0.6347 0.7903
5 0.6578 0.8010
6 0.2971 0.8211
7 0.780 0.9401
8 0.2643 0.8556
9 0.3099 0.8192
10 0. 0968 0.9382
Table 4 is showing the comparative study between the proposed and the available technique. It is necessary to decrease it. Table 4 has shown that the proposed technique has minimum BER than the available as the value is less in the proposed algorithm; so proposed algorithm has shown ad better results.
6. CONCLUSION AND FUTURE WORK
ISSN: 2231-5381
http://www.ijettjournal.org
Page 17the proposed algorithm is done in MATLAB using image processing toolbox. The comparison has shown that the proposed technique has achieved up to 94 % accuracy which was 78 % in neural based technique. Also for high corrupted noisy images the proposed technique has shown quite effective results than the neural based tumor detection. Even in certain cases neural based tumor detection fails for highly corrupted noisy images. In near future we will propose a new improved brain tumor detection approach which will improve the accuracy of tumor detection techniques further using fuzzy-neurone techniques.
REFERENCES
[1] M. Hrebién, P. Stéc, T. Nieczkowski and A. Obuchowicz. "Segmentation of breast cancer fine needle biopsy cytological images". International Journal of Applied Mathematics and Computer Science, 2008, Vol.18, No.2, 159–170, 2008.
[2] M.B. Cuadra, C. Pollo, A. Bardera, O. Cuisenaire, J. Villemure and P. Thiran, “Atlas Based Segmentation of Pathological MR Brain Images using a Model of Lesion Growth”, IEEE Trans. in Medical Imaging, vol. 23, no. 10, pp. 1301–1313, 2004.
[3] Y. Zhang, M. Brady, S. Smith, Segmentation of brain MR images through a hidden markov random field model and the expectation-maximization algorithm, IEEE Transactions on Medical Imaging Vol. 20 (2001) 45–57. http.dx.doi.org/10.1109/42.906424.
[4] Archip N, Jolesz F, Warfield S (2007) A validation framework for brain
tumor segmentation. AcadRadiol 14(10):1242–1251.
[5] V. Caselles, R. Kimmel, and G. Sapiro. Geodesic active contours, International Journal of Computer Vision, 22:61–79, 1997.
[6] T. Matsuyama and N. Ukita, Real-time multi-target tracking by a cooperative distributed vision system, Proc. IEEE, 2002.
[7] Ehquierdo and M.Ghanbari, “Nonlinear Gaussian filtering approach for object Segmentation,” IEE Pmc.-yls. Image Signal Process, Vol. 146, No. 3, June 1999.
[8] M. Cuadra, C. Pollo, A. Bardera, O. Cuisenaire, J. Villemure, and J.-P. Thiran. Atlas-based segmentation of pathological mr brain images using a model of lesion growth. IEEE Transactions on Medical Imaging, 23(10):1301–1314, 2004.
[9] K. T. Ng, Z. Y. Zhu, and S. C. Chan, “An approach to 2D-to-3D conversion for multiview displays,” in Proc. 2009 7th Int. Conf. Information, Communications and Signal Processing, pp. 1–5, Macau, China, Dec. 2009.
[10] R. Ratan and S. Sharma, “Brain Tumor Detection based on Multiparameter MRI Image Analysis” , ICGST-GVIP Journal, ISSN 1687-398X, Volume (9), Issue (III), June 2009.
[11] Rajesh C. Patil, Dr. A. S. Bhalchandra, “Brain Tumour Extraction from MRI Images”, International Journal of Electronics, Communication & Soft Computing Science and Engineering, ISSN: 2277-9477, Volume 2, Issue 1, April 2012.
[12] Mohammad ShajibKhadem, “MRI Brain image segmentation using graph cuts”, Master of Science Thesis in Communication Engineering, Department of Signals and Systems, Chalmers University Of Technology, Goteborg, Sweden, 2010.
[13] S. Koompairojn, A. Petkova, K. A. Hua, and P. Metarugcheep, “Semi-automatic segmentation and volume determination of brain mass-like lesion,” IEEE Symposium on Computer-Based Medical Systems, pp. 35–40, 2008.
[14] American Brain Tumor Association. (2010). Facts and statistics, 2010.
Retrieved from
http://www.abta.org/sitefiles/pdflibrary/ABTAFactsandStatistics2010. [15] A.R.Kavitha, Dr.C.Chellamuthu, Ms.KavinRupa, “An Efficient