R E S E A R C H A R T I C L E
Open Access
Digital technologies in resource
constrained higher institutions of learning: a
study on students’ acceptance and usability
Fiona P. Tulinayo
1*, Peter Ssentume
1and Rovincer Najjuma
2*Correspondence: [email protected] 1College of Computing and Information Sciences, Makerere University, Kampala, Uganda Full list of author information is available at the end of the article
Abstract
Digital technologies offer opportunities that facilitate blended, on-line and mobile learning. However, little is known regarding their usability and acceptance in resource constrained higher institutions of learning. The purpose of this study therefore is to contribute to the growing evidence on the use and acceptance of digital technologies in a blended learning context. The Technology Acceptance Model (TAM) is applied in this investigation. Results were obtained by descriptive, correlation and regression analysis, using data collected from a sample of 341 students doing their undergraduate programs. Findings confirm the original TAM’s constructs and embedded in the external constructs are; students’ access, students’ awareness, student capacity and lecturer characteristics. From this, a model is derived. Findings have led to relevant theoretical and practical implications.
Keywords: Technology acceptance model, Student’s usability and acceptance, Digital technologies, Resource constrained institutions of learning
Introduction
Digital technologies denote a wide range of technologies, tools, services and applica-tions using various types of hardware and software (Rice2003). They facilitate services or activities by electronic means to create, store, process, transmit and display information. Broadly, digital technologies include the use of personal computers, digital television, radio, mobile phones, robots etc. (Vuorikari et al. 2016) (Rice 2003). When coupled with learner centered instructions, the use of digital technologies is claimed to improve learning (Motiwalla 2007; Palloff and Pratt 2002). In East Africa, the significance of digital technologies to enhance blended, online and mobile learning cannot be over-stated (Mtebe 2014; Unwin et al. 2010). Digital technology solutions are believed to have the potential to widen access, reduce costs, and improve the quality of education (Andersson and Grönlund2009; Unwin et al.2010; Bolu and Egbo2014). Moya et al., notes that the use of digital technologies improves the quality of teaching and learning, efficacy and accessibility (Moya et al.2011). However, the adoption of digital technolo-gies in resource constrained higher institutions of learning still remains a challenge (Stantchev et al.2014).
In education, digital technologies pave ways for new pedagogical approaches, where students are expected to play a more active role than before (Beebe2004), thus focusing on the crucial issues of how people communicate and learn in an electronic environment. Digital technologies in higher institutions of learning are used for developing course material; delivering and sharing content; communication between learners, lecturers and the outside world; creation and delivery of presentation and lectures; academic research; administrative support, student enrollment (Rumanyika and Galan2015). Teaching and learning approaches (e-learning, blended learning, and mobile learning) that use digital technologies improve the teaching and learning process and can potentially lead to better students learning outcomes (Moya et al.2011). Regardless of these benefits, the degree of uptake and usage is low (Lwoga2012; Ssekakubo et al. 2011; Unwin et al.2010). A complex system of factors interrelate to create barriers to adoption including, high cost involved, socioeconomic and technological conditions, lack of a systematic approach to teaching and learning, awareness and attitudes towards digital technologies, administra-tive and technical support, staff development, limited infrastructure and little expertise in the use of digital technology tools (Oye et al.2011). One of the most dominant the-ory in the field of digital technologies and the most widely-used model for determining technology acceptance is the Technology Acceptance Model (TAM) (Lee et al.2003; Park
2009). TAM aims at determining the barriers and enablers to the adoption of new tech-nologies in a particular domain (Al Nahian Riyadh et al.2009). The validity of TAM has been proven empirically in many previous studies (Stantchev et al.2014). In this paper, we use the TAM to explore student’s usability and acceptance of digital technologies in resource constrained higher institutions of learning.
The remainder of this paper is structured as follows: in Section Background we present the background of the study; SectionRelated worksare related works; Section
Research approach is the research approach, and data collection. In Subsection
Data collection and analysisdata is analyzed and results presented in Section Results. In Section Discussion we discuss research findings and finally draw conclusions in SectionConclusion and further works.
Background
Higher education is key to modernization and development. In 1970, the enrollment rates for higher institutions of learning in Sub-Saharan Africa were among the lowest in the world, but over the last 40 years, they have ascended from less than 200,000 students to 4.5 million in 2008 and around 10 million (Hayward and Ncayiyana2014). For about four decades, enrollment grew on average of 8.6% annually. Every 8 years, enrollment doubles (Bruneforth2010). For Uganda, until 1987 there was one public Uni-versity with approximately 10,000 students. In the 1990s, public private partnerships (PPPs) were introduced with a hope of improving the provision of services, quality and accessibility of higher education. Despite the existence of PPPs, the quality and accessi-bility of higher education continued to fall short of stakeholders’ expectations (Kasenene
over 300,000 students (Okwakol2009). Over the years, the ratio between lecturers and students has tremendously increased thus, a need for institutions to consider ways to meet students’ needs (Friesenhahn2016). Adoption of digital technologies for teaching and learning could potentially address the needs of the increasing students’ enrollment ratios.
TAM is an evolution of the Theory of Reasoned Action (TRA) (Ajzen and Fishbein
1980). TAM was originally developed to test the acceptance of word-processor technol-ogy (Davis et al.1989). Over the years it has been applied to different domains. Davis in his thesis, proposed user motivation as a major construct in explaining and predicting system use (Davis et al.1989). He further posits three key factors that can be used to explain user motivation i.e. Perceived Usefulness (PU), Perceived Ease Of Use (PEOU) and Attitude towards use (Chuttur2009). Perceived usefulness is referred to as “the degree to which an individual believes that using a particular system would enhance his/her productivity”, and perceived ease of use, also referred to as “the degree to which an individual believes that using a particular system would be free of effort” (Davis et al.1989). The user’s atti-tude towards the system determines whether he/she will use or reject the system and the attitude of the user is considered to be influenced by Perceived Usefulness and Per-ceived Ease Of Use (Chuttur2009). TAM and TRA explore how these two key factors (Perceived Usefulness and Perceived Ease of Use) affect user’s behavioral intention to use a system and suggest a connection between them (Chang and Zhu2012; Oye et al.2011). PEOU has a causal effect on PU, since PU has a direct effect on attitudes towards use and behavior intention, this in turn affects the actual system adoption and use (Tselios et al.
2011; Chang and Zhu2012). In conclusion, TAM suggests that perceived usefulness will be influenced by perceived ease of use because the easier a technology is to use, the more useful it will be (Park2009).
Related works
There are a number of digital technologies used in higher institutions of learning i.e. video conferencing, teleworking, distance learning (Moore et al.2011; Moore and Kearsley2011), mobile learning (Gikas and Grant2013), E-learning (Moore et al.2011; Njenga and Fourie 2010; Laurillard 2005), Massive Open Online Courses (MOOCs) (Ng’ambi and Bozalek2015), Blended learning (Porter et al.2014; Garrison and Kanuka
In literature, the Technology and Acceptance Model (TAM) has been extended by var-ious scholars: e.g. (Alharbi and Drew2014; Fathema et al.2015) uses TAM to examine the use of learning management systems (LMS); (Š¯upulniece et al. 2013; Sternad and Bobek2013; Shih et al.2009; Govindaraju and Indriany2007; Amoako-Gyampah2007) study the impacts, behavioral intention usage and implementation of enterprise resource planning (ERP); (Wang et al.2003; Lai and Li2005; Stantchev et al.2014) study technol-ogy acceptance in Internet banking; (Al Nahian Riyadh et al.2009) (Holden and Karsh
2010) evaluate information technology acceptance in health and (Park2009; Teo2011) analyze students’ technology intention to use and acceptance in education. From this review, we note that too little is known of studies investigating the acceptance and use of digital technologies in resource constrained higher institutions of learning. Therefore, additional research studies are required to determine if low adoption problems of digital technologies are caused by usability problems (Š¯upulniece et al.2013). The digital tech-nology adoption failure emphasizes the need for research on the usability and acceptance of digital technology tools and systems.
In this paper, it is argued that usability of digital technologies has not been fully tested, evaluated or enhanced and that there is scope, need, and urgency to revise the way we examine usability, at least in terms of use of digital technologies to support the teaching and learning processes. This study therefore contributes new evidence to earlier stud-ies such as (Garaˇca2011; Shih et al.2009), applying TAM to study factors that influence students’ usability and acceptance of digital technologies in resource constrained higher institutions of learning implementing blended learning. Earlier studies have shown links between PU and PEOU (Agrifoglio and Metallo2010; Escobar-Rodríguez and Bartual-Sopena2015), yet some researchers ignored this relation (Ali et al. 2013; Al-Jabri and Roztocki2015; Garaˇca2011). Several TAM applying studies have proposed variables that influence acceptance and usability of digital technologies. These studies have focused on internal management practices, such as training (Amoako-Gyampah and Salam2004; Lee et al. 2010; Scholtz et al. 2016) and management support (Shih et al. 2009), sys-tem capability and learnability (Calisir and Calisir2004), cognitive factors (Hwang2011; Sternad and Bobek2013). In (Shih et al.2009) a positive relationship between self-efficacy (SE) and PEOU was observed. However, (Hwang2011) indicates that the differences in their findings on the impact of SE on PEOU may be due to cultural differences. It is argued in (Hwang2011) that power distance is a dimension of culture and can be a barrier to SE since it had a significantly negative impact on SE. Two major limitations of TAM have been cited to include, TAM inability to reveal determinants of the perceived usefulness and perceived ease of use variables (Bagozzi2007; Chuttur2009), and that TAM focuses on information systems that have been deployed in voluntary environments, with little consideration for mandatory-use settings (Chuttur2009). This study applies TAM in a professional voluntary but evolving user setting working towards mandatory use of digital technologies.
Research approach
on understanding the dynamics present within a single setting (Eisenhardt1989), and to understand them within a particular context (Yin2009)
Data collection and analysis
The study used a structured questionnaire with both close and open-ended questions. The questionnaire was designed to address the factors that influence students’ digital technology use and acceptance. The questionnaire comprised of five sections. Section 1, was for demographic characteristics; section 2(a) frequency of use of the listed digi-tal technologies in learning, section 2(b) how the listed digidigi-tal technologies are used to facilitate learning, section 2(c) identified other alternative digital technologies used in learning; section 3(a) sought students’ experience and support in using digital gies, section 3(b) explored challenges that students face when using digital technolo-gies, section 3(c) investigated whether digital technologies improve students’ learning; section 4(a) determined what the university should do to facilitate students’ use of digi-tal technologies, and section 4(b) sought suggestions on what the university should do to facilitate students’ use of digital technologies. Lastly, section 5 was designed to integrate the resulting factors from sections 1 up to 4 with Davis et al’s (Davis et al.1989) Technol-ogy Acceptance Model. Thus, digital technologies use and acceptance model for resource constrained higher institutions of learning. In this last section, each subsection was a mea-sure of a variable i.e. perceived ease of use, perceived usefulness, attitude towards usage, intention to use, students’ capacity to use digital technologies, students’ access to digital technologies, students’ awareness of use of digital technologies, lecturer characteristics and later on determining the relationship among the variables as presented in table one.
Questionnaire reliability
A pretest was conducted from Makerere University using a sample of 50 students to get results which were both used for reliability and validity. In (Perneger et al.2015), it is noted that, in order to yield meaningful results from a pretest, a minimum total sample size of 30 respondents is recommended.
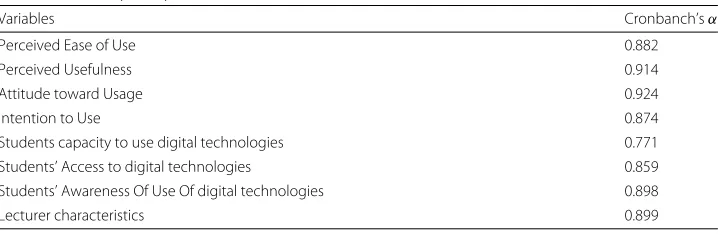
Internal consistency/reliability was examined using Cronbach’sα values. In (Allison
2012) it is posited that an instrument is regarded reliable if the Cronbach alpha coefficient is greater than 0.5. From the results obtained in Table1, all constructs showed Cron-bachαvalues greater than 0.75, significantly higher than the threshold value of 0.5. This implies that all constructs exhibited a high internal consistency with their corresponding measurement indicators.
Table 1Reliability Analysis (coefficients)
Variables Cronbanch’sα
Perceived Ease of Use 0.882
Perceived Usefulness 0.914
Attitude toward Usage 0.924
Intention to Use 0.874
Students capacity to use digital technologies 0.771
Students’ Access to digital technologies 0.859
Students’ Awareness Of Use Of digital technologies 0.898
Study population
ICT is a multidisciplinary field (Avgerou2010) thus its use and acceptability was mea-sured based on different courses within two top public higher institutions of learning in Uganda (Makerere and Kyambogo). The total population size consisted of 3000 undergraduate students (n = 3000), 1765 students were from the faculty of Education (Bachelor’s degree in education) (58.83%), 706 students were from the faculty of sci-ence (Bachelor of information technology and computing, Bachelor of scisci-ence technology physics, Bachelor of science technology chemistry, Bachelor of science in textile and Bach-elors of food processing technology) (23.53%) and 529 students were from the faculty of Arts with social science (Bachelor of arts and social science) (17.63%). Using Krejcie and Morgan’s sample size determination table (Krejcie and Morgan1970) for a total popula-tion of 3000 a sample size of 341 respondents yield meaningful results. Therefore, using proportionate sampling, 200 students were selected from faculty of Education, 81 from faculty of Science and 60 students from faculty of Arts and Social Sciences.
Data analysis
In order to explore the models and theories of technology acceptance, document review was done. Comparisons were also made to determine the underpinning factors of the Davis et al’s technology acceptance model (Davis et al. 1989). Responses from the questionnaire were processed and analyzed descriptively to obtain factors influencing students’ use and acceptance of digital technologies. Explanatorily, the model design was done by combining the factors that were obtained from the descriptive analysis and document review by correlation and regression to establish causal relationship among them.
Results
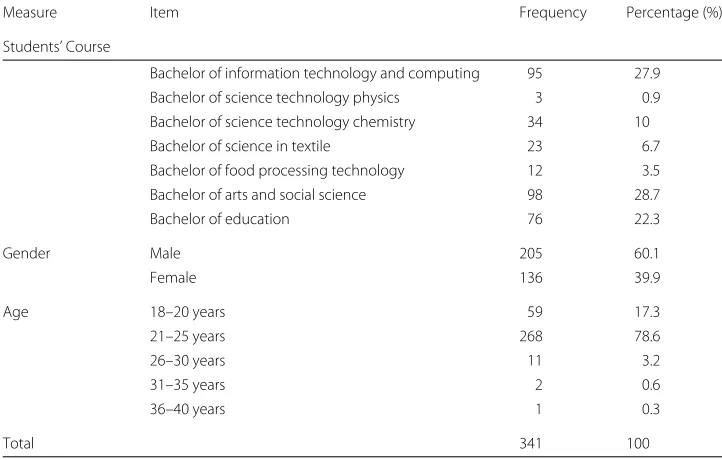
Demographic characteristics in Table2 indicate that, out of 341 respondents, 27.9% of respondents were from Bachelor of information technology and computing, 0.9% were
Table 2Descriptive statistics of the respondents’ characteristics
Measure Item Frequency Percentage (%)
Students’ Course
Bachelor of information technology and computing 95 27.9
Bachelor of science technology physics 3 0.9
Bachelor of science technology chemistry 34 10
Bachelor of science in textile 23 6.7
Bachelor of food processing technology 12 3.5
Bachelor of arts and social science 98 28.7
Bachelor of education 76 22.3
Gender Male 205 60.1
Female 136 39.9
Age 18–20 years 59 17.3
21–25 years 268 78.6
26–30 years 11 3.2
31–35 years 2 0.6
36–40 years 1 0.3
from Bachelor of science technology physics, 10% from Bachelor of science technology chemistry, 6.7% from Bachelor of science in textile, 3.5% from Bachelors of food pro-cessing technology, 28.7% from Bachelor of arts and social science and 22.3% were from Bachelor’s degree in education. Thus the majority of the respondents were from Bachelor of Arts with social sciences and the least number of respondents were from Bachelor of Science technology physics.
The gender composition of respondents was 60.1% male and 39.9% female. The age of respondents indicated that 17.3% of the respondents were aged between 18 and 20 years, 78.6% indicated between 21 and 25 years, 3.2% indicated between 26 and 30 years, 0.6% indicated between 31 and 35 years while 0.3% indicate 36-40 years old. There-fore, majority of the respondents were aged between 21 and 25 years exhibiting a young population.
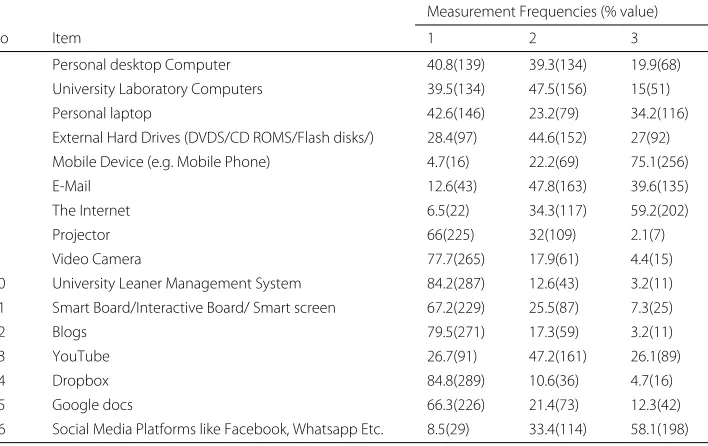
Computer and mobile devices:from the results in Table3, it is notable that 40.8% of the students never use personal desktop computers, 39.3% sometimes use them and 19.9% use them always (regularly) in their studies. This implies that a few students have access to personal computers and a great percentage do not own computers. 39.5% of the stu-dents never use university computer laboratories, 47.5% use them sometimes and 15% of the students use them always. Often students use university computer laboratories during practical lectures. This implies that students have little access to computer labora-tories mostly because their lecturers do not require use of computer laboralabora-tories during their teaching. Results also indicate that 42.6% of students never use personal laptops, 23.2% use them sometimes and 34.0% use them always. This affirms that few students own personal laptops. 27% of the students always use External Hard Drives (DVDS/CD ROMS/Flash disks), 44.6% use them sometimes and 28.4% never use them. Thus, limited students’ use of these devices. Results also indicate that 4.7% of students never use mobile devices for their learning, 22.2% sometimes use them and 75.1% use them always. This exhibits a high usage and acceptance of mobile devices by the students.
Table 3Frequency of use of different digital technologies for learning
Measurement Frequencies (% value)
No Item 1 2 3
1 Personal desktop Computer 40.8(139) 39.3(134) 19.9(68)
2 University Laboratory Computers 39.5(134) 47.5(156) 15(51)
3 Personal laptop 42.6(146) 23.2(79) 34.2(116)
4 External Hard Drives (DVDS/CD ROMS/Flash disks/) 28.4(97) 44.6(152) 27(92)
5 Mobile Device (e.g. Mobile Phone) 4.7(16) 22.2(69) 75.1(256)
6 E-Mail 12.6(43) 47.8(163) 39.6(135)
7 The Internet 6.5(22) 34.3(117) 59.2(202)
8 Projector 66(225) 32(109) 2.1(7)
9 Video Camera 77.7(265) 17.9(61) 4.4(15)
10 University Leaner Management System 84.2(287) 12.6(43) 3.2(11)
11 Smart Board/Interactive Board/ Smart screen 67.2(229) 25.5(87) 7.3(25)
12 Blogs 79.5(271) 17.3(59) 3.2(11)
13 YouTube 26.7(91) 47.2(161) 26.1(89)
14 Dropbox 84.8(289) 10.6(36) 4.7(16)
15 Google docs 66.3(226) 21.4(73) 12.3(42)
16 Social Media Platforms like Facebook, Whatsapp Etc. 8.5(29) 33.4(114) 58.1(198)
Internet and email:results show that 6.5% of students never use Internet in their learn-ing, 34.3% use it sometimes and 59.2% use it always. This implies that most students have knowledge of how to use Internet in their learning. It was also indicated that 12.6% of the students have never used e-mails in their learning process, 47.8% sometimes use them and 39.6% use them always. Therefore, lecturers should increase their use of e-mails when communicating with students.
Interactive learning tools:results further indicate that 66% of the students never use power point projectors during their studies, 32% use them and 2% use them always. This affirms that there is less use of basic digital technologies in the university. It was also noted that 77.7% of the students never used a video camera, 17.9% use it some-times and 4.4% use them always. This implies that a great number of students do not use video cameras. This is complicated by limited access to video cameras, lack of knowl-edge on how to use them and assimilate them in their learning. In terms of use of the University Learning Management System (LMS), students were asked their frequency of use of this system. Results indicated that 84.2% of the students have never used it, 12.6% of the students use it sometimes and 3.2% of the students use it always. This is due to a number of reason such as; the LMS was not properly introduced to students hence limiting its use; lecturers’ limited integration of the LMS into students’ teaching and learning thus no need for students to use the LMS; lack of awareness; complexities involved when using the LMS etc. Results further indicate that 67.2% of the students have never used Smart Board/Interactive Board/Smart screen, 25.5% use them sometimes and 7.3% use them always. These results are twofold, either lecture rooms do not have smart boards/interactive boards/smart screens installed or lecturers have limited knowledge on how to use them. To improve students’ usability and acceptance of these technologies, the university should develop pedagogical digital competences for lecturers, train students and equip the learning facilities.
Cloud-based service tools:This research focused on cloud-based service tools like Drop-box, Google docs, YouTube, and blogs. From Table3, results on students’ frequency of use of blogs depict that 79.5% of the students have never used blogs in their learning, 17.3% use them and 3.2% use them always. Thus of the 59.2% of students who use/access Inter-net, a small percentage have knowledge and skills on how to use blogs. Results further indicate that 26.7% of the students never use YouTube, 47.2% use it sometimes and 26.1% use it always. This is an indication that a few of these students are aware of what/how YouTube can contribute to their learning. It was also depicted that 84.8% of the students have never used Dropbox, 10.5% use it sometimes and only 4.7% use it always. This means that awareness and capacity to use this tool is poor among students. Google docs was also among the tools that was subjected to students, to know whether they use it. It was realized that 66.3% of the students never used Google docs, 21.4% use it sometimes and 12.3% of the students use it always. These statistics show that few students have knowl-edge of these tools and have the capacity to use them. Thus cloud-based service tools are underutilized to support teaching and learning.
never use them in their learning process. This indicates that a good number of students appreciate the importance of social media in supporting their learning.
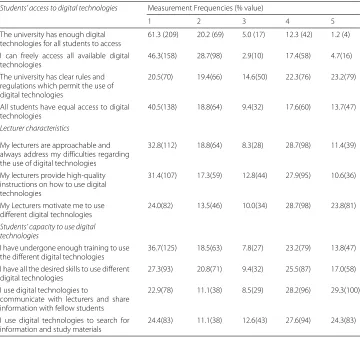
Students’ access to digital technologies:from Table4, results show that students have less access to digital technologies i.e. 81.5% did not agree that the university has enough digi-tal technologies for all students to access, 5% neither agreed nor disagreed and 13.5% said the university had enough digital technologies for them to access. 22.1% agreed that they can freely access all the available digital technologies whereas 2.9% neither agreed nor disagreed and 75.0% disagreed. The university has clear rules and regulations which per-mit the use of digital technologies, this was supported by only 45.5% of the respondents, 14.6% neither agreed nor disagreed and 39.9% disagreed. When asked if all students have equal access to digital technologies, 31.3% agreed, 9.4% neither agreed nor disagreed and 59.3% did not agree with the statement. This implies that the criterion for students access to digital technologies is a lopsided
Lecturer characteristics:when students were asked if lecturers use digital technologies to deliver lectures, 43.7% agreed that their lecturers use different digital technologies to deliver lectures, 6.2% neither agreed nor disagreed and 50.1% did not agree. This shows that the number of lecturers using digital technologies is still low this in turn affects the students’ use of these digital technologies. 40.1% responded that their lectures are
Table 4Students experience and support in using and accessing digital technologies
Students’ access to digital technologies Measurement Frequencies (% value)
1 2 3 4 5
The university has enough digital technologies for all students to access
61.3 (209) 20.2 (69) 5.0 (17) 12.3 (42) 1.2 (4)
I can freely access all available digital technologies
46.3(158) 28.7(98) 2.9(10) 17.4(58) 4.7(16)
The university has clear rules and regulations which permit the use of digital technologies
20.5(70) 19.4(66) 14.6(50) 22.3(76) 23.2(79)
All students have equal access to digital technologies
40.5(138) 18.8(64) 9.4(32) 17.6(60) 13.7(47)
Lecturer characteristics
My lecturers are approachable and always address my difficulties regarding the use of digital technologies
32.8(112) 18.8(64) 8.3(28) 28.7(98) 11.4(39)
My lecturers provide high-quality instructions on how to use digital technologies
31.4(107) 17.3(59) 12.8(44) 27.9(95) 10.6(36)
My Lecturers motivate me to use different digital technologies
24.0(82) 13.5(46) 10.0(34) 28.7(98) 23.8(81)
Students’ capacity to use digital technologies
I have undergone enough training to use the different digital technologies
36.7(125) 18.5(63) 7.8(27) 23.2(79) 13.8(47)
I have all the desired skills to use different digital technologies
27.3(93) 20.8(71) 9.4(32) 25.5(87) 17.0(58)
I use digital technologies to
communicate with lecturers and share information with fellow students
22.9(78) 11.1(38) 8.5(29) 28.2(96) 29.3(100)
I use digital technologies to search for information and study materials
24.4(83) 11.1(38) 12.6(43) 27.6(94) 24.3(83)
approachable and always solve their problems regarding the use of digital technologies, 8.3% neither agreed nor disagreed to that and 51.6% did not agree. This implies that stu-dents’ consultation on the use of digital technologies from their lecturers is limited. When asked whether their lecturers provide high-quality instructions to use digital technolo-gies, 38.5% agreed with this statement, 12.8% neither agreed nor disagreed and the 48.7% did not agree. This affirms that few lecturers have the ability to guide their students to productively use digital technologies in their learning process. When asked whether their lecturers motivate them to use different digital technologies, 52.5% responded that their lecturers motivate them, 10% neither agreed nor disagreed to the statement and 37.5% did not agree. Implying that a few of the lecturers are playing their role as far as the accep-tance and usage of digital technologies is concerned in teaching and learning. From the results, it is evident that lecturers have a minimal contribution to students’ digital technol-ogy usability and acceptance. Yet, they are critical in promoting acceptance and usability of digital technology integrations in teaching and learning.
Forstudents’ capacity to use digital technologies, 37% indicated that they had undergone enough training to use the different available digital technologies, 7.8% neither agreed nor disagreed to the statement, and 55.2% had never gone through any training. This is an indication that students’ failure to accept and use digital technologies is partly hindered by their lack of knowledge on how to use them. When asked whether they had all the desired skills to use the different digital technologies, 42.5% agreed, 9.4% neither agreed nor disagreed and 48.1% disagreed. Thus majority of the students don’t have the capacity to use digital technologies. When asked if they use digital technologies to communicate and share information, 57.5% of the respondents said that they use digital technologies to communicate with their lecturers and share information with fellow students, 8.5% nei-ther agreed nor disagreed and 34.0% didn’t agree. This is an indication that the use of digital technology as a communication tool among students and lecturers is not maxi-mized. 51.9% use digital technologies to search for information and study materials, 12.6% neither agreed nor disagreed and 35.5% disagreed. This implies that a good percentage know how to use digital technologies to search for information and study materials. From the results presented, it is evident that lecturer characteristics, students’ access to digital technologies, students’ capacity to use digital technologies and students’ awareness are some of the factors that affect students’ acceptance and use of digital technologies.
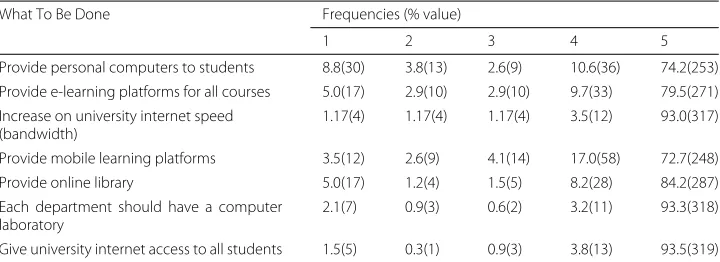
In Table5, are responses on what the university should do to facilitate students’ use of digital technology tools. 84.8% of the students agreed that the university should provide
Table 5What the university should do to facilitate students’ use of digital technologies
What To Be Done Frequencies (% value)
1 2 3 4 5
Provide personal computers to students 8.8(30) 3.8(13) 2.6(9) 10.6(36) 74.2(253) Provide e-learning platforms for all courses 5.0(17) 2.9(10) 2.9(10) 9.7(33) 79.5(271) Increase on university internet speed
(bandwidth)
1.17(4) 1.17(4) 1.17(4) 3.5(12) 93.0(317)
Provide mobile learning platforms 3.5(12) 2.6(9) 4.1(14) 17.0(58) 72.7(248)
Provide online library 5.0(17) 1.2(4) 1.5(5) 8.2(28) 84.2(287)
Each department should have a computer laboratory
2.1(7) 0.9(3) 0.6(2) 3.2(11) 93.3(318)
Give university internet access to all students 1.5(5) 0.3(1) 0.9(3) 3.8(13) 93.5(319)
them with personal computers; 89.2% agreed that the university should provide them with e-learning platforms for all courses; 96.5% agreed that there should be an increase in the university Internet bandwidth thus improving Internet speed; 89.7% stated that the university should provide mobile learning platforms; 92.4% agreed that the univer-sity should provide online library; 96.5% agreed that each department should have a computer laboratory and 97.3% agreed that Internet access should be by all students. Thus digital technology facilities at higher institutions of learning in resource constrained settings should be better equipped and students should be given more access to these technologies as this will improve both acceptance and usability of digital technologies in higher institutions of learning. Lastly, we note a gap in use of digital technology in learning and teaching of students which affects their attitude to use, their intention to use and capacity to use digital technologies. By equipping higher institutions of learning with appropriate teaching technologies, the pedagogical skills for lecturers will improve and students’ awareness and confidence to use these tools will improve hence more acceptance.
The correlation model results
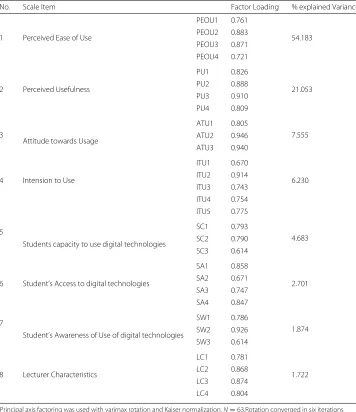
The factor analysis utilized the principal axis factoring method. It required that factor loadings exceed 0.60 as suggested by (Costello and Osborne2005). In Table6, we examine the nature of and relations among latent constructs.
Based on the results obtained on the factors that influence students’ acceptance and use of digital technologies, the model design adopts and extends the technology acceptance model (Davis et al.1989). Correlation analysis (Kothari2004) was used to measure the strength of the relationship(s) between variables; Students’ capacity to use digital technologies, Lecturer characteristics, Students’ access to digital technologies, Students’ awareness of digital technologies and the original TAM model constructs. Pearson’s correlation coefficient was used to measure the strength of the relation-ship between variables and researchers statistically used SPSS to obtain the results (Kothari2004; Sedgwick2012).
The output of the correlation calculation is the correlation coefficient (r). The correla-tion coefficient (r) ranges between−1 and 1. Ifris positive, it indicates there is a positive relationship between the two variables, ifris negative, it indicates negative relationship, and if it is zero, it indicates that there is no relationship.Pis the level of significance (error margin). IfPis below 0.005, that means that the error margin is too small thus the rela-tionship is significant and it stands otherwise ifPis above 0.005, it shows that the error margin is big therefore the relationship is insignificant and thus the relationship can’t stand (Kothari2004).
Model testing
Table 6Confirmatory factor analysis results
No. Scale Item Factor Loading % explained Variance
1 Perceived Ease of Use
PEOU1 0.761
54.183 PEOU2 0.883
PEOU3 0.871 PEOU4 0.721
2 Perceived Usefulness
PU1 0.826
21.053
PU2 0.888
PU3 0.910
PU4 0.809
3
Attitude towards Usage
ATU1 0.805
7.555
ATU2 0.946
ATU3 0.940
4 Intension to Use
ITU1 0.670
6.230
ITU2 0.914
ITU3 0.743
ITU4 0.754
ITU5 0.775
5
Students capacity to use digital technologies
SC1 0.793
4.683
SC2 0.790
SC3 0.614
6 Student’s Access to digital technologies
SA1 0.858
2.701
SA2 0.671
SA3 0.747
SA4 0.847
7
Student’s Awareness of Use of digital technologies
SW1 0.786
1.874
SW2 0.926
SW3 0.614
8 Lecturer Characteristics
LC1 0.781
1.722
LC2 0.868
LC3 0.874
LC4 0.804
Principal axis factoring was used with varimax rotation and Kaiser normalization.N=63.Rotation converged in six iterations The constructs presented in the table had high factors loading thus being valid whereas constructs PEOU5, ATU4, ATU5, SCI4, SCI5, SA5, SW4, SW5 and LC5 were deleted due to low factor loading which was below 0.6.
Table 7Pearson’s correlation matrix for the new variables and the TAM variables
PEOU PU ATTU IU SCTU SA SW LC
PEOU 1
PU .419** 1
ATTU .578** .799** 1
IU .557** .698** .780** 1
SCTU .622** .352** .444** .595** 1
SA .387** .081 .146 .331** .534** 1
SW .499** .239 .332** .549** .814** .674** 1
LC .376** .210 .155 .304* .523** .615** .507** 1
PEOU: perceived ease of use; PU: perceived usefulness; ATU: attitude toward usage; IU: intention to use; SCTU: students’ capacity to use digital technologies; SA: students’ access to digital technologies; SW: students’ awareness of use of digital technologies; LC: lecturer characteristics
**Indicates significance atp<0.05
digital technologies, student capacity to use digital technologies, students’ access to digital technologies, students’ awareness of digital technologies and lecturer characteristics.
Perceived Usefulness (PU)was found to be positively and significantly related to atti-tude towards use (r = 0.799,p < 0.01), intention to use (r = 0.698,p < 0.01) and students’ capacity to use (r = 0.352,p < 0.01). However, there was no signifi-cant relationship between perceived usefulness and students’ access, students’ awareness, lecturer characteristics. This implies that a change in perceived usefulness of digi-tal technologies may cause a change in attitude towards use of digidigi-tal technologies, intention to use digital technologies and students’ capacity to use digital technologies but cannot cause a change in perceived usefulness of digital technologies, students’ access to digital technologies, students’ awareness of digital technologies and lecturer characteristics.
Attitude Towards Use (ATTU)was found to be positively and significantly related to intention to use (r = 0.780,p < 0.01), student capacity to use (r = 0.44,p < 0.01) and students’ awareness (r = 0.332,p < 0.01). However, attitude towards use was not significantly related to students’ access and lecturer characteristics. This infers that a change in attitude towards use of digital technologies may cause a change in students’ intention to use digital technologies, students’ capacity to use digital technologies, and students’ awareness of digital technologies but has no impact on students’ access to digital technologies and lecturer characteristics.
Intention to Use (IU)was found to be positively and significantly related to students’ capacity to use (r = 0.595,p < 0.01), students’ access (r = 0.331,p < 0.01), students’ awareness (r= 0.549,p< 0.01) and lecturer characteristics (r =0.304,p< 0.05). This implies that a change in students’ intention to use digital technologies may cause a change in students’ capacity to use digital technologies, students’ access to digital technologies, students’ awareness of digital technologies and lecturer characteristics.
Students’ capacity to Use (SCTU)was found to be positively and significantly related to students’ access (r = 0.534,p < 0.01), students’ awareness (r = 0.814,p < 0.01) and lecturer characteristics (r=0.523,p<0.01). Thus a change in students’ capacity to use digital technologies may cause a change in students’ awareness of digital technologies and lecturer characteristics.
Students’ Access (SA)was found to be positively and significantly related to students’ awareness (r= 0.674,p< 0.01) and lecturer characteristics (r =0.615,p< 0.01). This means that a change in students’ access to digital technologies may cause a change in students’ awareness and lecturer characteristics.
Students’ awareness (SW)was found to be positively and significantly related to lecturer characteristics (r = 0.507,p< 0.01). This implies that a change in Students’ awareness may cause a change in lecturer characteristics and access of digital technologies.
Regression analysis
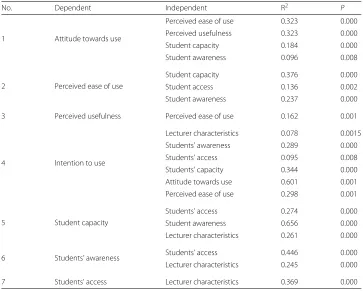
The probability value of 0.000 indicates that the regression relationship was highly significant in predicting how attitude towards use, perceived ease of use, perceived use-fulness, intention to use, student capacity, students’ awareness and students’ access affect students’ usability and acceptance of digital technologies in higher institutions of learn-ing in a resource constrained settlearn-ing. As indicated in Table8, whenattitude towards use
was held dependent and regressed against; Perceived ease of use (R2=0.323,p=0.000),
perceived usefulness (R2= 0.633,p= 0.000), student capacity (R2 = 0.184,p= 0.000)
and student awareness (R2 =0.096,p= 0.008), results indicated that all these variables cause a change in attitude towards use. Using the adjustedR2to establish the predictive power of the study model, the following variations were found for each constituting atti-tudes towards use variable;Perceived ease of use0.323,Perceived usefulness0.633,Student capacity0.184,Student awareness0.096. Thus, 32.3%, 63.3%, 18.4% and 9.6% variation in attitudes towards use respectively. When perceived ease of use was held dependent and regressed against; students’ capacity (R2 = 0.376, p = 0.000), students’ access
(R2 = 0.136,p = 0.002) and students’ awareness (R2 = 0.237,p = 0.000), it showed that all these variables cause a change in perceived ease of use i.e.students’ capacity
(37.6%),students’ access(13.6%) andstudents’ awareness(23.7%). Whenperceived useful-nesswas held dependent and regressed against perceived ease of use. It was found to be (R2=0.162,p=0.001) implying 16.2% variations in perceived usefulness.
Whenintention to usewas held dependent and regressed against variables; lecturer characteristics (R2 = 0.078,p = 0.015), students’ awareness (R2 = 0.289,p = 0.000), students’ access (R2 = 0.095,p = 0.008), students’ capacity (R2 = 0.344,p = 0.000),
Table 8Regression results of variables which are related
No. Dependent Independent R2 P
1 Attitude towards use
Perceived ease of use 0.323 0.000
Perceived usefulness 0.323 0.000
Student capacity 0.184 0.000
Student awareness 0.096 0.008
2 Perceived ease of use
Student capacity 0.376 0.000
Student access 0.136 0.002
Student awareness 0.237 0.000
3 Perceived usefulness Perceived ease of use 0.162 0.001
4 Intention to use
Lecturer characteristics 0.078 0.0015
Students’ awareness 0.289 0.000
Students’ access 0.095 0.008
Students’ capacity 0.344 0.000
Attitude towards use 0.601 0.001
Perceived ease of use 0.298 0.001
5 Student capacity
Students’ access 0.274 0.000
Student awareness 0.656 0.000
Lecturer characteristics 0.261 0.000
6 Students’ awareness Students’ access 0.446 0.000
Lecturer characteristics 0.245 0.000
7 Students’ access Lecturer characteristics 0.369 0.000
attitude towards use (R2 = 0.601,p = 0.000) and perceived ease of use(R2 = 0.298,
p = 0.000), they exhibited that they cause a change. Considering the adjustedR2 val-ues, variableslecturer characteristics(7.8%),students’ awareness(28.9%),students’ access
(9.5%),students’ capacity(34.4%),attitude towards use(60.1%) andperceived ease of use
(29.8%) respectively cause variation in intention to use.
Whenstudents’ capacitywas held dependent and regressed against; students’ access (R2 = 0.274, p = 0.000), students’ awareness (R2 = 0.656, p = 0.000) and
lec-turer characteristics (R2 = 0.261, p = 0.000), they displayed a change in students’ capacity. Given the adjustedR2values, variablesstudents’ access(27.4%),students’ aware-ness(65.6%) andlecturer characteristics(26.1%) respectively cause variation in students’ capacity. When students’ awareness was held dependent and regressed against vari-ables lecturer characteristics (R2 = 0.245, p = 0.000) and students’ access (R2 =
0.446, p = 0.000), it showed that these variables cause a change in students’ aware-ness. Given the adjusted R2 values, variables lecturer characteristics (24.5%) and stu-dents’ access(44.6%) cause variation in students’ awareness. Whenstudents’ accesswas held dependent and regressed against variable lecturer characteristics (R2 = 0.369,
p = 0.000), it indicated that lecturer characteristics cause a change in students’ access. Given the adjustedR2values, lecturer characteristics (36.9%) cause variation in students’ access.
Discussion
In today’s tech-savvy generation, there is an increasing demand for a knowledgeable soci-ety which requires development of lifelong learning competencies for students (Lai2011; Knapper and Cropley2000). The need for a knowledgeable society is pushing resource constrained higher institutions of learning towards diversification of students learning styles and pedagogy skills. One sought out solution towards this, is integration of digital technologies in students’ learning and teaching.
In higher education, digital technologies are seen as transformative tools for teaching and learning (Garrison and Kanuka2004; Säljö2010; Lai2011). However, results obtained from this study indicate that there is low use and uptake of digital technologies by stu-dents in their learning. Thus, the potential for these technologies to improve student’s learning is limited. One of the limiting factors for students’ use and acceptance of digital technologies is the limited access to these technologies at the university. This is attributed to the high numbers of students as compared to the available digital technologies and the limited university computer laboratory space (Unwin2005). For effective learning, integration of formal and informal learning strategies in resource constrained higher insti-tutions of learning is vital. As this will train students as lifelong learners and independent knowledge creators in the knowledge society. Thus, students are made aware of their own learning characteristics in informal settings and are able to adapt them in formal settings (Lai2011).
an infrastructure that facilitates educational services directly through cloud providers, and are economical (Mircea and Andreescu 2011; Thorsteinsson et al. 2010). Their use of virtualization, a centralized data storage that facilitates data storage, access and monitoring (Mircea and Andreescu 2011; Pocatilu et al. 2009) is an added advantage. We therefore urge lecturers in resource constrained learning institutions to incorporate cloud-based service tools in their teaching as this will further improve students’ usabil-ity and acceptance of digital technologies. It is alsaverred that cloud-based service tools create self-regulated learning competencies among students (Rahimi et al.2015) are flex-ible (Lin et al.2014) and create a student learning driven approach (Rahimi et al.2015; Dabbagh and Kitsantas 2012; Mircea and Andreescu 2011) thus allowing students to contribute to the educational process.
Furthermore, in resource constrained higher learning institutions, students class notes are shared through hard copy or soft copy (emails). This has implications i.e. students who cannot photocopy or printout their class notes, use their mobile phones to access, read and store these class notes. This is mainly because mobile Internet data bundles are perceived to be more cost friendly than printing costs. This affirms why mobile phones were found most frequently used by students. These findings are in line with what (Mtebe and Raisamo2014; Gikas and Grant2013; Kaliisa and Picard2017) found that students most commonly used mobile phones in their learning process. The increased use of mobile devices in learning may also be attributed to the extra advantages stu-dents enjoy from using mobile phones e.g. increased cooperation among stustu-dents and between students and lecturers, instant communication, downloading audio and video facilities, flexibility associated with storage and replay of stored files, etc. (Kaliisa and Picard2017; Asiimwe and Grönlund2015). From these findings, it is evident that mobile phones should be maximized as mobile learning tools and introduced in the students’ learning.
Finally, a number of challenges faced when using digital technology tools in learners’ constrained settings are identified. These include; low bandwidth leading to slow Internet; insufficient cable network terminals; limited time to access university digital technologies; lack of training on how to use the different digital technology tools; lack of exposure to the different digital technologies; insufficient digital technologies at the university compared to student’s numbers (small number of computer laboratories and competition for digi-tal technologies); unstable electricity power; lack of enough technical support and poor security for both personal and university digital technologies. These challenges are both institutional and students’ based.
Conclusion and further works
Evaluation and improvement of our model will be a crucial aspect of our further research. After further investigating the plausibility and soundness of our model, we will test its validity by starting a substantial experimentation programme for validation.
Acknowledgments
Not Applicable.
Funding
This research study was funded by the Swedish International Development Cooperation Agency (SIDA).
Availability of data and materials
The data will not be shared because this data is from a student’s dissertation that is currently being written.
Competing interests
The authors declare that they have no competing interests.
Authors’ contributions
All authors read and approved the final manuscript.
Publisher’s Note
Springer Nature remains neutral with regard to jurisdictional claims in published maps and institutional affiliations.
Author details
1College of Computing and Information Sciences, Makerere University, Kampala, Uganda.2College of Education and
External Studies, Department of Foundations and Curriculum Studies, Makerere University, Kampala, Uganda.
Received: 26 February 2018 Accepted: 18 June 2018
References
Agrifoglio, R., & Metallo, C. (2010). ERP acceptance: the role of affective commitment. InManagement of the Interconnected World,(pp. 81–88). Springer-Physica-Verlag HD.
Ajzen, I., & Fishbein, M. (1980).Understanding attitudes and predicting social behavior, (p. 278). Michigan: Prentice-Hall. Alharbi, S., & Drew, S. (2014). Using the technology acceptance model in understanding academics’ behavioural
intention to use learning management systems.International Journal of Advanced Computer Science and Applications,
5(1), 143–155.
Ali, B. M., Younes, B., & et al (2013). The impact of information systems on user performance: an exploratory study.Journal of Knowledge Management, Economics and Information Technology,3(2), 128–154.
Al-Jabri, I. M., & Roztocki, N. (2015). Adoption of ERP systems: Does information transparency matter?Telematics and Informatics,32(2), 300–310.
Allison, P. D. (2012).Logistic Regression Using SAS: Theory and Application Books 24x7 IT PRO ITPro collection SAS Press series, The power to know,2nd edn. SAS Institute.
Al Nahian Riyadh, M., Akter, S., & Islam, N. (2009). The adoption of e-banking in developing countries: A theoretical model for SMEs.IRBRP,5(6), 212–230.
Amoako-Gyampah, K. (2007). Perceived usefulness, user involvement and behavioral intention: an empirical study of ERP implementation.Computers in Human Behavior,23(3), 1232–1248.
Amoako-Gyampah, K., & Salam, A. F. (2004). An extension of the technology acceptance model in an ERP implementation environment.Information & management,41(6), 731–745.
Andersson, A., & Grönlund, Å. (2009). A conceptual framework for e-learning in developing countries: A critical review of research challenges.The electronic Journal of information systems in developing Countries,38(1), 1–16.
Asiimwe, E. N., & Grönlund, A. (2015). MLCMS actual use, perceived use, and experiences of use.IJEDICT,11(1), 101. Avgerou, C. (2010). Discourses on ICT and development.ITID,6(3), 1.
Bagozzi, R. P. (2007). The legacy of the technology acceptance model and a proposal for a paradigm shift.JAIS,8(4), 3. Beebe, M. A. (2004). Impact of ICT revolution on the African academic landscape. InCODESRIA Conference on Electronic
Publishing and Dissemination(pp. 1–2). Dakar.ttps://www.codesria.org/IMG/pdf/Maria_A_Beebe.
Bolu, C. A., & Egbo, K. (2014). The Role of Higher Education Institutions in the Development of ICT Professionals for Innovation in Nigeria.International Journal of Engineering Innovations and Research,3(1), 1.
Bruneforth, M. (2010). Higher education in sub-Saharan Africa–A statistical portrait. InUIS Workshop on Education Statistics, Windhoek: Unesco Institute for Statistics.http://www.uis.unesco.org/StatisticalCapacityBuilding/Workshop Documents/Education workshop dox/2010 Windhoek.
Calisir, F., & Calisir, F. (2004). The relation of interface usability characteristics, perceived usefulness, and perceived ease of use to end-user satisfaction with enterprise resource planning (ERP) systems.Computers in human behavior,20(4), 505–515.
Chang, Y. P., & Zhu, D. H. (2012). The role of perceived social capital and flow experience in building users’ continuance intention to social networking sites in China.Computers in Human Behavior,28(3), 995–1001.
Chuttur, M. Y. (2009). Overview of the technology acceptance model: Origins, developments and future directions.
Working Papers on Information Systems,9(37), 9–37.
Dabbagh, N., & Kitsantas, A. (2012). Personal Learning Environments, social media, and self-regulated learning: A natural formula for connecting formal and informal learning.The Internet and higher education,15(1), 3–8.
Davis, F. D., Bagozzi, R. P., & Warshaw, P. R. (1989). User acceptance of computer technology: a comparison of two theoretical models.Management science,35(8), 982–1003.
Eisenhardt, K. M. (1989). Building theories from case study research.Academy of management review,14(4), 532–550. Escobar-Rodríguez, T., & Bartual-Sopena, L. (2015). Impact of cultural factors on attitude toward using ERP systems in
public hospitals.Revista de Contabilidad,18(2), 127–137.
Fathema, N., Shannon, D., & Ross, M. (2015). Expanding The Technology Acceptance Model (TAM) to Examine Faculty Use of Learning Management Systems (LMSs) In Higher Education Institutions.Journal of Online Learning and Teaching,11(2).http://jolt.merlot.org/Vol11no2/Fathema_0615.pdf.
Fong, M. W. (2009). Digital divide: The case of developing countries.IISIT,6(2), 471–478.
Friesenhahn, I. (2016). Making higher education work for Africa: Facts and figures.https://www.scidev.net/global/ education/feature/higher-education-africa-facts-figures.html.
Garaˇca, Ž. (2011). Factors related to the intended use of ERP systems.Management: journal of contemporary management issues,16(2), 23–42.
Garrison, D. R., & Kanuka, H. (2004). Blended learning: Uncovering its transformative potential in higher education.The internet & higher education,7(2), 95–105.
Garrison, D. R., & Vaughan, N. D. (2008).Blended learning in higher education: framework, principles, and guidelines business professional collection businesspro collection jossey-bass higher and adult education series. Wiley. ISBN 0787987700. Gikas, J., & Grant, M. M. (2013). Mobile computing devices in higher education: Student perspectives on learning with
cellphones, smartphones & social media.The Internet & Higher Education,19, 18–26.
Govindaraju, R., & Indriany, N. (2007). A Study on ERP system accertance based on technology acceptance model.http:// eprints.utcc.ac.th/2155/1/2155fulltext.pdf.
Grigera, J., Garrido, A., Rivero, J. M., & Rossi, G. (2017). Automatic detection of usability smells in Web Applications.IJHCS,
97, 129–148.
Hayward, F. M., & Ncayiyana, D. J. (2014). Confronting the challenges of graduate education in Sub-Saharan Africa and prospects for the future.IJHE,1(1).
Holden, R. J., & Karsh, B.-T. (2010). The technology acceptance model: its past and its future in health care.JBI,43(1), 159–172.
Hwang, Y. (2011). Investigating the influence of cultural orientation and innovativeness on ERP adoption.JGITM,14(3), 54–74.
Kaliisa, R., & Picard, M. (2017). A systematic review on mobile learning in higher education: The african perspective.TOJET,
16(1), 1–18.
Kasenene, E. S. (2013). Improving the Effectiveness of Public-Private Partnerships in the Provision of Higher Education in Uganda.MAJOHE,4(2), 139–157.
Knapper, C., & Cropley, A. J. (2000). Lifelong Learning in Higher Education. Psychology Press. ISBN 0749427949. Kothari, C. R. (2004).Research methodology: methods and techniques. New Age International. ISBN 8122415229. Krejcie, R. V., & Morgan, D. W. (1970). Determining sample size for research activities.EPM,30(3), 607–610.
Lai, K.-W. (2011). Digital technology and the culture of teaching and learning in higher education.Australasian Journal of Educational Technology,27(8), 1263–1275.
Lai, V. S., & Li, H. (2005). Technology acceptance model for internet banking: an invariance analysis.IJIM,42(2), 373–386. Laurillard, D. (2005). E-learning in higher education. InChanging Higher Education(pp. 87–100). Routledge.https://pdfs.
semanticscholar.org/bd4b/21917cd3dbd706d2fa9bfd31f8c8d3178753.pdf.
Lee, D., Lee, S. M., Olson, D. L., & Hwan Chung, S. (2010). The effect of organizational support on ERP implementation.
IMDS,110(2), 269–283.
Lee, Y., Kozar, K. A., & Larsen, K. R. (2003). The technology acceptance model: Past, present, and future.CAIS,12(1), 50. Lin, Y.-T., Wen, M.-L., Jou, M., & Wu, D.-W. (2014). A cloud-based learning environment for developing student reflection
abilities.Computers in Human Behavior,32, 244–252.
Lwoga, E. (2012). Making learning and Web 2.0 technologies work for higher learning institutions in Africa.CWIS,29(2), 90–107.
Mircea, M., & Andreescu, A. I. (2011). Using cloud computing in higher education: A strategy to improve agility in the current financial crisis.Communications of the IBIMA,Vol 2011. IBIMA Publishing LLC.http://www.msu.ac.zw/elearning/ material/temp/1327058884AgilityInHigherEducation.pdf.
Moore, J. L., Dickson-Deane, C., & Galyen, K. (2011). e-learning, online learning, and distance learning environments: Are they the same?The Internet and Higher Education,14(2), 129–135.
Moore, M. G., & Kearsley, G. (2011).Distance Education: A Systems View of Online Learning, 3rd edn. Michigan: Cengage Learning.
Motiwalla, L. F. (2007). Mobile learning: A framework and evaluation.Computers & education,49(3), 581–596.
Moya, M., Musumba, I., & Akodo, R. (2011). Management attitude, support and integration of information communication technologies in higher education in Uganda.Journal of Modern Accounting and Auditing, USA.http://ahero.uwc.ac.za/ index.php?module=cshe&action=downloadfile&fileid=18409092513601919673425.
Mtebe, J. (2014).Acceptance and Use of Elearning Solutions in Higher Education in East Africa. Acta Electronica. Finiland: University of Tampere.
Mtebe, J. S., & Raisamo, R. (2014). Investigating students’ behavioural intention to adopt and use mobile learning in higher education in east africa.IJEDICT,10(3), 4.
National Council for Higher Education (2005). The State of higher education and training in Uganda: A report of data collected from institutions of higher learning.Uganda, 1–55.http://www.unche.or.ug/download-attachment/259. Ng’ambi, D., & Bozalek, V. (2015). Massive open online courses (MOOCs): Disrupting teaching and learning practices in
higher education.British Journal of Educational Technology,46(3), 451–454.
Oye, N., Noorminshah, A., & Rahim, N. A. (2011). Examining the effect of technology acceptance model on ICT usage in Nigerian tertiary institutions.JETCIS,2(10), 533–545.
Palloff, R. M., & Pratt, K. (2002).Lessons from the Cyberspace Classroom: The Realities of Online Teaching. New Haven: John Wiley & Sons.
Park, S. Y. (2009). An analysis of the technology acceptance model in understanding university students’ behavioral intention to use e-learning.JETS,12(3), 150.
Perneger, T. V., Courvoisier, D. S., Hudelson, P. M., & Gayet-Ageron, A. (2015). Sample size for pre-tests of questionnaires.
Quality of Life Research,24(1), 147–151.
Pocatilu, P., Alecu, F., & Vetrici, M. (2009). Using cloud computing for E-learning systems. InProceedings of the 8th WSEAS international conference on Data networks communications, computers(pp. 54–59).http://www.wseas.us/e-library/ conferences/2009/baltimore/DNCOCO/DNCOCO-06.pdf.
Porter, W. W., Graham, C. R., Spring, K. A., & Welch, K. R. (2014). Blended learning in higher education: Institutional adoption and implementation.Computers & Education,75, 185–195.
Rahimi, E., van den Berg, J., & Veen, W. (2015). Facilitating student-driven constructing of learning environments using web 2.0 personal learning environments.Computers & Education,81, 235–246.
Rice, M. F. (2003). Information and communication technologies and the global digital divide: Technology transfer, development, and least developing countries.Comparative Technology Transfer and Society,1(1), 72–88.
Rumanyika, J. D., & Galan, R. M. (2015). Challenges for teaching and learning information and communication technology courses in higher learning institutions in Tanzania: A review.Information and Knowledge Management,5(2), 1–12. Säljö, R. (2010). Digital tools and challenges to institutional traditions of learning: technologies, social memory and the
performative nature of learning.Journal of computer assisted learning,26(1), 53–64.
Scholtz, B., Mahmud, I., & Ramayah, T. (2016). Does usability matter? An analysis of the Impact of Usability on Technology Acceptance in ERP Settings.Interdisciplinary Journal of Information, Knowledge, and Management,11, 309–330.http:// www.ijikm.org/Volume11/IJIKMv11p309-330Scholtz2814.pdf.
Sedgwick, P. (2012). Pearson’s correlation coefficient.BMJ: British Medical Journal (Online),345. BMJ Publishing Group LTD. https://fhs.mcmaster.ca/anesthesiaresearch/documents/Sedgwick2012Pearsonscorrelationcoefficient.pdf. Shih, Y.-Y., Huang, S.-S., & et al (2009). The actual usage of ERP systems: An extended technology acceptance perspective.
Journal of Research and Practice in Information Technology,41(3), 263.
Singh, J. (2017). Study on challenges, opportunities and predictions in cloud computing.IJMECS,9(3), 17. Ssekakubo, G., Suleman, H., & Marsden, G. (2011).Proceedings of the south african institute of computer scientists and
information technologists conference on knowledge, innovation and leadership in a diverse, multidisciplinary environment, (pp. 231–238). Cape Town: ACM.http://pubs.cs.uct.ac.za/archive/00000712/01/p231-ssekakubo.pdf.
Stantchev, V., Colomo-Palacios, R., Soto-Acosta, P., & Misra, S. (2014). Learning Management Systems and cloud file hosting services: A study on students’ acceptance.Computers in Human Behavior,31, 612–619.
Sternad, S., & Bobek, S. (2013). Impacts of TAM-based external factors on ERP acceptance.Procedia Technology,9, 33–42. Š ¯upulniece, I., Boguševiˇca, A., Petrakova, A., & Grabis, J. (2013). Monitoring perceived usability of ERP systems in Latvian
medium, small and micro enterprises.MSIT,16(1), 73–78.
Teo, T. (2011).Technology Acceptance in Education SpringerLink: Bücher. Springer Science & Business Media.
Thorsteinsson, G., Page, T., & Niculescu, A. (2010). Using virtual reality for developing design communication.Studies in Informatics and Control,19(1), 93–106.
Tselios, N. K., Daskalakis, S., & Papadopoulou, M. (2011). Assessing the acceptance of a blended learning university course.
Educational Technology & Society,14(2), 224–235.
Tulinayo, F. P. (2007). A system dynamics model for supply chain management in a resource constrained setting.http:// makir.mak.ac.ug/handle/10570/548?show=full.
Unwin, T. (2005). Towards a framework for the use of ict in teacher training in africa.Open Learning: The Journal of Open, Distance and e-Learning,20(2), 113–129.
Unwin, T., Kleessen, B., Hollow, D., Williams, J. B., Oloo, L. M., Alwala, J., . . . Muianga, X. (2010). Digital learning management systems in Africa: myths and realities.Open Learning,25(1), 5–23.
Vuori, V., & Okkonen, J. (2012). Knowledge sharing motivational factors of using an intra-organizational social media platform.JkM,16(4), 592–603.
Vuorikari, R., Punie, Y., Gomez, S. C., Van Den Brande, G., & et al (2016). DigComp 2.0: The Digital Competence Framework for Citizens. Update Phase 1: The Conceptual Reference Model.Technical report, JRC-Seville site.
Wang, Y.-S., Wang, Y.-M., Lin, H.-H., & Tang, T.-I. (2003). Determinants of user acceptance of Internet banking: an empirical study.IJSIM,14(5), 501–519.
Yin, R. K. (2009).Case Study Research: Design and Methods Volume 5 of Applied Social Research Methods. SAGE. Yuen, A. H., & Ma, W. W. (2008). Exploring teacher acceptance of e-learning technology.Asia-Pacific Journal of Teacher