e-ISSN: 2278-7461, p-ISSN: 2319-6491
Volume 7, Issue 8 [August 2018] PP: 60-75
www.ijeijournal.com Page |
Phenomenologically Inspired Evaluation Of Codes' Provisions
For Externally Prestressed Girders
Ahmed M. R. Moubarak
1, Nesreen A. Kassem
2, Emad El-Sayed Etman
3And
Salah El-Din F. Taher
31
Structural Engineering Department, Faculty of Engineering, Delta University for Science and Technology, Egypt
2 Associate Prof. of concrete structures, Tanta University, Egypt. 3Professor of concrete structures, Tanta University, Egypt.
corresponding author:Ahmed M. R. Moubarak
ABSTRACT:
The present paper, a parametric study has been performed for reinforced concrete beams with external prestressing taking into consideration the effect of shear span to depth ratio with variables initial prestressing stress level. Different codes proposed simplified equations for predicting the ultimate stress in tendons as well as shear resistance of cross section. Comparison between codes equation and the results of specimens of present research are presented. The behavior of the specimens is discussed at different stages of loading up to failure. The investigation included a numerical analysis for total sixteen specimens plus laboratory testing of specimens of them. In addition, an overview for the force sharing between external strand and internal longitudinal reinforcement are discussed. The results indicated that the varying of shear - span to depth ratios affect on the ultimate capacity and the behavior of prestressed beams. The codes equations were conservative in prediction the ultimate tendon stress as well as shear resistance at critical section.KEYWORDS: Precast prestressed beams, External prestressing, Unbonded tendons, Shear span to depth ratios, prestressing stress level, codes equation.
--- --- Date of Submission: 02-10-2018 Date of acceptance:13-10-2018 --- ---
I.
INTRODUCTIONExternal prestressing refers to a post-tensioning method in which the tendons are placed on the outside the concrete section and the load transferred to the concrete through end anchorages. The analysis of a concrete member with an un-bonded external tendon is complicated because of the fact that strain compatibility of concrete and prestressing tendon at a section can no longer be applied. If friction is ignored, the force in the tendon is constant between the anchorages under all loads. Analysis of external prestressed beams is different from that of both ordinary bonded prestressed beams and internally unbonded prestressed beams due to the lack of bond between tendons and concrete and due to the reduction in the effective depth of the tendons during loading (second-order effect) [1, 2, 3]. The stress increment in the external tendon cannot be determined from the conventional strain compatibility as in the case of bonded tendons, but it must be determined from the analysis of deformation of the entire structure [4]. Several researchers and codes [5, 6, 7, 8, 9, 10] have proposed the equations based on empirical formulations for predicting stresses in unbonded tendons of externally prestressed monolithic concrete beams at ultimate.
Mutsuyoshi et al. [11] tested a series of externally prestressed beams with a span to-depth ratio of about 21 beams and reported that the reduction in beam strength due to second-order effects can be as high as 16%. In another theoretical study by Alkhairi and Naaman [12], the eccentricity variation was reported to be more significant in beams with span-to-depth ratios greater than 24 and strength reduction as high as 25% can be observed for beams with a span-to-depth ratio of 45. Ng C. K. [13] presented an experimental investigation of the flexural behavior with total of nine simply supported prototype beams to evaluate the effect of span-to-depth ratio and second-order effects. It was found that span-to-depth ratio has no significant effect on the flexural behavior of the beams.
externally prestressed concrete T-Beams using FRP tendons. The main conclusion was that the shear span to depth ratio governed the mode of failure either flexure or shear failure mode.
On the other hand, there are no equations proposed in design codes to calculate the external tendon stress at ultimate state. All the equations intended for internal unbonded tendons allow using empirical equations to calculate the external tendon stress. The common way to determine the stress on prestressing steel (fps) at
ultimate for tendons is given by the equation:
ps pe
ps
f
f
f
(1)Where: fps: ultimate stress in the prestressing steel; fpe: effective stress in the prestressing steel; and fps: stress
increase due to any additional load leading to ultimate behavior.
The ECP 203-2007 [16] code calculates the stress in tendons, fps, for unbonded prestressing tendons with span to
depth ratio not exceed than 35 according to the following equation:
p cu pe psf
f
f
100
8
.
0
70
(N/mm2)
smaller
of
f
pyor
(
f
pe
420
)
(2)Where:
f
cu: Compressive strength of concrete;
p: Prestressed reinforcement ratio.The ACI code (1999) [8] gives the following equation to predict the ultimate stress, fps, in unbonded tendons:
p c pe ps f f f
70 (MPa) (3)
Where:
f
c: Compressive strength of concrete;
p: Prestressed reinforcement ratio; and
= 100 for l/dp ≤ 35and
= 300 for l/dp > 35British Code (BS 8110, 1997)[9], the effect of span-to-depth ratio, l/dp, and concrete strength are
considered as main variables affecting unbonded tendon stress at ultimate. The concrete strength is given in terms of cube strength, fcu, which:
py cu p pu p pe ps
f
f
f
d
l
f
f
1
1
.
7
0
.
7
/
7000
(4)Where:
f
pu: Ultimate strength of prestressed steel.Canadian Code (A23.3-M94, 1994)[10], the equation given in the Canadian code to predict unbonded tendon stress at ultimate is as follows:
py e y p pe ps
f
l
c
d
f
f
8000
(
)
(5)Where:
d
p: Effective depth of prestressing tendon;c
y: depth of concrete compression zone calculatedby internal force equilibrium of critical section; and
l
e : length of the tendon between the anchorages divided by the number of plastic hinges. On the other hand, the ECP 203-2007 [16] code calculate the concrete shear strength qcu from the smaller value of flexural shear strength qci and web cracking shear strength qcw as thefollowing equations. c cu cr i d c cu ci
f
M
M
q
q
f
q
0
.
8
.
0
.
24
045
.
0
max
(6)Where: qd : unfactored shear stress due to dead load only at the critical section; qi : factored shear stress
at the critical section due to externally applied loads occurring simultaneously with Mmax; Mmax : factored
moment at the critical section due to external applied loads; and Mcr : cracking moment.
pv pcc c
cu
cw
f
q
f
q
24
.
0
(7)Where: fpcc : concrete stress at the C.G. of the section due to effective prestressing after considering all losses;
qpv : unfactored shear stress due to the vertical component of prestressing.
The web shear strength qcw can be obtained also from the following equation:
1
25
.
0
24
.
0
cu pcc cu cwf
f
f
In this paper, the accuracy of the formulas for Egyptian Code (ECP 203-2007), American Code (ACI), British Code (BS8110) and Canadian Code is presented.
II.
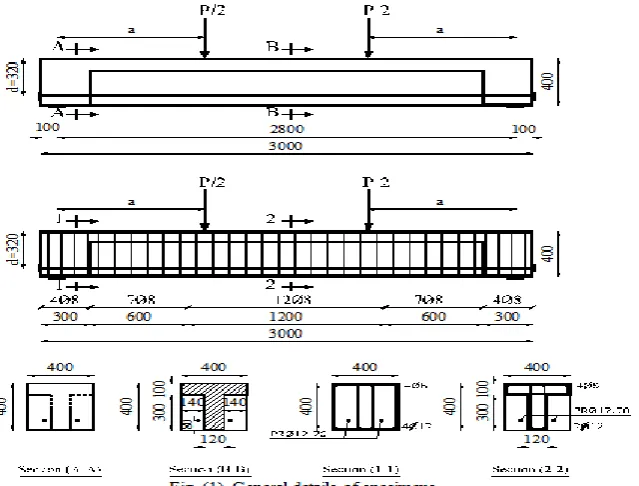
RESEARCH PROGRAMThe research program based on finite element analysis using ANSYS program of total sixteen concrete beams divided into four groups plus one of them had an experimental work to verify the finite element analysis, as listed in Table (1). All beams were simply supported and prestressed with straight external tendons, had the same T- cross section of an overall depth of 400 mm with total length of 3000 mm. All beams had 400x400x300mm end rectangular blocks to allow for prestressing anchorage as shown in Fig. (1). Each Group consists of four beams with different shear span to depth ratio (a/d = 2.0, 2.8, 3.5 and 4.38) at different effective prestressing stress level equal 26%, 40%, 50% and 60%.
Table (1) Description of cases studies.
Group Specimen P.L. (fpi/fpu) (a/d) Tendon profile
Methodology
Exp. F.E.
GI
MD0 S 2.0-26%
26%
2.0
Straight
ـــــ
MD0 S 2.8-26% 2.8
MD0 S 3.5-26% 3.5 ـــــ
MD0 S 4.38-26% 4.375 ـــــ
GII
MD0 S 2.0-40%
40%
2.0
Straight
ـــــ
MD0 S 2.8-40% 2.8 ـــــ
MD0 S 3.5-40% 3.5 ـــــ
MD0 S 4.38-40% 4.375 ـــــ
GIII
MD0 S 2.0-50%
50%
2.0
Straight
ـــــ
MD0 S 2.8-50% 2.8 ـــــ
MD0 S 3.5-50% 3.5 ـــــ
MD0 S 4.38-50% 4.375 ـــــ
GIV
MD0 S 2.0-60%
60%
2.0
Straight
ـــــ
MD0 S 2.8-60% 2.8 ـــــ
MD0 S 3.5-60% 3.5 ـــــ
MD0 S 4.38-60% 4.375 ـــــ
III.
EXPERIMENTAL WORK 3.1 Material Properties3.1.1 Concrete
Three trial mixes were batched to produce high strength concrete having a characteristic strength of 45 MPa needed to tolerate the prestressing safely and to prevent bursting cracks at end blocks. The mix proportions by weight were as shown in Table (2). The constituent materials were ordinary Portland cement (CEM I 42.5), local sand as fine aggregate and 5-16 mm well graded dolomite as coarse aggregate. Due to the low water to cement ratio the use of superplastiezers was essential. In order to attain acceptable level of workability of the fresh concrete, Sikament 163 M was used.
Table (2) Mix Proportion of Concrete.
Cement
(kg/m3) Fine aggregate (kg/m3) Coarse aggregate (kg/m3) Water (kg/m3) Water cement ratio Admixture (kg/m3)
450 600 1200 155 0.344 8.1
3.1.2 Non-Prestressed Steel and External Prestressing Tendon
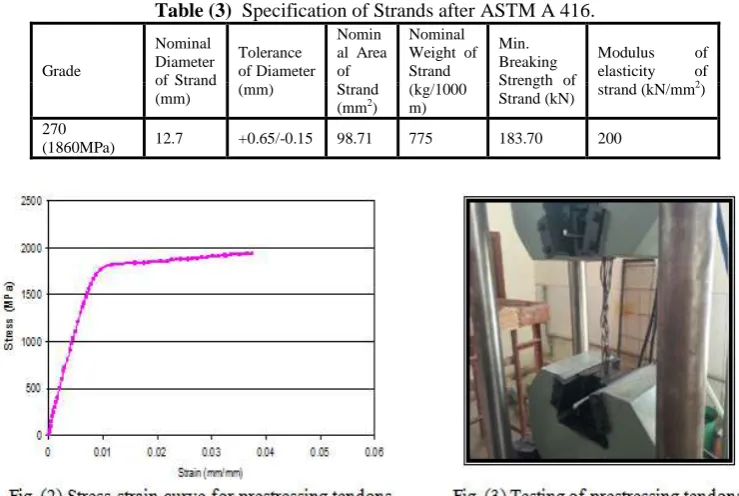
For all specimens, nominal yield stress of bottom reinforcement in beam with 12 mm diameter was 360 MPa, and 240 MPa for top reinforcement and stirrups with diameter 8 mm. Two 7-wire prestressing tendons with a nominal diameter of 12.7 mm were prepared for each specimen externally in contact with the beam at anchorages and deviators only. The specification of strand was according to ASTM (A 416 - Grade 270) as given in Table (3). The strands were tested under tension by a 3000 kN universal testing machine. Stress - strain curve for Strand and their modes of failure by rupture are shown in Fig. (2) and Fig. (3).
Table (3) Specification of Strands after ASTM A 416.
Grade
Nominal Diameter of Strand (mm)
Tolerance of Diameter (mm)
Nomin al Area of Strand (mm2)
Nominal Weight of Strand (kg/1000 m)
Min. Breaking Strength of Strand (kN)
Modulus of elasticity of strand (kN/mm2)
270
(1860MPa) 12.7 +0.65/-0.15 98.71 775 183.70 200
3.2 Experimental Setup
Fig. (4) Experimental test setup.
IV.
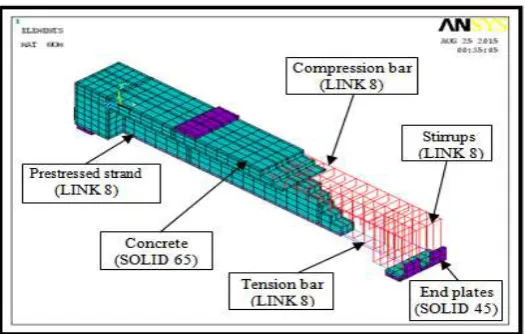
FINITE ELEMENT ANALYSISThe 3-D model using ANSYS [17] program was applied with the same dimensions of the experimental tested specimen. A very fine mesh sensitivity study was performed. The finite element mesh is shown in Fig. (5). The element Solid65 is used special for three-dimensional modeling for concrete solid elements with or without reinforcing rebars. The solid is capable of cracking in tension and crushing in compression. LINK8 3-D spare element represented as link elements. The LINK8 element is uniaxial tension-compression element with three degrees of freedom at each node. To verify the accuracy of the numerical model, results of the system for numerical model, were compared against the data obtained from the experimental tested beam. Load-deflection of system, strain distribution in steel bars and prestressed strand are illustrated in Figs. (6) and (7), in which the results obtained numerically were noted to be in very close agreement with the experimental data.
V.
RESULTS AND DISCUSSIONS 5.1 Cracking and ultimate loadThe crack patterns of tested specimen MD0 S 2.8-26% is demonstrated in Fig. (8) which flexural cracks were firstly initiated at mid-span zone. As the applied load increased, several simultaneous cracks were developed within the middle part and minor flexural-shear cracks also appeared. After that, flexural cracks propagated through the beam width then spread towards the top flange. It was noticed that the left anchor plate of back strand was broken in an abrupt manner at failure
Fig. (8) Crack pattern for specimen MD0 S 2.8-26%
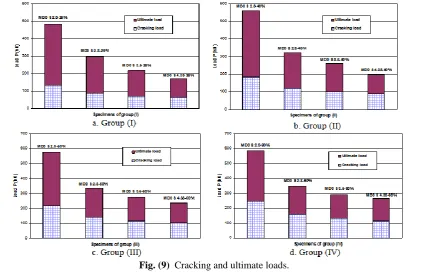
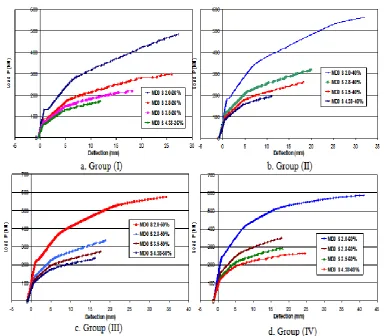
Figs. (9-a) to (9-d) show graphically the cracking and ultimate load for all specimens of Groups (I) to (IV). Specimens MD0 S 2.0-26%, MD0 S 2.0-40%, MD0 S 2.0-50% and MD0 S 2.0-60% which having a/d=2.0 had the higher cracking and ultimate load. It is clear that the cracking load and ultimate load was decreased with the increase of a/d ratio. As the a/d ratio increased from 2.0 to 4.38, the cracking load of the specimens decreased by about 205%, 206%, 209% and 215% for Groups (I), (II), (III) and (IV) respectively. That was because of the increase in shear span increases the flexure stresses on the beam cross section area at the constant moment region between two applied loads, which increased the tensile stresses in the concrete section and consequently hurries cracking. Also, increasing a/d ratio from 2.0 to 4.38, the ultimate carrying capacity of the specimens decreased significantly by about 283%, 280%, 242% and 222% for Groups (I), (II), (III) and (IV) respectively.
5.2 Shifting of Strand Eccentricity
Fig. (10) shows the load versus strand eccentricity for all specimens. The eccentricity of external strand attend to two stages with reversed direction. Firstly, due to an initial camber, the eccentricity of strand was increased with same values due to the constant initial prestressing force for each Group. However, with increasing the applied loads, the eccentricity was decreased due to the sagging of specimens at failure compared with the initial strand eccentricity by about 12%, 10%, 9% and 6% for specimens of Group I; 15%, 10%, 9% and 5% for specimens of Group II; 15%, 9%, 9% and 8% for specimens of Group III; and 18%, 9%, 9% and 11% for specimens of Group IV respectively. It was noted that the shear span to depth ratio has an important effect on the strand eccentricity and consequently, the second-order effects.
a. Group (I) b. Group (II)
c. Group (III)
d. Group (IV) Fig. (10) Load vs strand eccentricity at mid-span of beams.
5.3 Load – Deflection Relationship
Fig. (11) Load vs deflection at mid-span of beams.
5.4 Strand's Strain
Fig. (12) Load vs strain in external strand's.
5.5 Strain in Longitudinal Reinforcement
The strain in the longitudinal bonded reinforcement bars of the beams versus the applied loads are illustrated in Fig. (13). At transfer stage, initial prestressing produced compression strain in internal bars with constant values for all specimens at each Group. With loading, linear response was noted until the first crack occurred. After that the strain in internal bars increased linearly having different slope with the applied load until the internal reinforcing bars started to yield. After yielding of internal reinforcing bars, the strain increment for bars increased linearly through small values with great increase in load until failure. The final strain for internal reinforcing bars was approximately the same for all specimens of each Group. Thus, it can be said that the shear span to depth ratio had no significant effect on the final strain values in the internal reinforcing bars.
Fig. (13) Load vs strain in internal bottom rebar at mid-span.
VI.
TENSION FORCE SHARING BETWEEN INTERNAL REINFORCING BARS AND EXTERNAL STRANDSthe first crack and secondly, from the first crack up to failure. It was noted that the trend of forces versus load differed between internal bar and external strand resisting tension forces. From beginning of loading to the first crack, both the resisting tension forces by bar and strand were linear with loading. With increasing loads up to yielding of internal bar, both the resisting tension forces by bar and strand were linear but with different slopes which in case of bars the resisting tension force increased gradually with higher rate compared with the case of strand. Finally, from load of bar yielding to failure, the manner of resisting forces was reversed which the resisting tension force in external strand increased gradually with higher rate compared with the case of internal bars.
The sharing of internal bars and external strands to resist the tension stresses of the system was illustrated in Figs. (15-a to d). It was showed that the sharing ratio of internal bars at failure to resist tension stresses increased by slight effect about 12%, 8% and 4% with increasing shear span to depth ratio from 2.0 to 4.38 for Groups (I) to (III) respectively. On the other hand, the sharing ratio of external strand decreased by the same percentage with increasing shear span to depth ratio from 2.0 to 4.38. However for Group (IV), the sharing ratio of internal bars and external strand at failure to resist tension stresses was almost constant with minor effect due to changing the shear span to depth ratio from 2.0 to 4.38. It was showed also that the maximum sharing ratio for internal bars to resist tension stresses was found at the point of yield for internal bar and decreased approximately from 45% to 30% with increasing initial prestressing stress level from 26% to 60%. On the other hand, the maximum sharing ratio of external strand to resist tension stresses was found at transfer stage and decreased gradually up to the yield of internal bars, after that the sharing ratio increased gradually up to failure.
VII.
STRAIN VECTORSThe vector plots for strains distribution of beams for different stages of loading at transfer, 25% Pu, 50% Pu, 75% Pu and at ultimate are illustrated in Fig. (16) for specimen MD0 S 2.0-26% as example. At transfer, according to the initial prestressing force which produced a compression force acting at a distance equal the initial eccentricity of strand, the camber of specimen has occurred. This induces a compression strains at lower part under the neutral axis of specimens and tension strains at upper part of specimens for all specimens which had the same initial prestressing force as shown in Fig. (16-a). With increasing the loading to about 25% of ultimate load, the strain distribution reversed that the upper part had compression strains while the lower part had tension strains. The tension strain vectors increased gradually with increasing the applied load up to ultimate load under the two points of loading at the lower part of specimens. However, in the case of specimens with shear span to depth ratios 3.5 and 4.38, the maximum tension strain vectors located at the mid span of specimens.
Fig. (16) Vector plot for strains distribution of beam MD0 S 2.0-26% at different stages.
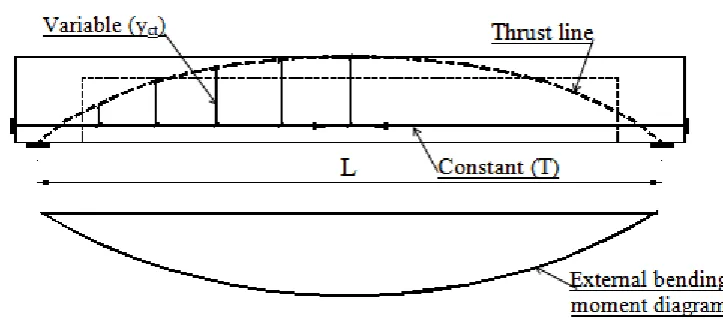
Fig. (17) shows the strain vectors at 25% of ultimate load for different shear span to depth ratios. These figures demonstrate the formation of arch action for load transfer mechanism. This form is expected for unbonded tendons as the tension force in the strand is almost constant along the entire length. This fact is reflected through the change in the lever arm (yct) between tension and compression as schematically presented
in Fig. (18). This case differs from bonded tendons where (yct) is almost constant while the tension force in the
tendon changes from section to another due to strain compatibility.
Fig. (18) Schematic diagram for arch action of load transfer mechanism.
VIII.
STRESS DISTRIBUTIONThe contour plots for stress distribution of beams for different stages of loading at transfer, 25% Pu, 50% Pu, 75% Pu and at ultimate for specimen MD0 S 2.0-26% as example are illustrated in Fig. (19). At transfer, according to the initial prestressing force and the camber of specimen, tension stresses developed at the upper part and the surface of top flange, while compression stresses formed at the lower part under the neutral axis of specimens as well as tension strains at upper part of specimens for all specimens which had the same initial prestressing force as shown in Fig. (19-a). With increasing the loading to about 25% of ultimate load, the stress distribution reversed such that the upper part had compression stresses while the lower part had tension stresses. In addition, along the total height of cross section of specimens, the stresses changed gradually with different values from tension stresses at bottom to compression stresses at top. For all specimens, the tension stresses increased gradually and propagated upward with increasing the applied load up to ultimate load. It was noticed that compressive stresses were concentrated at top surface of concrete flange and increased up to failure. It was noted that stress distribution had almost the same distribution for each shear span to depth ratio which mean that the initial prestressing level had less significant effect on the stress distribution along the beam.
IX.
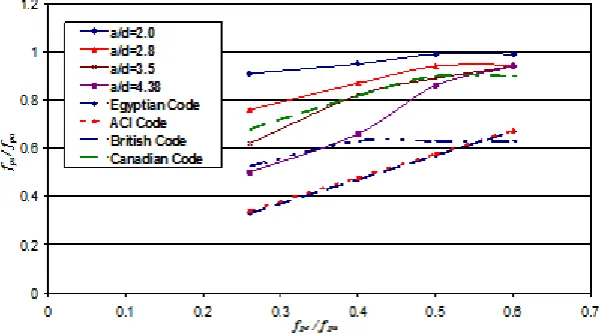
COMPARISON WITH CODES' FORMULAS 9.1 Prediction of Strand's StressDifferent codes proposed simplified equations for predicting the ultimate stress in tendons. In this part, the accuracy of the formulas for Egyptian Code (ECP 203-2007), American Code (ACI), British Code (BS8110) and Canadian Code is presented. These equations were illustrated previously in details at item 2. Fig. (20) shows comparison for strand stress between specimens of present research and codes' equations. It was noted that the equations of Egyptian Code (ECP 203-2007) and American Code (ACI) were too conservative in prediction of the ultimate tendon stress while the equation for British Code (BS8110) gave less conservative but with great limitation of maximum strand stress that not greater than 0.7fpy. In addition, Canadian Code equation for
prediction ultimate tendon stress gave more agreement with results of research specimens. All prediction equations had not considered the effect of shear span to depth ratios as well as the second order effect for external unbonded tendon.
Fig. (20) Comparison for ultimate strand stress among case studies and codes' equations.
9.2 Prediction of Shear Resistance
Many codes such as Egyptian Code (ECP 203-2007) and American Code (ACI) gave prediction equations to determine shear resistance for concrete of beams. These equations calculated at critical section as shown in Fig. (21) depended on the smallest values of flexural shear strength, qci, and web shear strength, qcw,
which the last qcw could be considered by two methods getting qcw1 and qcw2 as listed in item (2). Fig. (22)
illustrates the relation between ultimate loads and the concrete shear resistance for specimens by considering various shear strength qci, qcw1 and qcw2 in calculations. Also, Fig. (23) illustrates the same relationship but
obtained by considering qu for ECP and ACI Codes.
The shear equations in the Egyptian Code (ECP 203-2007) as well as American Code (ACI) depended in the calculation of qci and qcw on the values of effective prestressing which may be suitable in case of bonded
tendon. That is because the critical section for simply supported beam is located near the support where the variation in the prestressing force is compatible with the external bending moment and this variation may be small. On the other hand, in case of external unbonded tendon where the prestressing force is approximately constant along the tendon length, it is better to consider the force in the external tendon at each stage of loading rather than its initial value.
Fig. (22) Relation between ultimate loads and concrete shear resistance.
Fig. (23) Relation between ultimate loads and ultimate shear resistance obtained by ECP and ACI Codes.
X.
LOADING STAGES OF PRESTRESSING GIRDERExperimental and numerical specimens studied in this research pass through different stages during loading and can be summarized as shown in Fig. (24) as follows:
i.At transfer: initial prestressing force is applied to the beam introducing camber with compressive stress at bottom and tensile stress at top section.
ii. Balanced stage: with loading the upward deflection due to prestressing is cancelled and the stress over the section is uniform compression.
iii. Full prestressing: with increasing loads the tension produced at bottom fiber up to reached to zero stress at bottom.
iv. Cracking stage: increasing load at this stage produced tension stresses reached to the concrete tensile strength.
v. Yield of internal rebars: cracks increased in width and propagate towards the upper flange and the stress in internal rebars increased until reach to its yield strength.
vi. Ultimate load: with continuity of loading, the deflection increased gradually up to failure.
XI.
CONCLUSIONSMany Conclusions can be drawn from the presented experimental and numerical study as follows:
The modes of failure for the most case studies were yielding in internal bonded rebars followed by compression failure at top surface of concrete flange. However, for the cases of small shear span to depth ratio (a/d) 2.0 with initial prestressing level of 40%, 50% and 60%, the beams failed by yielding in the external unbonded strand.
The shear span to depth ratio (a/d) has an apparent pronounced influence on the ultimate capacity which decreased with the increase of a/d and also has a significant effect on the load-deflection behavior which at any loading stage, the deflection at mid-span decreased with the decrease of a/d.
The strain increment of external strand increased significantly with the decrease of shear span to depth ratio. It was noted that for shear span to depth ratios (2.8, 3.5 and 4.38) the total strain in external strand had not exceeded the yield strain which ensured that the strand almost remained in the linear stage before yielding. While for small shear span to depth ratio equal 2.0, the strain in the external strand exceeded the yield strain except for specimen MD0 S 2.0-26% which had less initial prestressing.
Contribution of internal bonded rebars for all case studies to resist the total tensile stress was essential and should be considered which it can be reached to resist about 50% of total tension forces.
The formation of arch action for load transfer mechanism was demonstrated at low levels of loading (within full prestressing limit). This form is expected for unbonded tendons as the tension force in the strand is almost constant along the entire length.
The equations of Egyptian Code (ECP 203-2007) and American Code (ACI) were too conservative in prediction the ultimate tendon stress while, British Code (BS8110) gave less conservative but with great limitation of maximum strand stress that not greater than 0.7fpy and Canadian Code equation gave more
agreement with results of research specimens. These prediction equations had not considered the effect of shear span to depth ratios, contribution of internal rebars as well as the second order effect for external unbonded tendon.
Also, the equations of Egyptian Code (ECP 203-2007) and American Code (ACI) were conservative in prediction the shear resistance at critical section. These equations depending on the value of initial prestressing force which may be suitable for bonded strand. However, it is better to consider the force in the external tendon at each stage of loading rather than its initial value.
REFERENCES
[1]. Virlogeux M., “Some Elements for a Codification of External Prestressing and of Precast Segments”, Proceedings of the Workshop on Behaviour of External Prestressing in Structures, Saint-Remy-les-Chevreuse, France, Editors - E. Conti & B. Foure, pp. 449-466, 1993.
[2]. Hindi A., Macgregor R. J., Kreger M. E., and Breen JX., “Enhancing the Strength and Ductility of Post-Tensioned Segmental Box-Girder Bridges”, Proceedings of the Workshop on Behaviour of External Prestressing in Structures, Saint-Remy-les-Chevreuse, France, Editors - E. Conti & B. Foure, pp. 153-162, 1993.
[3]. Sivaleepunth C., Niwa J., Tamura S. and Hamada Y., “ Flexural Behavior of Externally Prestressed Concrete Beams by Considering Loading Application”, Proceedings of the JCI, Vol.27, No.2, pp. 553-558, 2005.
[4]. Ariyawardena T.M.D. N., “Prestressed Concrete with Internal or External Tendons: Behaviour and Analysis”, PhD Thesis, Department of Civil Engineering, CALGARY, ALBERTA, 2000.
[5]. Sivaleepunth C., Niwa J., Diep B. K., Tamura S. and Hamada Y., “Prediction of Tendon Stress And Flexural Strength of Externally Prestressed Concrete Beams”, JSCE, Journal of Materials, Concrete Structures and Pavements, Vol.62, No.1, pp. 260-273, 2006. [6]. Aparicio A. C., Ramos G. and Casas J. R., “Testing of Externally Prestressed Concrete Beams”, Engineering Structures 24, pp.
73-84,2002.
[7]. AASHTO LRFD Bridge Design Specifications, “American Association of State Highway and Transportation Officials”, Washington, D.C., U.S .A, First Edition, 1 994
[8]. ACI 318 (1999), “Building Code Requirements for Reinforced Concrete”, ACI, Detroit, Michigan, USA, 1999. [9]. BS 8110 (1997), “Structural Use of Concrete, Part 1”, British Standards Institution, 1997.
[11]. Mutsuyoshi H, Tsuchida K, Matupayont S, Machida A., “Flexural Behavior And Proposal of Design Equation For Flexural Strength of Externally Pc Members”, Journal of Materials, Concrete Structures and Pavements 1995; Vol. 508, No. 26, pp. 67–76, 1995. [12]. Alkhairi F.M., Naaman A.E., “Analysis of Beams Prestressed With Unbonded Internal or External Tendons”, ASCE Journal of
Structural Engineering, Vol. 119, No. 9, pp. 680–700, 1999.
[13]. Ng C. K. and Tan K. H., “Flexure Behavior of Externally Prestressed Beams (Part II): Experimental Investigation”, Engineering Structure 28 (622-633), 2006.
[14]. Sivaleepunth C., Niwa J., Tamura S. and Hamada Y., “ Flexural Behavior of Externally Prestressed Concrete Beams by Considering Loading Application”, Proceedings of the JCI, Vol.27, No.2, pp. 553-558, 2005.
[15]. Sayed M. F., “Shear Behavior of Externally Prestressed Concrete T-Beams Using FRP Tendons”, Master of Science thesis, Ain Shams University, 2010.
[16]. Egyptian Code for the Design and Construction of Concrete Structures, ECP 203-2007.