Comparison Study of Dual Fuel Engine
Performance and Overall Generated Noise under
Different Dual Fuel Types and Engine Parameters
Emad Elnajjar
1, Mohamed Y. E. Selim, Farag Omar
Mechanical Engineering Department, UAE University Al Ain-UAE
Abstract— The effects of different engine parameters: engine speed, injection timing, loading, compression ratio and different pilot fuel to gases fuel ratio, were experimentally used to investigate the overall generated noise from the dual fuel engine. Dual fuel engine noises were reported for almost the first time in this study by direct sound pressure level measurements and compared to the maximum cylinder pressure rise rate with respect to the engine crank angle. The study was conducted for three different fuels: pure diesel fuel, and dual fuel of diesel- LPG or natural gas. The study reported the location (crank angle) corresponding to maximum cylinder pressure and max pressure rise rate. The present work reported much higher SPL generated form burning a dual fuel compared to burning diesel fuel only.
Index Term
—
diesel engine, dual fuel engine, combustion noise, LPG, Natural GasI. INTRODUCTION
The study of engine noise has been carried out since the early stages of engine development. In 1931, Ricardo first found a descriptive relationship between the combustion pressure rise and the noise produced [1]. Later, a number of parameters in determining the noise developments were investigated which include the first and the second derivative of cylinder pressure [2]. These methods were effective in revealing the relationship between engine combustion and noise. Some of them still play an important role in identifying the source of engine noise [3].
Although there are a number of engine noise sources, one of the most fundamental is the combustion-induced noise. It occurs toward the end compression stroke and subsequent expansion stroke. The rapid pressure change due to the combustion transmits through engine structures and forms a part of the airborne noise [4]. This pressure change also causes the vibration of the engine components such as the cylinder head, pistons, connecting rods and engine body. The combustion induced noise is however the dominant source. It has been shown that the combustion noise is affected by many design parameters of the engine e.g. using stable diesel-water emulsion [5, 6], using water added in the intake of the dual fuel engine [7], using Argon or other diluents gas in intake [8]. Using Exhaust Gas Recycle in dual fuel engine [9, 10] or using different pilot fuels also affects the combustion noise [11, 12, 13]. The use of different gaseous fuels e.g. natural gas,
intensity techniques. The noise measurements carried out in compliance with international standard ISO/DIS 9614-1 and SAE recommendations. The microphones were positioned at the front, rear, left, right and at the top of the testing engine facility. The test facility was located inside an echoic chamber, to attenuate/ absorb any sound refection. One of the important finding of their study was the highest noise levels measured at front position of the engine.
There have been too many studies addressing the noise emissions problem for diesel engines and its solutions. However, it is hardly to find any work that deals with noise emissions problem from dual fuel engines. When diesel engine is converted to run on dual fuel where gas is the main fuel and diesel is the pilot fuel, the levels of generated noise for this type of engine is much higher than that generated form regular diesel engines. By all means, tracking and decomposing of the engine noise was not one of this study objectives, instead the main objective of the present work is to report the averaged overall sound pressure levels measured at the point of highest exposed noise levels (located at the engine front according to JunHong et al study, [19]) and utilized these results as a tool to compare noise generated from different duel fuels engines with the noise generated from pure diesel engine. All tests were preformed under the same background noise levels. The study examine the effects of different fuels: single diesel fuel, LPG and natural gas (as a main fuel) under varying different engine design and operational parameters on engine noise generation..
II. EXPERIMENTAL APPARATUS
parameters (: RPM , torque, cylinder pressure, SPL and the crank angle) were measured and reported in the input data file for many power cycles. The developed code analyse each
cycle, where the maximum cylinder pressure, average torque, rate of heat release, rate of pressure rise, the corresponding crank angle location for both cylinder maximum pressure and maximum pressure rise rate, the air to fuel ratio, the power and the cycle efficiency are calculated and displayed.
Experiments have been carried out after running the engine for some time until it reaches steady state and oil temperature is at 48o C 3, and cooling water temperature is at 70o C 3. The sound pressure level emitted from the engine has been measured by a Extech Instruments digital sound pressure meter fixed near to the engine cylinder head. It is capable of measuring the surrounding noise with a resolution of 0.1 dB and an accuracy of ± 0.5 dB. It uses a 6 mm diameter Electret Condenser Microphone type that detects the noise from 31.5 Hz to 8 kHz.
Experimental Procedures
The study is carried out to cover three different types of fuels: single diesel fuel, LPG and Natural Gas as the main fuel for dual fuel engine that uses diesel as pilot fuel. For each type of fuel the engine parameters are varied according to the following listed levels:
• The engine speed and it is varied from 20 to 28 rev/sec, incremented by 2 rev/sec
• The pilot diesel fuel mass injected and it is varied from 0.14 to 0.72 kg/hr
• The engine injection timing for the pilot fuel and it is varied from 20 to 45o BTDC, incremented by 5o
• The engine compression ratio and it is varied from 16 to 22, incremented by 2.
• The mass of gaseous fuel and it is varied from 1 to 4.5 kg/hr (till the onset of engine knocking and strong pressure waves observed).
III. RESULTS AND DISCUSSION
Figure 2 describes snap shots of the typical acquired signals under 20 rev/s operating condition. Figure 2-a shows the
averaged sound pressure levels (SPL) measured by the condenser microphone within one engine cycle. The figure shows the noise measured for motoring engine, for the combustion case and the background noise. The data was collected for all the runs under the same background noise levels shown. Figure 2-b shows a sample of cylinder pressure under motoring and the crank angle pulses within the same cycle. Figure 2-c and d are showing a sample of the cylinder pressure under normal combustion for (c) case without engine knocking while for (d) case is with knocking, the bottom curves represent the pressure rise rate with respect to crank angle in both.
It may be worth mentioning here that, for all reported cases, the motoring averaged sound pressure levels dashed lines shown in figures b (figures 3 through 7) are measured at the common used parameters (N=20 rev/sec, IT=35o BTDC, T= 9 1 N.m and CR= 22). It is used as a reference base line for all cases.
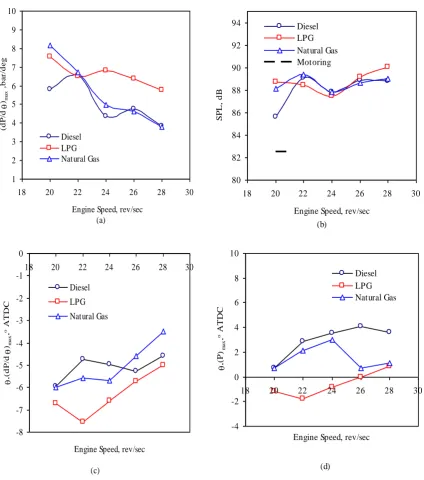
A. Effect of engine speed on engine noise
Figure 3 shows the effect of engine speed ranging from 20 to 28 rev/sec in speed increments of 2 rev/sec, while other engine operating conditions were kept constant: CR=22, IT= 35 oBTDC and T= 9 1 N.m.
Figure 3-a illustrates that for all used fuels, the higher the engine speed the lower the pressure rise rate generated which represent lower combustion noise. This reduction in combustion noise may be explained by the improved mixing between air and gaseous fuel which enables the combustion to start smoothly and produces lower pressure rise rate. Meanwhile, figure 3-b shows a slight increase in the overall engine noise level measured as averaged sound pressure level (combustion, mechanical and intake/exhaust flow turbulence noise). The increase in engine overall noise with the increase in the engine speed may be postulated to some factors. These factors include the increase in the intake and exhaust flow turbulence and noise as the engine runs at a faster speed. The injection pump, injectors valves and gears produces more noise as they run at a higher speed. The summation of mechanical and flow noises become more dominant over the combustion induced noise which is shown as an increase in the SPL produced near the engine. This result indicated that the combined noise level due to mechanical and flow turbulence is higher for higher engine speed, under the used operating conditions for all used fuels. This may suggest that for higher engine speed a higher fuel and air flow rate is required which in turn increases the level of mixing and flow noise due to higher turbulence levels. One point to notice, the LPG results indicate higher combustion noise than the two other fuels. Where the maximum level of noise was about 90 dB for LPG corresponding to engine speed of 28 rev/sec, and the minimum level of noise about 85 dB for single diesel fuel corresponding to engine speed of 20 rev/sec.
Figures 3-c and d are showing the location (as crank angle after the top dead centre) of both the maximum pressure rise rate ((dP/dθ)max) and the max cylinder pressure (Pmax) point TABLE I
Ricardo E6 Engine specifications
Model Ricardo E6
Type IDI with the pre-combustion
chamber
Number of cylinders 1
Bore 76.2 mm
Torque Capacity Max16 N.m
Stroke 111.1 mm
Swept Volume 0.507 liters
Max. Speed 50 rev/sec (3000 rpm)
Max. Power, Diesel (CR = 20.93)
9.0 kW, Naturally Aspirated
Compression Ratio (CR) Max. CR 22
with respect to the engine crank angle. A clear trend can be noticed from the two graphs, where engine speeds are directly proportional affects the location of these two parameters. The increase in the engine speed tends to increase the crank of Pmax and (dP/dθ)max w.r.t. top dead centre i.e. the combustion tends to be slower. This may be explained by the reduction of maximum pressure rise rate shown in figure 3-a. Also shown in the same two figures that the dual fuel engine that uses LPG produces the highest combustion rate as its curve lies in the bottom of others in figures 3-c and d. The reason can be the higher pressure rise rate shown in figure 3-a as it has the highest tendency of self-ignition compared to natural gas or diesel fuel. As the combustion becomes faster for LPG dual fuel engine, as shown in the two figures, the angle of maximum pressure rise rate and maximum pressure becomes far away from the top dead centre in the compression stroke. For LPG case, it is noticed from figure 3-d that the maximum pressure occurs before the top dead centre i.e. during the compression stroke. This is especially true for lower engine speeds which tend to reduce the indicated mean effective pressure. This would give less output and lower efficiency at low speeds and part loads. Increasing the engine speed improves the indicated mean effective pressure as the occurrence of maximum pressure becomes at or after the top dead centre.
If the natural gas is to be used in the dual fuel engine then there is no attenuation for the output work when the engine speed is reduced (part load). If, however, LPG is to be used in dual fuel engine, then the output work and efficiency will suffer at low engine speeds.
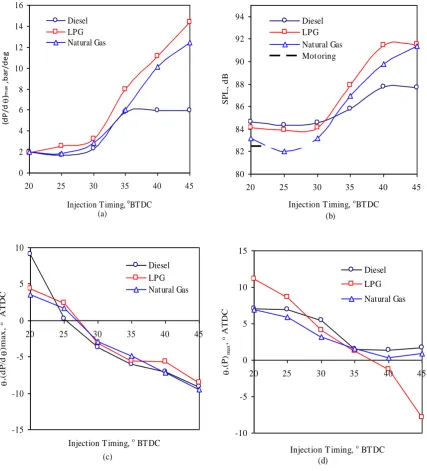
B. Effect of injection timing on Engine Noise
Figure 4 shows the effect of injection timing ranging from 20o to 45o BTDC in increments of 5o , all other engine operating conditions were kept constant: N=20 rev/sec, CR=22, and T= 9 1 N.m.
From figure 4-a it can be seen that for all used fuels, the higher the injection timing angle (the earlier the fuel injected from TDC) the higher the pressure rise rate generated which represent higher combustion noise. As the fuel is injected earlier before the TDC, the compression temperatures will be slightly lower, hence the pilot diesel fuel may exhibits longer ignition delay period and this can increase the combustion pressure rise rate of bigger mass of fuel injected. As mentioned above, and at any injection timing, the LPG exhibited higher pressure rise rate over the natural gas or single diesel fuel.
Meanwhile, figure 4-b shows an increase in the overall engine noise level measured as averaged sound pressure level as the injection timing becomes more advanced (higher angles). As this is the overall noise emitted from the engine and referring to figure 4-a, it can be summarized that the overall engine noise would follow the combustion noise. As the engine speed is fixed during this test, the mechanical and flow noises are constant, hence the increase in the combustion noise with injection timing would increase the overall noise.
Similar to the previous case LPG fuel generates the highest noise levels compared to the other two fuels for the same injection timing, where the maximum averaged sound pressure level of 92 dB is measured corresponding to IT of 45o BTDC.
Figures 4-c and d show the location (crank angle) of both the maximum pressure rise rate and the max cylinder pressure point with respect to the engine crank angle. A clear trend can be noticed from the two graphs, that the advance in the injection timing of the pilot diesel fuel lead to an early occurrence of the maximum pressure rise rate and maximum pressure (the crank angle becomes higher in negative i.e. before top dead centre). The occurrence of maximum pressure after TDC (from injection timing of 20 till 40o BTDC) means more positive work would result from the engine cycle, whereas the occurrence before TDC (for injection timing greater than 40oBTDC) would give more negative work and less work output. The occurrence of the maximum pressure earlier and earlier with increasing the injection timing advance is a result of the increased pressure rise rate shown in figure 4a.
If the natural gas or LPG is to be used in the dual fuel engine then there is no attenuation for the output work or efficiency when the pilot injection timing is less than 40o BTDC. If, however, injection timing is advanced at 40o or more BTDC, then the output work and efficiency will suffer at low engine speeds. Therefore it is advisable to retard the injection timing for dual fuel engine to 35o or less BTDC.
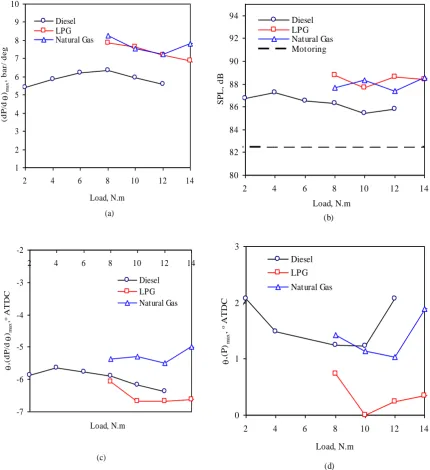
C. Effect of compression ratio on engine noise
Figure 5 shows the effect of compression ratio ranging from 16 to 22 in increments of 2, where the other engine operating conditions were kept constant: N=20 rev/sec, IT=35o, and T= 9 1 N.m.
Figure 5-a shows the variation of the maximum pressure rise rate with compression ratio for the three fuels tested. It may be seen from the figure that increasing the compression ratio generally increases the maximum pressure rise rate (measure of combustion noise) for dual engine that uses natural gas, however, for single diesel fuel or dual fuel with LPG it was slightly fluctuating. The dual fuel with natural gas case exhibited the lowest combustion noise at low compression ratios, however, it increased at the highest compression ratio of 22 even over the diesel case. However, LPG with its low ignition temperature (lower than natural gas) exhibits higher pressure rise rates at all compression ratios. The LPG has the tendency to self-ignite and produce high pressure rise rate. The overall engine averaged sound pressure level may be seen in figure 5-b for the three tested fuels. It may be seen that the
The location of both the maximum pressure rise rate and maximum pressure can be seen in figure 5-c and d. As expected the increase of the compression ratio causes these angles to become earlier and earlier. Almost all maximum pressure points shown in figure 5-d occurs at angles higher than 0 (i.e. in the expansion stroke). This is beneficial in improving the work output and efficiency of the dual fuel engine. The reduction in compression ratio of dual fuel engine would decrease the overall noise (figure 5-b) as well as improving the output work and efficiency since the maximum pressure would occur in the expansion stroke (figure 5-d).
D. Effect of engine load on engine noise
Figure 6 shows the effect of different loads ranging from 2 to 14 N.m. The operating parameters of the engine were kept constant at: N=20 rev/sec, IT= 35o BTDC, CR=22.
It may be seen from figures 6-a and b that the maximum pressure rise rate as well as the overall noise was almost the same for all loads tested. The load is varied by keeping the mass of pilot fuel fixed and the mass of gaseous fuel has been changed. As the engine speed, injection timing and compression ratio were kept constant, then the noise would become the same too regardless of the increased amount of gaseous fuel. As the operating parameters which controls the delay period of liquid diesel fuel were kept constant then the pilot fuel would ignite at the same timing and burn the gaseous fuel. This is fortune for the dual fuel engine as the engine would give the same noise with increased power output.
The location of maximum pressure rise rate and maximum pressure are depicted in figures 6-c and d respectively. It can bee seen that the location of those two values are almost the same at different loads. This may be postulated to the fact that the engine design and operating parameters were kept constant then the pressure history and locations may stay the same. As the engine operating parameters were as mentioned above for this test, the location of maximum pressure always occurred after the top dead centre (figure 6-d).
E. Effect of pilot fuel flow rate on engine noise
Figure 7 shows the effect of different pilot fuel mass flow rates at constant gaseous fuel mass flow rate, the operating parameters were set to the following constant values: N=20 rev/sec, CR=22, and IT= 35o BTDC. The mass of gaseous fuel flow rate was kept constant and only the pilot diesel fuel was varied.
Figure 7-a illustrates the maximum pressure rise rate for different pilot fuel masses. As the quantity (m’gas /m’pilot) increases from 0 to 24, the mass of pilot fuel is actually reduced – as the gaseous fuel mass was kept constant. So, as the mass of pilot is increased (going from right to left), the maximum pressure rise rate is clearly reduced for both the natural gas and LPG. The reason for this reduction is the increase in the pilot fuel mass injected, which in turns, generates bigger pilot flame that burns the gaseous fuel smoothly with lower pressure rise rate. However, the pressure rise rate for LPG dual fuel engine was higher than that for
natural gas as explained before. The engine overall noise for different mass of pilot fuel is given in figure 7-b for both fuels. It is evident that the engine overall noise follows the combustion noise as the engine flow and mechanical noises were the same for these constant engine conditions.
The location of maximum pressure rise rate and maximum pressure may be seen in figures 7-c and d. It may be seen that the location of maximum pressure tends to become closer to top dead centre as the mass of pilot decreased due to the increased pressure rise rate.
F. Results repeatability verifications
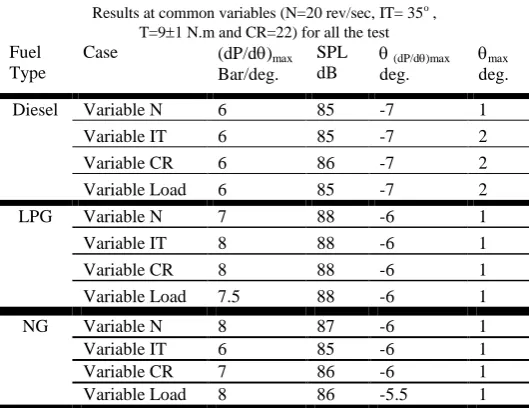
By reviewing all previous results in an attempt to verify the repeatability of the measurements, the results of the common operating parameters for all cases were reported in table 2. The common parameters used are: N=20 rev/sec, IT=35o BTDC, T= 91 N.m and CR= 22.
TABLE II
Results at common variables (N=20 rev/sec, IT= 35o ,
T=91 N.m and CR=22) for all the test
Fuel Type
Case (dP/d)max
Bar/deg.
SPL dB
(dP/d)max
deg.
max
deg.
Diesel Variable N 6 85 -7 1
Variable IT 6 85 -7 2
Variable CR 6 86 -7 2
Variable Load 6 85 -7 2
LPG Variable N 7 88 -6 1
Variable IT 8 88 -6 1
Variable CR 8 88 -6 1
Variable Load 7.5 88 -6 1
NG Variable N 8 87 -6 1
Variable IT 6 85 -6 1
Variable CR 7 86 -6 1
Variable Load 8 86 -5.5 1
The tabulated results are showing a very good repeatability of the measurements, which gives a better confident in the measurements. The small variation in the reported results is with the expected data reduction error level. The variation in the results can be explained due to the variability of the engine facility where a variation of 1 N. m of engine loads were noticed. Plotting all values of engine overall noise as averaged sound pressure level against all points of maximum pressure rise rate for all experiments presented also show a clear relation between the two quantities as shown in figure 8.
IV. CONCLUSIONS
From the presented results for the dual fuel engine with either the natural gas or LPG as the main fuel and comparing these cases with single diesel fuel case, the following conclusions can be withdrawn:
flow turbulence and mechanical moving parts. Among the three used fuels, the LPG fuel generates the highest level of combustion noise and overall noise levels, compared to natural gas, for different engine speeds. The maximum SPL levels for LPG, NG and diesel fuels are 90, 88 and 88 dB respectively corresponding to 28 rev/sec speed.
2. For all used fuels: single diesel and dual fuels, the location of the maximum cylinder pressure and maximum pressure rise rate are directly affected by the tested variables e.g. engine speed, injection timing, compression ratio and pilot fuel mass.
3. For all used fuels, advancing the injection timing of pilot fuel increases the overall engine’s noise level and the combustion noise level (dP/d)max. Dual fuel cases are showing higher levels of noise comparing to the diesel fuel especially at early injection timing. The maximum SPL levels for LPG, NG and diesel fuels are 93, 93 and 86 dB respectively corresponding to 45o BTDC injection timing. 4. For all used fuels: diesel and dual fuels, the location of the
maximum cylinder pressure and maximum pressure rise rate are inversely proportional with the injection timing advance. 5. Increasing the compression ratio increases the overall engine’s noise level and the combustion noise level (dP/d) max, for all used fuels. LPG fuel is showing higher levels of noise compared to the diesel and NG fuel. The maximum SPL levels for LPG, NG and diesel fuels are 88, 87 and 87 dB respectively corresponding to 22 compression ratio. 6. Dual fuels experience higher noise levels compared to
single diesel fuel as the load is increased by increasing the gaseous fuel with fixed diesel flow rate. The higher the loading the lower SPL is generated. Maximum SPL where generated about 88 dB for the dual fuel and 86 dB for the diesel fuel at lading of 8 N.m.
7. Increasing the amount of pilot fuel mass reduces the engine combustion and overall noise.
8. The engine overall noise may be reduced to follow the noise emission standards by controlling the engine design and operating parameters e.g. speed, injection timing, compression ratio and pilot fuel mass.
REFERENCES
[1] Priede T. 1980 SAE 800534, 2039-2069. ―In Search of Origin of
Engine Noise- An Histrorical Review‖.
[2] M. Y. E. Selim, Pressure – Time Characteristics of Diesel Engine
Fuelled with Natural gas, Renewable Energy Journal, Oct-2000, volume 22, issue 4, Pages 473-489
[3] Schaberg P. W., Priede T. And Dutkiewicz R. K. 1990 SAE 900013,
1-13 ―Effects of Rapid Pressure Rise on Engine Vibration and Noise‖.
[4] Priede T. 1979 SAE 790205, 783-797. ―Problems and Developments in
Automative Engine Noise Research‖.
[5] M. T. Ghannam and M. Y. E. Selim, Stability Behavior of
Water-in-Diesel Fuel Emulsion, Petroleum Science and Technology Journal, 27:396–411, 2009
[6] Mohamed Y. E. Selim, and Mamdouh Ghannam, A Combustion Study
of Stabilized Water-in-Diesel Fuel Emulsion,, Energy Sources Journal,
Part A, Recovery, Utilization, and Environmental Effects, 32: 1-19, 2010
[7] Mohamed, Y. E. Selim, Salah B. Al-Omari and Abdallah J. Al-Aseery,
Effects of Steam Injection to Dual Fuel Engine on Performance, Noise and Exhaust Emission, SAE Paper 2009-01-1831 / 09SFL-0039, SAE 2009 Powertrains, Fuels & Lubricants Meeting, Florence, Italy, June 15 – 17, 2009.
[8] H. A. Moneib, M. Abdelaal, Mohamed Y. E. Selim, and O. A.
Abdallah, NOx Emission Control in SI Engine by Adding Argon Inert Gas to Intake Mixture, Energy Conversion and Management Journal, Vol. 50, Issue 11, pp. 2699-2708, November 2009.
[9] M. Y. E. Selim, Effect of Exhaust Gas Recirculation on Some
Combustion Characteristics of Dual Fuel Engine, Energy Conversion and Management, An International Journal, Volume 44, Issue 5, March 2003, Pages 709-723, 2003.
[10] Mohamed Y. E. Selim, A Study of Some Combustion Characteristics
of Dual Fuel Engine Using EGR, SAE Paper 2003-01-0766, Transactions of SAE, Journal of Engines, 2003.
[11] Mohamed Y. E. Selim, H.E. Saleh and M. S. Radwan, On the Use of
Jojoba Methyl Ester as Pilot Fuel in Dual Fuel Engines, Renewable Energy Journal, Volume 33, Issue 6, June 2008, Pages 1173-1185
[12] H. E. Saleh and Mohamed Y. E. Selim, Shock tube investigation of
propane-air mixtures with a pilot diesel fuel or cotton methyl ester, Accepted in Fuel, Int. Journal, September 2009.
[13] Mohamed Y. E. Selim and H. E. Saleh, Performance of Dual Fuel
Engine Running on Jojoba Oil as Pilot Fuel and CNG or LPG, 2007 ASME-JSME Thermal Engineering Summer Heat Transfer Conference July 8-12, 2007, Vancouver, British Columbia, CANADA
[14] 14. Mohamed Y. E. Selim, Effects of Engine Parameters and Gaseous
Fuel Type on the Cyclic Variability of Dual Fuel Engines, Fuel, an Int. Journal, 84, 961-971, 2005.
[15] 10. Mohamed Y. E. Selim, A Study of Some Combustion
Characteristics of Dual Fuel Engine Using EGR, SAE Paper 2003-01-0766, Transactions of SAE, Journal of Engines, 2003.
[16] 11. Mohamed Y. E. Selim, H.E. Saleh and M. S. Radwan, On the Use
of Jojoba Methyl Ester as Pilot Fuel in Dual Fuel Engines, Renewable Energy Journal, Volume 33, Issue 6, June 2008, Pages 1173-1185
[17] 12. H. E. Saleh and Mohamed Y. E. Selim, Shock tube investigation
of propane-air mixtures with a pilot diesel fuel or cotton methyl ester, Accepted in Fuel, Int. Journal, September 2009.
[18] 13. Mohamed Y. E. Selim and H. E. Saleh, Performance of Dual Fuel
Engine Running on Jojoba Oil as Pilot Fuel and CNG or LPG, 2007 ASME-JSME Thermal Engineering Summer Heat Transfer Conference July 8-12, 2007, Vancouver, British Columbia, CANADA
[19] 14. Mohamed Y. E. Selim, Effects of Engine Parameters and Gaseous
Fuel Type on the Cyclic Variability of Dual Fuel Engines, Fuel, an Int. Journal, 84, 961-971, 2005.
[20] 15. Mohamed Y. E. Selim, Sensitivity of Dual Fuel Engine
Combustion and Knocking Limits to Gaseous Fuel Composition, Energy Conversion and Management, An International Journal, Volume 45, Issue 3, pp. 411-425, 2004.
[21] 16. Panya Warapetcharayut‖ Control Strategy for Mobile Source in
Thailand‖, Director of Automotive Air Pollution Section Air Quality and Noise Management Bureau Pollution Control Department Ministry of Natural Resources and Environment, ([email protected]), 2005.
[22] 17. Standardization Organization for G.C.C (GSO), ―Motor Vehicles,
Noise Emissions ―, GSO 1624/2009 - 13.040.99
[23] 18. Galinsky G., Reader G. T., Potter I. J., and Gustafson R. W. ―The
Effect of Various Working Fluid Compositions on Combustion Noise in Diesel Engine, AIAA -94- 3996- CP.
[24] 19. Zhang Jun Hong, Han Bing "Analysis of engine front noise using
(a) 0 10 20 30 40 50 60 70 80 90 100
-100 -50 0 50 100
CA,deg
dB
Combustion Engine Noise
Motoring Engine Noise Back Ground Noise
(b) -5
0 5 10 15 20 25 30 35
-100 -50 0 50 100
CA,deg
PCy,Bar dP/d q, Bar/deg CA,deg
Pcyl,bar
dP/d,bar/deg
CA Pulse
(d) -20 -10 0 10 20 30 40 50
-150 -100 -50 0 50 100
CA,deg PCy,Bar
dP/dthet Pcyl,bar dP/d,bar/deg
Fig. 2. Typical (a) SPL diagram for background, motoring and combustion noise levels, (b) motoring cylinder pressure and pressure rise rate diagram, (c) cylinder pressure and pressure rise rate diagram, and (d) cylinder pressure and pressure rise rate diagram with
knocking.
(a) 1
2 3 4 5 6 7 8 9 10
18 20 22 24 26 28 30
Engine Speed, rev/sec
(d
P
/d
)ma
x
,
b
a
r/
d
e
g
Diesel LPG Natural Gas
(b) 80
82 84 86 88 90 92 94
18 20 22 24 26 28 30
Engine Speed, rev/sec
S
P
L
,
d
B
Diesel LPG Natural Gas Motoring
(c) -8
-7 -6 -5 -4 -3 -2 -1 0
18 20 22 24 26 28 30
Engine Speed, rev/sec
,(
d
P
/d
)ma
x
,
o A
T
D
C
Diesel
LPG Natural Gas
(d) -4
-2 0 2 4 6 8 10
18 20 22 24 26 28 30
Engine Speed, rev/sec
,(
P
)m
a
x
,
o A
T
D
C
Diesel LPG Natural Gas
Fig. 3. The effect of engine speed on the (a) the engine pressure rise rate with respect to engine crank angle, (b) generated over all averaged sound pressure level, (c) the optimum crank angle corresponding to maximum pressure rise rate, and (d) the optimum crank
(a) 0
2 4 6 8 10 12 14 16
20 25 30 35 40 45
Injection T iming,oBT DC
(d
P
/d
)
m
ax
,
b
a
r/
d
e
g
Diesel LPG Natural Gas
(b) 80
82 84 86 88 90 92 94
20 25 30 35 40 45
Injection T iming, oBT DC
S
P
L
,
d
B
Diesel LPG Natural Gas Motoring
(c) -15
-10 -5 0 5 10
20 25 30 35 40 45
Injection T iming, o BT DC
,(
d
P
/d
)m
a
x
,
o
A
T
D
C
Diesel LPG Natural Gas
(d) -10
-5 0 5 10 15
20 25 30 35 40 45
Injection T iming, o BT DC
,(
P
)m
a
x
,
o A
T
D
C
Diesel
LPG
Natural Gas
Fig. 4. The effect of Injection Timing on the (a) the engine pressure rise rate with respect to engine crank angle, (b) the generated over all averaged sound pressure level, (c) the optimum crank angle corresponding to maximum pressure rise rate, and (d) the optimum crank
(a) 1
2 3 4 5 6 7 8 9 10
14 16 18 20 22 24
Compression Ratio
(d
P
/d
)ma
x
,
b
a
r/
d
e
g
Diesel LPG Natural Gas
(b) 80
82 84 86 88 90 92 94
14 16 18 20 22 24
Compression Ratio
S
P
L
,
d
B
Diesel LPG Natural Gas Motoring
(c) -10
-5 0 5 10 15 20
14 16 18 20 22 24
Compression Ratio
,(
d
P
/d
)ma
x
,
o A
T
D
C
Diesel LPG Natural Gas
(d) -2
0 2 4 6 8 10 12 14 16 18
14 16 18 20 22 24
Compression Ratio
,(
P
)m
ax
o A
T
D
C
Diesel LPG Natural Gas
Fig. 5. The effect of Engine Compression Ratio on the (a) the engine pressure rise rate with respect to engine crank angle, (b) the generated over all averaged sound pressure level, (c) the optimum crank angle corresponding to maximum pressure rise rate, and (d) the
(a) 1
2 3 4 5 6 7 8 9 10
2 4 6 8 10 12 14
Load, N.m
(d
P
/d
)ma
x
,
b
a
r/
d
e
g
Diesel LPG Natural Gas
(b) 80
82 84 86 88 90 92 94
2 4 6 8 10 12 14
Load, N.m
S
P
L
,
d
B
Diesel LPG Natural Gas Motoring
(c) -7
-6 -5 -4 -3 -2
2 4 6 8 10 12 14
Load, N.m
,(
d
P
/d
)ma
x
,
o A
T
D
C
Diesel LPG Natural Gas
(d) 0
1 2 3
2 4 6 8 10 12 14
Load, N.m
,(
P
)m
a
x
,
o A
T
D
C
Diesel LPG
Natural Gas
Fig. 6. The effect of different loads on (a) the engine pressure rise rate with respect to engine crank angle, (b) the generated over all averaged sound pressure level, (c) the optimum crank angle corresponding to maximum pressure rise rate, and (d) the optimum crank
(a) 1
2 3 4 5 6 7 8 9 10
0 4 8 12 16 20 24
m'gas/m'pilot
(d
P
/d )max
,
b
ar
/d
eg
LPG
Natural Gas
(b)
80 82 84 86 88 90 92 94
0 4 8 12 16 20 24
m'gas/m'pilot
S
P
L
, dB
LPG Nat ural Gas Mot oring
(c) -7
-6 -5 -4 -3 -2
0 4 8 12 16 20 24
m'gas/m'pilot
,(
d
P
/d
)max
,
o A
T
D
C
LPG Natural Gas
(d) 0
1 2 3 4 5
0 4 8 12 16 20 24
m'gas/m'pilot
,(
P
)max
,
o A
T
D
C
LPG Nat ural Gas
Fig. 7. The effect of different gas fuel mass flow rate on the (a) the engine pressure rise rate with respect to engine crank angle, (b) the generated over all averaged sound pressure level, (c) the optimum crank angle corresponding to maximum pressure rise rate, and (d) the
optimum crank angle corresponding to maximum cylinder pressure. For N= 20 rev/sec, IT= 35o BTDC and CR= 22.
80 82 84 86 88 90 92 94
0 2 4 6 8 10 12 14 16
(dP /d )max, bar/deg
SP
L
, d
B
Diesel