R E S E A R C H
Open Access
Transcriptomic evidence of a
para-inflammatory state in the middle aged
lumbar spinal cord
William Galbavy, Yong Lu, Martin Kaczocha, Michelino Puopolo, Lixin Liu and Mario J. Rebecchi
*Abstract
Background:We have previously reported elevated expression of multiple pro-inflammatory markers in the lumbar
spinal cord (LSC) of middle-aged male rats compared to young adults suggesting a para-inflammatory state develops in the LSC by middle age, a time that in humans is associated with the greatest pain prevalence and persistence. The goal of the current study was to examine the transcriptome-wide gene expression differences between young and middle aged LSC.
Methods:Young (3 month) and middle-aged (17 month) naïve Fisher 344 rats (n= 5 per group) were euthanized, perfused with heparinized saline, and the LSC were removed.
Results:~70% of 31,000 coding sequences were detected. After normalization, ~ 1100 showed statistically significant differential expression. Of these genes, 353 middle-aged annotated genes differed by > 1.5 fold compared to the young group. Nearly 10% of these genes belonged to the microglial sensome. Analysis of this subset revealed that the principal age-related differential pathways populated are complement, pattern recognition receptors, OX40, and various T cell regulatory pathways consistent with microglial priming and T cell invasion and modulation. Many of these pathways substantially overlap those previously identified in studies of LSC of young animals with chronic inflammatory or neuropathic pain.
Conclusions:Up-modulation of complement pathway, microglial priming and activation, and T cell/antigen-presenting cell communication in healthy middle-aged LSC was found. Taken together with our previous work, the results support our conclusion that an incipient or para-inflammatory state develops in the LSC in healthy middle-aged adults.
Keywords:Transcriptome, Aging, Spinal cord, Microglia, Neuropathic, Complement, T-cell, Inflammation
Background
Numerous studies have documented age-related inflam-matory marker expression in the central nervous system (CNS), particularly of pro-inflammatory cytokines inter-leukin 1β(IL1β), tumor necrosis factorα(TNFα) and IL6, as well as microglial activation markers Cd11b (C3A re-ceptor) and MHCII and the astrogliosis marker glial fibril-lary acidic protein (GFAP) in various brain regions of healthy animals, including rats, mice, primates and in post-mortem human samples [1–4]. Challenging the senescent CNS with stimuli that mimic infection or stress, such as LPS, induce exaggerated neuroinflammatory
responses [4, 5]. These results suggested a pre-existing in-cipient or para-inflammatory state that predisposes the CNS to deleterious neurotoxic response in older animals and humans, and have led to the idea that the CNS under-goes a process of“inflammaging”, with important implica-tions for neurodegenerative disorders, such as Alzheimer’s dementia and Parkinson’s disease [2, 6, 7].
While the effects of aging on inflammatory marker expression in various brain regions are well established, few studies have examined the spinal cord, particularly of animals corresponding to middle-age, a time when chronic pain incidence and persistence reach a maximum in the human populations [8–13]. We have recently demon-strated that changes in expression patterns of inflammatory markers indicate that a para-inflammatory state in the * Correspondence:[email protected]
Department of Anesthesiology, School of Medicine, Health Sciences Center L4, Stony Brook University, Stony Brook, New York 11794-8480, USA
lumbar spinal cords (LSC) arises by middle age in healthy rats [14]. This is accompanied by remarkable changes in dorsal horn microglial morphology rarely seen in young adult LSC, that indicated activated M1 and M2 morph-ologies (shortened, thickened processes, decreased arborization, and hypertrophic cell bodies). In the present study we compared the transcriptomic expression of whole lumbar spinal cords of healthy middle-aged male rats to those of young adults. The results provide further support for a para-inflammatory status in the LSC by middle age and point to development of microglial states previously associated with establishment of neuropathic or inflammatory pain.
Methods
Perfusion, tissue harvesting, RNA extraction and purification
All work conformed to the National Institutes of Health Guidelines for the Care and Use of Laboratory Animals and were approved by the Stony Brook University Institutional Animal Care and Use Committee and conducted under protocol #203692-23. Three-month and 17-month old Fisher 344 rats were were euthanized and transcardially perfused with heparinized saline-buffered with 5 mM H2NaPO4to pH 7. LSC were rapidly removed and immediately frozen on dry ice and stored at -80 °C. Total RNAs were extracted from LSC using Qiazol extrac-tion, and further purified with RNeasy spin columns following the manufacturer’s directions and as described previously [14]. Briefly, frozen tissues were placed on ice, Qiazol lysis reagent (Qiagen) was added immediately along with three or six 2.3 mm silica/zirconia beads (DRG and LSC, respectively), and homogenized in a BioSpec mini bead beater for 1.5 min and allowed to stand on ice for 5 min. Chloroform was added to comprise 1/5 of the total volume, and samples were mixed vigorously for 2 min and allowed to settle for 2 min before being centrifuged at 12,000 X g for 15 min at 4 °C. The upper aqueous phase was saved, mixed 1:1 with 70% ethanol, and subjected to RNeasy spin column purification (Qiagen). Final concentrations and 230/260/280 ratios were deter-mined by nanodrop absorbancy using an Eppendorf BioSpectrometer.
Transcriptomic analysis
The RNA’s were reversed transcribed, and then, using an in vitro transcription reaction, biotinylated nucleotides were incorporated, converting the cDNA to labeled cRNA. The cRNA pool was purified, fragmented and then hybridized to Rat Genome 230 2.0 arrays (Affyme-trix) displaying over 31,000 probe sets, representing 30,000 transcripts and variants from over 28,000 well-substantiated rat genes. Hybridized chips were washed, incubated with fluorescently labeled streptavidin probe,
laser scanned and probe fluorescence intensities were measured. Quality control analysis was performed using the affyQCReport package in Bioconductor. CEL files were quantified and normalized using GenePattern ExpressionFileCreator function at the setting of RMA method and quantile normalization. The relation of sam-ples was displayed in dendrogram that was generated by hclust package in Bioconductor. Comparison of samples was conducted using R statistical project. The FDR values were calculated using the samr package in Bio-conductor. The normalized data were then subjected to t-testing with FDR = 10%. Annotation of probe sets was based on Affymetrix Rat230_2.na34 release.
qPCR Analysis
Primers were designed with Primer3 and synthesized by Eurofins MWG Operon LLC (Louisville, KY, USA). The primer pairs used in the qPCR reactions are listed in Additional file 1. cDNA was synthesized with Quanti-Tect Reverse Transcription Kit (Qiagen, Germantown, MD, USA) using the same mRNA that were used in the microarray measurements. qPCR analysis was performed on an Step-One Plus qPCR equipment (Applied BioSys-tems), using the Quantitect SYBR Green Kit (Qiagen). PCR reactions were followed by melt curve analysis. For data analysis, ΔCt were acquired by subtracting the Ct values of the genes of interest from the Ctof a reference gene (GAPDH) of the corresponding samples. TheΔCt’s for the young and middle-aged groups were subjected to t-testing (one-tailed). Adjustedpvalue for multiple com-parisons was carried out with R using the method of Benjamini and Hochberg [15].
Pathway analysis
The differential expression gene set was subjected to Pathway analysis using IPA software suite. Three hun-dred fifty three differentially expressed, annotated genes that were increased or decreased significantly were imported and analyzed using Canonical pathways. Ad-justed p values were obtained from a modified Fisher test [15] that compared the ratio of differential gene set to number of pathway members obtained to the prob-ability that such a ratio would be found by chance, after correcting for multiple hypothesis testing.
Results
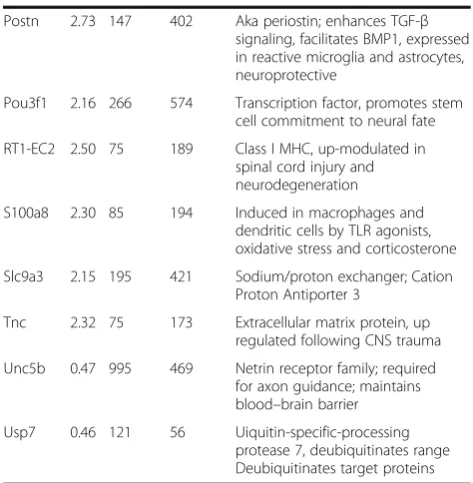
annotated genes with the greatest differential expression. The largest change associated with middle age was ex-pression of Dnajb12 (6.70 fold increase). Dnajb12 and related genes regulate proteasomal degradation of polytopic membrane proteins, particularly ion chan-nels [16]. Gipr transcript, which encodes the recep-tor for gastric inhibirecep-tory polypeptide (GIP), also substantially increased. Agonist analogs of GIP re-duce central oxidative stress, and are neuroprotective in Alzheimer’s disease [17, 18], and stroke models [19]. Gpnmb transcript levels were elevated over three fold. This mRNA encodes a regulator of immune responses expressed in microglia that appears to have anti-inflammatory properties [20]. Among transcripts reduced in middle age, Herc1 participates in membrane trafficking; its loss increases autophagy and decreases mTOR activity associated with Purkinje cell degeneration [21]. Kif1a ex-pression, which is required for BDNF-induced synapto-genesis in the hippocampus [22], was also significantly diminished in middle age.
To confirm the reproducibility and accuracy of the microarray measurements, we performed qPCR analyses on the same sets of samples measuring the relative change in expression (normalized to GAPDH mRNA). Our results (Table 2) show a close correspondence be-tween qPCR and microarray results for 8 differentially expressed genes: Lgals, Fcr2b, GPNMB, C3, Atf3, Ptprc, Cd163 and Nrg1, as well as induction of the microglial activation marker Cd11b.
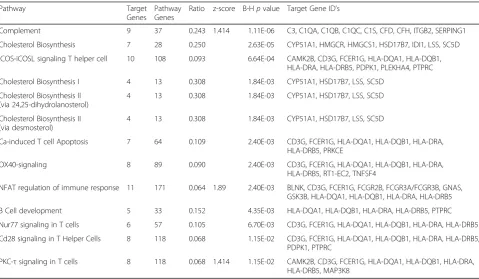
The annotated differential gene set consisting of the 353 transcripts, was subjected to pathway analysis (IPA) using its curated pathway database. Of 13 canonical pathways,
complement cascade had the highest proportion of differ-entially expressed genes and lowest adjusted p value (Table 3). In the complement system, 9 differentially expressed aged-related genes were up modulated out of 37 Complement system members (0.243;p= 1.11 × 10⁻⁶). Members of the Classical pathway, initiated by C1q tion and the Alternative pathway, initiated by C3 activa-tion were well populated. The positive Z-score = 1.414, indicated significant complement pathway activation. On the other hand, expression of several inhibitory compo-nents, Serping1, a C1 esterase inhibitor, and Cfh, which accelerates C3b inactivation, were increased in middle age (1.55 and 1.79 fold, respectively), and could possible suppress these complement activation [23].
Among the remaining 12 pathways, four involved chol-esterol metabolism, while nearly all remaining pathways were related to the T-helper cell/antigen presenting cell (APC) or T cell signaling (Table 3). These other pathways overlapped with common immune cell markers including Cd3g, Ptprc, Fcer1g, and MHC-I and MHC-II related genes. This is well illustrated in the O× 40-signaling pathway, in which APC, such as microglia, present anti-gen in the context of MHC and O× 40 receptor ligand to effector T cells, leading to activation of Nfkb, cJun and PI3K/PKB pathways [24].
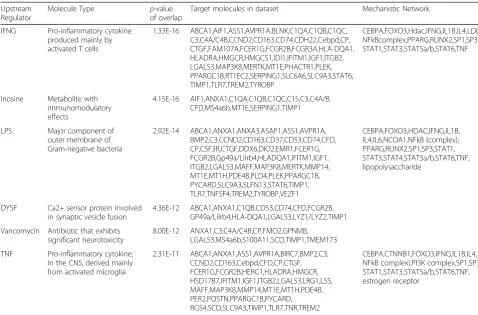
A number of mechanistic regulatory networks were also populated by the differentially expressed gene set (Table 4), including pro-inflammatory mechanistic net-works, IFNG, LPS and TNF. Additionally the inosine network, an immunomodulatory adenosine metabolite, and vancomycin, a neurotoxic antibiotic, were also significantly represented. IFNG, the most well populated Fig. 1Transcript expression ratio’s in middle-aged compared to young LSC. The mRNA transcript expression in the LSC of 3 month and 17-month-old Fisher 344 male rats were assessed and 21,700 probe sets were measureable. Thehorizontal axisindicates the log2ratios of middle
aged over young expression and thevertical axisis the–log10of the FDR correctedpvalues. ~ 1100 transcripts were differentially expressed.Blue
network contained the highest density of predicted inter-actions that correlated to actual changes in target gene expression. This 132-member network, featuring 19 regu-latory nodes, was populated by 59 of the differentially expressed age-related genes (50% of the total, p= 1.24 × 10⁻¹⁶). The entire network was activated in middle age with an overall activation Z-score = 2.711. Differentially expressed genes showed large numbers of regulatory inputs including Atf3, Anxa1, Postn, Cp, Cebpd, Fcgr2b, S100a8, C3, Col2a1, Map3k8 And Ppargc1b. Major regulatory nodes include Ctnnb1, Nfkbia, Nfkb, Smad3, Sp1 and Il4.
The transcriptional mechanistic regulatory networks were also well represented. Ctnnb1, part of the canonical WNT pathway, is a co-activator of TCF/LEF family transcrip-tion factors, which up-modulates expression of WNT-responsive genes [25]. Out of 124 members, this net-work contained 36 of the differentially expressed, age-related genes (p= 3.96 × 10⁻¹²). Major regulatory nodes included Ctnnb1, Pge2, Smad3, Sp1, and Jun. Differen-tially expressed genes having multiple regulatory inputs included Igfbp5, Bmp2, Sox2, Ccnd2, Gja1, Ctgf, Mmp14 and Cxcl9. Overall this transcriptional network was significantly inhibited in middle age (Z-score = -2.377) which could explain the down-modulation WNT-responsive genes: Ccnd2, Gja1, Igf1, Ppap2b, Sox2, and Tcf7l2. On the other hand, two Ctnnb1 genes, that are also STAT regulated, were up modulated in older LSC, as are Stat6 and a synergistic co-activator Cepbd.
Table 1Differential gene expression: largest effect sizes
Gene M/Y Y Mean M Mean Annotation
Abp10 0.46 677 311 Annexin V-binding protein
Aff4 0.45 458 204 Transcription factor and central SEC component
Ago2 0.43 330 141 RISC Catalytic Component 2
Aqp4 0.50 2664 1329 Aquaporin family member
Arl11 2.07 94 195 ADP-ribosylation factor-like 11
Asap1 0.40 524 212 ADP-ribosylation factor (ARF) GTPase-activating protein
Bmpr2 0.46 970 449 Bone morphogenetic protein receptor type II
C3 2.40 830 1996 Central complement component
Chrdl1 2.48 60 148 Ventroptin, antagonizes BMP actions
Clec12a 2.18 99 215 CTL/CTLD member, widely expressed in innate immune system
Cspp1 0.49 207 101 Important for normal neural specific cilia function
Dnajb12 6.70 52 350 DNAJ/HSP40 family member, regulates molecular chaperone activity, protein folding and degradation
Enc1 0.47 135 64 Kelch-related family of actin-binding proteins, role in oxidative stress response, regulates Nrf2
Falz 0.50 482 239 Transcription/epigenetic regulator, up-modulated in neurodegenerative diseases
Fcgr2b 2.89 303 878 Low affinity Fc receptor expressed in microglia
Fcrls 2.78 218 607 Fc receptor; part of TGFb1 microglial signature response
Fmo2 2.35 87 204 Flavin-containing monooxygenase
Fstl3 2.13 66 142 Secreted form binds/antagonizes members of TGF-b family, e.g., BMP2
Gipr 3.49 179 623 Receptor for neuroprotective polypeptide GIP
Golga4 0.42 211 89 Role in Rab6-regulated membrane-tethering events in the Golgi
Gpnmb 3.14 420 1317 Expressed in microglia, inflammatory response gene
Herc1 0.36 294 107 Regulator of membrane trafficking
Kif1a 0.38 3058 1160 Kinesin family protein involved in syaptogenesis
Lgals3 2.44 927 2264 Member galectin family of carbohydrate binding proteins; microglial marker and alt priming gene
Msi2 0.49 304 148 RNA binding protein; role in CNS stem cell proliferation
Nrg1 0.46 553 253 Neuregulin-1, signals through erb2/3 receptors, functions in neural development and plasticity
Pitpnm1 3.50 499 1749 Transfers PtdIns from ER to plasma membrane
Table 1Differential gene expression: largest effect sizes
(Continued)
Postn 2.73 147 402 Aka periostin; enhances TGF-β signaling, facilitates BMP1, expressed in reactive microglia and astrocytes, neuroprotective
Pou3f1 2.16 266 574 Transcription factor, promotes stem cell commitment to neural fate
RT1-EC2 2.50 75 189 Class I MHC, up-modulated in spinal cord injury and neurodegeneration
S100a8 2.30 85 194 Induced in macrophages and dendritic cells by TLR agonists, oxidative stress and corticosterone
Slc9a3 2.15 195 421 Sodium/proton exchanger; Cation Proton Antiporter 3
Tnc 2.32 75 173 Extracellular matrix protein, up regulated following CNS trauma
Unc5b 0.47 995 469 Netrin receptor family; required for axon guidance; maintains blood–brain barrier
Usp7 0.46 121 56 Uiquitin-specific-processing protease 7, deubiquitinates range Deubiquitinates target proteins
Bio-functional networks were also explored. The top functional populated networks were systemic auto-immune syndrome and activated auto-immune cell adhesion and migration (Network 01). This network had the high-est consistency score (10.104) with a total of 21 nodes and 5 regulators and 12 differentially expressed LSC target genes that formed the core of the immune cell regulatory network, under the control of Tmg2, Ifnαr, Gata4, and/or Hbb-b1. Strong relationships included activation of immune cell adhesion and leukocyte chemotaxis involving S100a8, C3 and Cd74 expres-sion, and migration of antigen presenting cells associ-ated with expression of Tyrobp, Il16, S100a4 and C3. All functional network members are listed in Add-itional files 4, 5, 6 and 7.
Multiple other functional networks overlapped Bio-functional Network 01. All were related to immune cell function, adhesion and migration. Network 02 had a
consistency score of 6.640, with 19 nodes, 5 regulators and 12 targets. Interactions stemming from up-modulation by Nfkb complex of C3, Plau, Tnsf4, Map3k8, and Ctgf expression were associated with activation of macrophage migration; whereas, increased expression of C1qa, S100a8, Cd74, Lgals3, C3 and Plau, under Hrg, Tgm2, Nfκbia, or Nfκb complex control, was associated with immune cell adhesion. Functional networks 03 and 04 (consistency scores of 5.078 and 3.618, respectively) overlapped. Network 03, which had 21 nodes, 6 regulators, and 14 target genes, featured Ifng and/or Ifnαr driving expression of Cxcl9, Cd74, C3, S100a8, Stat6 and Aif1 expression associated with leukocyte chemotaxis; whereas Network 04, which had 16 nodes, 3 regulators and 11 targets, featured Tlr9, Tlr3, or transcriptional regulator, Ehf, modulating expression of C3, Map3k8, S100a8, Timp1 and, Abca1 that was asso-ciated with activation of myeloid lineage cell migration.
Table 2Confirmation of microarray results by qPCR
Results Lgals Fcgr2b Gpnmb C3 Atf3 Ptprc Cd163 Nrg1 Cd11b
ΔΔCtM v Y 1.62 1.68 1.76 1.42 0.94 0.99 0.78 −0.79 0.87
qPCR Fold M/Y 3.08 3.20 3.40 2.68 1.92 1.99 1.72 0.58 1.83
Microarray M/Y 2.44 2.89 3.14 2.40 1.73 1.84 1.59 0.46 N/A
Adjustedp-value 0.004 0.003 0.006 0.010 0.004 0.001 0.001 0.056 1.0E-07
cDNA was synthesized from the same RNA samples analyzed in the microarrays.ΔΔCtvalues are expressed as described inMethods
Table 3Canonical pathways populated by the age-related gene set
Pathway Target
Genes
Pathway Genes
Ratio z-score B-Hpvalue Target Gene ID’s
Complement 9 37 0.243 1.414 1.11E-06 C3, C1QA, C1QB, C1QC, C1S, CFD, CFH, ITGB2, SERPING1
Cholesterol Biosynthesis 7 28 0.250 2.63E-05 CYP51A1, HMGCR, HMGCS1, HSD17B7, IDI1, LSS, SC5D
iCOS-iCOSL signaling T helper cell 10 108 0.093 6.64E-04 CAMK2B, CD3G, FCER1G, HLA-DQA1, HLA-DQB1, HLA-DRA, HLA-DRB5, PDPK1, PLEKHA4, PTPRC
Cholesterol Biosynthesis I 4 13 0.308 1.84E-03 CYP51A1, HSD17B7, LSS, SC5D
Cholesterol Biosynthesis II (via 24,25-dihydrolanosterol)
4 13 0.308 1.84E-03 CYP51A1, HSD17B7, LSS, SC5D
Cholesterol Biosynthesis II (via desmosterol)
4 13 0.308 1.84E-03 CYP51A1, HSD17B7, LSS, SC5D
Ca-induced T cell Apoptosis 7 64 0.109 2.40E-03 CD3G, FCER1G, HLA-DQA1, HLA-DQB1, HLA-DRA,
HLA-DRB5, PRKCE
OX40-signaling 8 89 0.090 2.40E-03 CD3G, FCER1G, HLA-DQA1, HLA-DQB1, HLA-DRA,
HLA-DRB5, RT1-EC2, TNFSF4
NFAT regulation of immune response 11 171 0.064 1.89 2.40E-03 BLNK, CD3G, FCER1G, FCGR2B, FCGR3A/FCGR3B, GNAS, GSK3B, HLA-DQA1, HLA-DQB1, HLA-DRA, HLA-DRB5
B Cell development 5 33 0.152 4.35E-03 HLA-DQA1, HLA-DQB1, HLA-DRA, HLA-DRB5, PTPRC
Nur77 signaling in T cells 6 57 0.105 6.70E-03 CD3G, FCER1G, HLA-DQA1, HLA-DQB1, HLA-DRA, HLA-DRB5
Cd28 signaling in T Helper Cells 8 118 0.068 1.15E-02 CD3G, FCER1G, HLA-DQA1, HLA-DQB1, HLA-DRA, HLA-DRB5, PDPK1, PTPRC
PKC-τsignaling in T cells 8 118 0.068 1.414 1.15E-02 CAMK2B, CD3G, FCER1G, HLA-DQA1, HLA-DQB1, HLA-DRA, HLA-DRB5, MAP3K8
The consistency of each network and the overlaps indicate a strong association of these members of the age-related gene expression set with immune cell adhesion and migration.
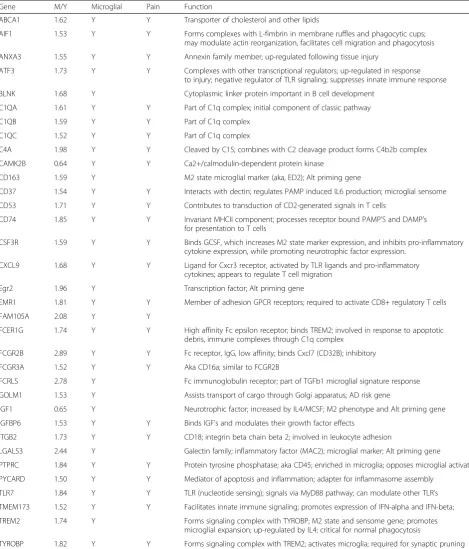
We had previously reported that most microglia of healthy middle-aged rat LSC exhibited a activated morphology compared to young adults [14]. Here we find that nearly 10% of the differential gene set was asso-ciated entirely or primarily with changing patterns of microglial gene expression (Table 5). Approximately 75% of these transcripts were related to microglial activation [26, 27], and substantially overlapped with neuropathic pain-modulated spinal cord genes that were described in previous transcriptomic studies [28, 29]. In addition to microglial associated genes, other neuropathic pain-related transcripts were differentially expressed, yielding a total of 43 such genes or ~12% of the entire age-related LSC transcriptome (annotated).
Discussion
We have previously published cytokine and immune marker gene expression and immunohistochemical evidence that a para-inflammatory state develops in the LSC by middle age [14]. We reported that microglia of
healthy middle-aged rat LSC showed a predominately activated phenotype, whereas astrocyte morphology and GFAP protein levels indicated quiescence [14]. Results also showed that Cd2, Cd3e, Cd68, Cd45, Tnf-α, Il6, Ccl2, Atf3 and Tgfβ1 mRNA levels were substantially elevated. Here we extend that study and report that the transcriptomic changes associated with middle age are dominated by up-modulation of the innate immune sys-tem, including complement, TLR signaling, T-cell/APC interface, microglial priming, and M1 and M2 activation states. A number of other immune regulatory pathways were significantly up modulated including NFAT tran-scriptional pathways, important for neuronal excitation-transcription coupling and neurotrophin signaling [30], and the T-cell/PKC-Tau pathway. Components of other pathways involved in the regulatory interface between APC’s and T-cells were similarly affected with increased expression of components in the OX40, icos-icosL, Nur77, and Cd28 signaling. Many immune regulatory networks were affected by age. Three of the top six net-works control or activate central inflammatory responses involving glia and T-cells, which fit well the view that the innate immune system in the healthy LSC in middle age is in a state of incipient activation.
Table 4Populated upstream regulatory networks
Upstream Regulator
Molecule Type p-value
of overlap
Target molecules in dataset Mechanistic Network
IFNG Pro-inflammatory cytokine produced mainly by activated T cells
1.33E-16 ABCA1,AIF1,ASS1,AVPR1A,BLNK,C1QA,C1QB,C1QC, C3,C4A/C4B,CCND2,CD163,CD74,CDH22,Cebpd,CP, CTGF,FAM107A,FCER1G,FCGR2B,FCGR3A,HLA-DQA1, HLADRA,HMGCR,HMGCS1,IDI1,IFITM1,IGF1,ITGB2, LGALS3,MAP3K8,MERTK,MT1E,PHACTR1,PLEK, PPARGC1B,RT1EC2,SERPING1,SLC6A6,SLC9A3,STAT6, TIMP1,TLR7,TREM2,TYROBP
CEBPA,FOXO3,Hdac,IFNG,IL1B,IL4,LDL, NFkBcomplex,PPARG,RUNX2,SP1,SP3, STAT1,STAT3,STAT5a/b,STAT6,TNF
Inosine Metabolite with immunomodulatory effects
4.15E-16 AIF1,ANXA1,C1QA,C1QB,C1QC,C1S,C3,C4A/B, CFD,MS4a6b,MT1E,SERPING1,TIMP1
LPS Major component of
outer membrane of Gram-negative bacteria
2.92E-14 ABCA1,ANXA1,ANXA3,ASAP1,ASS1,AVPR1A, BMP2,C3,CCND2,CD163,CD37,CD53,CD74,CFD, CP,CSF3R,CTGF,DDX6,DIO2,EMR1,FCER1G, FCGR2B,Gp49a/Lilrb4,HLADQA1,IFITM1,IGF1, ITGB2,LGALS3,MAFF,MAP3K8,MERTK,MMP14, MT1E,MT1H,PDE4B,PLD4,PLEK,PPARGC1B, PYCARD,SLC9A3,SLFN13,STAT6,TIMP1, TLR7,TNFSF4,TREM2,TYROBP,VEZF1
CEBPA,FOXO3,HDAC,IFNG,IL1B, IL4,IL6,NCOA1,NFkB (complex), PPARG,RUNX2,SP1,SP3,STAT1, STAT3,STAT4,STAT5a/b,STAT6,TNF, lipopolysaccharide
DYSF Ca2+ sensor protein involved in synaptic vesicle fusion
4.36E-12 ABCA1,ANXA1,C1QB,CD53,CD74,CFD,FCGR2B, GP49a/Lilrb4,HLA-DQA1,LGALS3,LYZ1/LYZ2,TIMP1
Vancomycin Antibiotic that exhibits significant neurotoxicity
8.00E-12 ANXA1,C3,C4A/C4B,CP,FMO2,GPNMB, LGALS3,MS4a6b,S100A11,SCD,TIMP1,TMEM173
TNF Pro-inflammatory cytokine; In the CNS, derived mainly from activated microglia
2.31E-11 ABCA1,ANXA1,ASS1,AVPR1A,BIRC7,BMP2,C3, CCND2,CD163,Cebpd,CFD,CP,CTGF, FCER1G,FCGR2B,HERC1,HLADRA,HMGCR, HSD17B7,IFITM1,IGF1,ITGB2,LGALS3,LRG1,LSS, MAFF,MAP3K8,MMP14,MT1E,MT1H,PDE4B, PER2,POSTN,PPARGC1B,PYCARD, RGS4,SCD,SLC9A3,TIMP1,TLR7,TNR,TREM2
CEBPA,CTNNB1,FOXO3,IFNG,IL1B,IL4, NFkB complex),PI3K complex,SP1,SP3, STAT1,STAT3,STAT5a/b,STAT6,TNF, estrogen receptor
In a detailed study of the mouse life span, 127 genes were identified as aging-related in brain [31]. Eighteen genes associated with middle age in the spinal cord were similarly modulated in in the mouse brain data set, with
8 of these expressed in microglia. A recent combined transcriptomic and proteomic study of aging brain and liver also reported up-modulation of genes associated with antigen processing and presentation and immune
Table 5Microglial and neuropathic pain-related gene expression
Gene M/Y Microglial Pain Function
ABCA1 1.62 Y Y Transporter of cholesterol and other lipids
AIF1 1.53 Y Y Forms complexes with L-fimbrin in membrane ruffles and phagocytic cups;
may modulate actin reorganization, facilitates cell migration and phagocytosis
ANXA3 1.55 Y Y Annexin family member; up-regulated following tissue injury
ATF3 1.73 Y Y Complexes with other transcriptional regulators; up-regulated in response
to injury; negative regulator of TLR signaling; suppresses innate immune response
BLNK 1.68 Y Cytoplasmic linker protein important in B cell development
C1QA 1.61 Y Y Part of C1q complex; initial component of classic pathway
C1QB 1.59 Y Y Part of C1q complex
C1QC 1.52 Y Y Part of C1q complex
C4A 1.98 Y Y Cleaved by C1S; combines with C2 cleavage product forms C4b2b complex
CAMK2B 0.64 Y Y Ca2+/calmodulin-dependent protein kinase
CD163 1.59 Y M2 state microglial marker (aka, ED2); Alt priming gene
CD37 1.54 Y Y Interacts with dectin; regulates PAMP induced IL6 production; microglial sensome
CD53 1.71 Y Y Contributes to transduction of CD2-generated signals in T cells
CD74 1.85 Y Y Invariant MHCII component; processes receptor bound PAMP’S and DAMP’s
for presentation to T cells
CSF3R 1.59 Y Y Binds GCSF, which increases M2 state marker expression, and inhibits pro-inflammatory cytokine expression, while promoting neurotrophic factor expression.
CXCL9 1.68 Y Y Ligand for Cxcr3 receptor, activated by TLR ligands and pro-inflammatory
cytokines; appears to regulate T cell migration
Egr2 1.96 Y Transcription factor; Alt priming gene
EMR1 1.81 Y Y Member of adhesion GPCR receptors; required to activate CD8+ regulatory T cells
FAM105A 2.08 Y Y
FCER1G 1.74 Y Y High affinity Fc epsilon receptor; binds TREM2; involved in response to apoptotic debris, immune complexes through C1q complex
FCGR2B 2.89 Y Y Fc receptor, IgG, low affinity; binds Cxcl7 (CD32B); inhibitory
FCGR3A 1.52 Y Y Aka CD16a; similar to FCGR2B
FCRLS 2.78 Y Fc immunoglobulin receptor; part of TGFb1 microglial signature response
GOLM1 1.53 Y Assists transport of cargo through Golgi apparatus; AD risk gene
IGF1 0.65 Y Neurotrophic factor; increased by IL4/MCSF; M2 phenotype and Alt priming gene
IGFBP6 1.53 Y Y Binds IGF’s and modulates their growth factor effects
ITGB2 1.73 Y Y CD18; integrin beta chain beta 2; involved in leukocyte adhesion
LGALS3 2.44 Y Galectin family; inflammatory factor (MAC2); microglial marker; Alt priming gene
PTPRC 1.84 Y Y Protein tyrosine phosphatase; aka CD45; enriched in microglia; opposes microglial activation
PYCARD 1.50 Y Y Mediator of apoptosis and inflammation; adapter for inflammasome assembly
TLR7 1.84 Y Y TLR (nucleotide sensing); signals via MyD88 pathway; can modulate other TLR’s
TMEM173 1.52 Y Y Facilitates innate immune signaling; promotes expression of IFN-alpha and IFN-beta;
TREM2 1.74 Y Forms signaling complex with TYROBP; M2 state and sensome gene; promotes
microglial expansion; up-regulated by IL4; critical for normal phagocytosis
TYROBP 1.82 Y Y Forms signaling complex with TREM2; activates microglia; required for synaptic pruning
system responses in senescent rat brains compared to those of young adults (two of the top three functional classifications) [32]. Thirty of the same genes reported here for middle-aged LSC were identified in the 609 dif-ferentially expressed genes in senescent rat brain [32], and 12 of these common genes were related to micro-glial function and/or establishment of neuropathic pain, including a number of complement components.
While our results are consistent with those previously reported for the senescent brain and other aging tissues, few of the genes we report are represented in the differen-tial gene set previously reported for middle-aged and young adult mouse spinal cord [33]. Only 7, Acbd3, Elovl6, Jam2, Matn2, Nedd4, Pank3, Phactr1, and Ryr2 were found in both differential gene sets. Of these, the directions of modulations in 5 (Elovl6, Jam2, Nedd4, Phactr1, Ryr2) were not in agreement. The reasons underlying the lack of consistency with our study is unclear, though species differ-ences may have contributed, as well as the many variables explored in the previous work (age, gender, tissue), that could have reduced the power to reliably identify differen-tially expressed genes in middle-aged mouse spinal cord. In two previous transcriptomic studies of middle-aged brain reported by Loerch and co-workers [34] and by Wood and others [35], only 3 (Csnk2a1, Hmgcr, Sgtb) and 4 (RT1-Ba, RT1-Bb, RT1-Da, Sema3b), respectively, were in common with the differential set reported here, suggesting the changes in middle-aged spinal cord we report here may be unique to the spinal cord. It is also possible that dissimilar platforms could have contributed the lack of overlap.
Up-modulation of the complement pathway activation is one of the most common age [36] or neuropathic pain related changes reported for the CNS [37]. A detailed study of complement component expression in aging mouse forebrain also reported significant increases in C1q and C3 transcript levels [38], similar to those re-ported here. Unlike the LSC, C4 transcript levels were not significantly elevated until 24 months in the mouse forebrain. We also measured significant increases (by qPCR) in transcripts encoding Cd11b or Cr3 (Table 2), a common microglial activation marker and the receptor for C3 complement, which has been reported to increase in a variety of different CNS pathologies [39–41]. While many activating components were up modulated in the middle-aged LSC, so were the transcripts of several counter regulatory components encoding proteins that block formation of C1q protein or increase the degrad-ation of C3a, suggesting that complement activdegrad-ation in middle age could be suppressed.
A substantial fraction of the age-associated LSC tran-scriptome (Table 5) belongs to the microglial sensome [26, 27]. Most identified here are related to M1 or M2 activation states. Cd74 (MHCII invariant chain) encodes a marker of microglial M1 activation [42–44] and is
increased in the brains of aging rodents [27] and non-human primates [45]. MHCII complex, identified in the canonical pathways up modulated in LSC, is key on APC/T-cell interface [24]. Consistent with M1 state acti-vation were the increases in transcripts encoding pro-inflammatory chemokine Cxcl9, Cd16 (Fcgr2a, Fcgr3b), Cd32 (Fcgr2b) and Cd45 (Ptprc) [42–44]. On the other hand, many M2 sub-state activation markers and associ-ated microglial transcripts were also up modulassoci-ated includ-ing Cd163, Trem2, Tyrobp, Lgals3, and Csfr3 [42–44]. Some transcripts identified in the differential gene set are also implicated in activating microglial phagocytosis; these include Trem2, Tyrobp, Fcer1g, Cd32, and Aif1 [44, 46]. Enhanced phagocytosis is associated with M2 activation and with beneficial anti-inflammatory effects and aug-mented recovery/resolution or lower risk of neurodegen-erative changes [42, 46]. Overall the evidence supports the evolution of multiple different microglia activation states during aging in the spinal cord, any one of which could alter the innate immune response to injury or infection, and the trajectory of recovery or resolution.
We also report here a general down modulation of transcripts encoding enzymes involved in cholesterol metabolism including Hmgrc, Hmgcs1, Cyp51, Lss, Sc5d and Scd1; whereas the cholesterol transporter, Abca1, was up-modulated. Implications for spinal cord cholesterol, however, are unclear. Comparable changes have been previously reported, in a study of aging cer-vical spinal cord, that were associated with perturb-ation of cholesterol homeostasis (increased white matter cholesterol ester concentrations) and inflam-matory activation in the cervical spinal cord [47]. Age-related changes in CNS cholesterol metabolism are believed to play a key role in the development of some forms of Alzheimer’s disease and other degenerative disorders [48].
whether our results are relevant to the risks of chronic pain or the failures of current treatments in middle-aged humans will require investigations of post-mortem spinal cords.
Conclusions
Transcriptomic analysis of healthy middle-aged LSC demon-strated up-modulation of complement pathway, microglial priming and activation, and T cell/antigen-presenting cell communication. Taken together with previous work, the results support our conclusion that an incipient or para-inflammatory state develops in the LSC in healthy middle-aged adults.
Additional files
Additional file 1:Primer sequences used in the qPCR measurements. (PDF 34 kb)
Additional file 2:Up and down modulated genes. Description: all genes significantly up or down modulated in LSC comparing young to middle-aged LSC. (XLSX 445 kb)
Additional file 3:Differentially expressed gene set. Description: all annotated genes included in the differentially expressed gene set that were included in the pathway analysis. (XLSX 38 kb)
Additional file 4:Bio-functional Network 01. Description: differentially expressed gene set: pink to red (intensity indicates degree of up-modulation), while green denotes down-modulation). Colors of upstream regulators and downstream biological processes are related to predicted activation states with orange indicating activation and blue denoting inhibition. Lines connecting nodes are orange when leading to activation, blue when inhibition is predicted, and yellow if relationships are not consistent with the downstream node state shown. Gray lines denote lack of evidence to form a prediction. Solid lines show direct relations and dashed indirect. Blunted ends indicate expected inhibition if upstream node is activated. (TIFF 2369 kb)
Additional file 5:Bio-functional Network 02. Description: as for Additional file 4. (TIFF 2216 kb)
Additional file 6:Bio-functional Network 03. Description: as for Additional file 4. (TIFF 2215 kb)
Additional file 7:Bio-functional Network 04. Description: as for Additional file 4. (TIFF 2311 kb)
Abbreviations
APC:Antigen presenting cell; CNS: Central nervous system; LSC: Lumbar spinal cord; qPCR: Quantitative polymerase chain reaction
Acknowledgements Not applicable.
Funding
This research did not receive any specific grant from funding agencies in the public, commercial, or not-for-profit sectors.
Availability of data and materials
All data generated or analyzed during this study are included in this published article (and its Additional files).
Authors’contributions
WG extracted RNA, conducted quality controls, performed qPCR assays, assisted in analyzing the results and helped to write the manuscript; YL performed qPCR assays, assisted in analyzing the results and helped to write the manuscript, MK helped design the study, analyzed data and assisted in editing the manuscript; MP assisted in analyzing the data, and editing the
manuscript; LL helped design the study and edit the manuscript; and MR designed and supervised the study, analyzed data, and edited the manuscript. All authors read and approved the final manuscript.
Competing interests
The authors declare that they have no competing interests.
Consent for publication Not applicable.
Ethics approval and consent to participate Not applicable.
Publisher’s Note
Springer Nature remains neutral with regard to jurisdictional claims in published maps and institutional affiliations.
Received: 8 December 2016 Accepted: 5 April 2017
References
1. Jurgens HA, Johnson RW. Dysregulated neuronal-microglial cross-talk during aging, stress and inflammation. Exp Neurol. 2012;233(1):40–8. doi:10.1016/j. expneurol.2010.11.014. PubMed PMID: 21110971, PubMed Central PMCID: PMC3071456, Epub 2010/11/30S0014-4886(10)00415-2 [pii].
2. Mosher KI, Wyss-Coray T. Microglial dysfunction in brain aging and Alzheimer’s disease. Biochem Pharmacol. 2014;88(4):594–604. doi:10.1016/j. bcp.2014.01.008. PubMed PMID: 24445162, PubMed Central PMCID: PMC3972294, Epub 2014/01/22.
3. Norden DM, Godbout JP. Review: microglia of the aged brain: primed to be activated and resistant to regulation. Neuropathol Appl Neurobiol. 2013; 39(1):19–34. doi:10.1111/j.1365-2990.2012.01306.x. PubMed PMID: 23039106, PubMed Central PMCID: PMC3553257, Epub 2012/10/09.
4. Norden DM, Muccigrosso MM, Godbout JP. Microglial priming and enhanced reactivity to secondary insult in aging, and traumatic CNS injury, and neurodegenerative disease. Neuropharmacology. 2015;96(Pt A):29–41. doi:10.1016/j.neuropharm.2014.10.028. PubMed PMID: 25445485; PubMed Central PMCID: PMC4430467.
5. Sparkman NL, Johnson RW. Neuroinflammation associated with aging sensitizes the brain to the effects of infection or stress.
Neuroimmunomodulation. 2008;15(4–6):323–30. doi:10.1159/000156474. PubMed PMID: 19047808, PubMed Central PMCID: PMC2704383, Epub 2008/12/03000156474 [pii].
6. Franceschi C, Capri M, Monti D, Giunta S, Olivieri F, Sevini F, et al. Inflammaging and anti-inflammaging: a systemic perspective on aging and longevity emerged from studies in humans. Mech Ageing Dev. 2007;128(1): 92–105. doi:10.1016/j.mad.2006.11.016. Epub 2006/11/23.
7. von Bernhardi R, Tichauer JE, Eugenin J. Aging-dependent changes of microglial cells and their relevance for neurodegenerative disorders. J Neurochem. 2010;112(5):1099–114. doi:10.1111/j.1471-4159.2009.06537.x. Epub 2009/12/17JNC6537 [pii].
8. Blyth FM, March LM, Brnabic AJ, Jorm LR, Williamson M, Cousins MJ. Chronic pain in Australia: a prevalence study. Pain. 2001;89(2–3):127–34. Epub 2001/02/13. 9. Blyth FM, Van Der Windt DA, Croft PR. Chronic Disabling Pain: A Significant
Public Health Problem. Am J Prev Med. 2015;49(1):98–101. doi:10.1016/j. amepre.2015.01.008. Epub 2015/06/22.
10. Fernandez-de-las-Penas C, Hernandez-Barrera V, Alonso-Blanco C, Palacios-Cena D, Carrasco-Garrido P, Jimenez-Sanchez S, et al. Prevalence of neck and low back pain in community-dwelling adults in Spain: a population-based national study. Spine. 2011;36(3):E213–9. doi:10.1097/BRS. 0b013e3181d952c2. Epub 2010/11/17.
11. Hoy D, Bain C, Williams G, March L, Brooks P, Blyth F, et al. A systematic review of the global prevalence of low back pain. Arthritis Rheum. 2012; 64(6):2028–37. doi:10.1002/art.34347. Epub 2012/01/11.
12. Leboeuf-Yde C, Nielsen J, Kyvik KO, Fejer R, Hartvigsen J. Pain in the lumbar, thoracic or cervical regions: do age and gender matter? A population-based study of 34,902 Danish twins 20–71 years of age. BMC Musculoskelet Disord. 2009;10:39. doi:10.1186/1471-2474-10-39. PubMed PMID: 19379477, PubMed Central PMCID: PMC2678974, Epub 2009/04/22.
life among younger, middle-aged, and older adults. Clin J Pain. 2005; 21(6):513–23. Epub 2005/10/11.
14. Galbavy W, Kaczocha M, Puopolo M, Liu L, Rebecchi MJ. Neuroimmune and Neuropathic Responses of Spinal Cord and Dorsal Root Ganglia in Middle Age. PLoS One. 2015;10(8):e0134394. doi:10.1371/journal.pone.0134394. PubMed PMID: 26241743, PubMed Central PMCID: PMC4524632, Epub 2015/08/05.
15. Hochberg Y, Benjamini Y. More powerful procedures for multiple significance testing. Stat Med. 1990;9(7):811–8. Epub 1990/07/01. 16. Grove DE, Fan CY, Ren HY, Cyr DM. The endoplasmic reticulum-associated
Hsp40 DNAJB12 and Hsc70 cooperate to facilitate RMA1 E3-dependent degradation of nascent CFTRDeltaF508. Mol Biol Cell. 2011;22(3):301–14. doi:10.1091/mbc.E10-09-0760. PubMed PMID: 21148293, PubMed Central PMCID: PMC3031462, Epub 2010/12/15.
17. Duffy AM, Holscher C. The incretin analogue D-Ala2GIP reduces plaque load, astrogliosis and oxidative stress in an APP/PS1 mouse model of Alzheimer’s disease. Neuroscience. 2013;228:294–300. doi:10.1016/j. neuroscience.2012.10.045. Epub 2012/10/30.
18. Ji C, Xue GF, Li G, Li D, Holscher C. Neuroprotective effects of glucose-dependent insulinotropic polypeptide in Alzheimer’s disease. Rev Neurosci. 2016;27(1):61–70. doi:10.1515/revneuro-2015-0021. Epub 2015/09/10. 19. Han L, Holscher C, Xue GF, Li G, Li D. A novel dual-glucagon-like peptide-1
and glucose-dependent insulinotropic polypeptide receptor agonist is neuroprotective in transient focal cerebral ischemia in the rat. Neuroreport. 2016;27(1):23–32. doi:10.1097/WNR.0000000000000490. Epub 2015/11/12. 20. Huang JJ, Ma WJ, Yokoyama S. Expression and immunolocalization of
Gpnmb, a glioma-associated glycoprotein, in normal and inflamed central nervous systems of adult rats. Brain Behav. 2012;2(2):85–96. doi:10.1002/ brb3.39. PubMed PMID: 22574278, PubMed Central PMCID: PMC3345354, Epub 2012/05/11.
21. Sanchez-Tena S, Cubillos-Rojas M, Schneider T, Rosa JL. Functional and pathological relevance of HERC family proteins: a decade later. Cell Mol Life Sci. 2016;73(10):1955–68. doi:10.1007/s00018-016-2139-8. Epub 2016/01/24. 22. Kondo M, Takei Y, Hirokawa N. Motor protein KIF1A is essential for hippocampal synaptogenesis and learning enhancement in an enriched environment. Neuron. 2012;73(4):743–57. doi:10.1016/j.neuron.2011.12.020. Epub 2012/03/01. 23. Morgan BP, Harris CL. Complement, a target for therapy in inflammatory
and degenerative diseases. Nat Rev Drug Discov. 2015;14(12):857–77. doi:10.1038/nrd4657. Epub 2015/10/24.
24. Croft M, So T, Duan W, Soroosh P. The significance of OX40 and OX40L to T-cell biology and immune disease. Immunol Rev. 2009;229(1):173–91. doi: 10.1111/j.1600-065X.2009.00766.x. PubMed PMID: 19426222, PubMed Central PMCID: PMC2729757, Epub 2009/05/12.
25. Clevers H, Nusse R. Wnt/beta-catenin signaling and disease. Cell. 2012; 149(6):1192–205. doi:10.1016/j.cell.2012.05.012. Epub 2012/06/12. 26. Butovsky O, Jedrychowski MP, Moore CS, Cialic R, Lanser AJ, Gabriely G, et
al. Identification of a unique TGF-beta-dependent molecular and functional signature in microglia. Nat Neurosci. 2014;17(1):131–43.
doi:10.1038/nn.3599. PubMed PMID: 24316888, PubMed Central PMCID: PMC4066672, Epub 2013/12/10.
27. Hickman SE, Kingery ND, Ohsumi TK, Borowsky ML, Wang LC, Means TK, et al. The microglial sensome revealed by direct RNA sequencing. Nat Neurosci. 2013;16(12):1896–905. doi:10.1038/nn.3554. PubMed PMID: 24162652, PubMed Central PMCID: PMC3840123, Epub 2013/10/29. 28. Costigan M, Moss A, Latremoliere A, Johnston C, Verma-Gandhu M, Herbert TA,
et al. T-cell infiltration and signaling in the adult dorsal spinal cord is a major contributor to neuropathic pain-like hypersensitivity. J Neurosci. 2009;29(46): 14415–22. Epub 2009/11/20. doi: 29/46/14415 [pii] 10.1523/JNEUROSCI.4569-09.2009. PubMed PMID: 19923276; PubMed Central PMCID: PMC2813708. 29. Griffin RS, Costigan M, Brenner GJ, Ma CH, Scholz J, Moss A, et al.
Complement induction in spinal cord microglia results in anaphylatoxin C5a-mediated pain hypersensitivity. J Neurosci Nurs. 2007;27(32):8699–708. doi:10.1523/JNEUROSCI.2018-07.2007. Epub 2007/08/10.
30. Kim MS, Shutov LP, Gnanasekaran A, Lin Z, Rysted JE, Ulrich JD, et al. Nerve growth factor (NGF) regulates activity of nuclear factor of activated T-cells (NFAT) in neurons via the phosphatidylinositol 3-kinase (PI3K)-Akt-glycogen synthase kinase 3beta (GSK3beta) pathway. J Biol Chem. 2014;289(45): 31349–60. doi:10.1074/jbc.M114.587188. PubMed PMID: 25231981, PubMed Central PMCID: PMC4223335, Epub 2014/09/19.
31. Jonker MJ, Melis JP, Kuiper RV, van der Hoeven TV, Wackers PF, Robinson J, et al. Life spanning murine gene expression profiles in relation to
chronological and pathological aging in multiple organs. Aging Cell. 2013; 12(5):901–9. doi:10.1111/acel.12118. PubMed PMID: 23795901, PubMed Central PMCID: PMC3772962, Epub 2013/06/26.
32. Orre M, Kamphuis W, Osborn LM, Melief J, Kooijman L, Huitinga I, et al. Acute isolation and transcriptome characterization of cortical astrocytes and microglia from young and aged mice. Neurobiol Aging. 2014;35(1):1–14. doi:10.1016/j.neurobiolaging.2013.07.008. Epub 2013/08/21.
33. Xu X, Zhan M, Duan W, Prabhu V, Brenneman R, Wood W, et al. Gene expression atlas of the mouse central nervous system: impact and interactions of age, energy intake and gender. Genome Biol. 2007;8(11): R234. doi:10.1186/gb-2007-8-11-r234. PubMed PMID: 17988385, PubMed Central PMCID: PMC2258177, Epub 2007/11/09.
34. Loerch PM, Lu T, Dakin KA, Vann JM, Isaacs A, Geula C, et al. Evolution of the aging brain transcriptome and synaptic regulation. PLoS One. 2008; 3(10):e3329. doi:10.1371/journal.pone.0003329. PubMed PMID: 18830410, PubMed Central PMCID: PMC2553198, Epub 2008/10/03.
35. Wood SH, Craig T, Li Y, Merry B, de Magalhaes JP. Whole transcriptome sequencing of the aging rat brain reveals dynamic RNA changes in the dark matter of the genome. Age. 2013;35(3):763–76. doi:10.1007/s11357-012-9410-1. PubMed PMID: 22555619, PubMed Central PMCID: PMC3636386, Epub 2012/05/05. 36. de Magalhaes JP, Curado J, Church GM. Meta-analysis of age-related gene
expression profiles identifies common signatures of aging. Bioinformatics. 2009;25(7):875–81. doi:10.1093/bioinformatics/btp073. PubMed PMID: 19189975, PubMed Central PMCID: PMC2732303, Epub 2009/02/05. 37. LaCroix-Fralish ML, Austin JS, Zheng FY, Levitin DJ, Mogil JS. Patterns of
pain: meta-analysis of microarray studies of pain. Pain. 2011;152(8):1888–98. doi:10.1016/j.pain.2011.04.014. Epub 2011/05/13.
38. Reichwald J, Danner S, Wiederhold KH, Staufenbiel M. Expression of complement system components during aging and amyloid deposition in APP transgenic mice. J Neuroinflammation. 2009;6:35. doi:10.1186/1742-2094-6-35. PubMed PMID: 19917141, PubMed Central PMCID: PMC2784442, Epub 2009/11/18.
39. Brennan FH, Anderson AJ, Taylor SM, Woodruff TM, Ruitenberg MJ. Complement activation in the injured central nervous system: another dual-edged sword? J Neuroinflammation. 2012;9:137. doi:10.1186/1742-2094-9-137. PubMed PMID: 22721265; PubMed Central PMCID: PMCPMC3464784. 40. Cribbs DH, Berchtold NC, Perreau V, Coleman PD, Rogers J, Tenner AJ, et al.
Extensive innate immune gene activation accompanies brain aging, increasing vulnerability to cognitive decline and neurodegeneration: a microarray study. J Neuroinflammation. 2012;9:179. doi:10.1186/1742-2094-9-179. PubMed PMID: 22824372, PubMed Central PMCID: PMC3419089, Epub 2012/07/25.
41. Mastellos DC. Complement emerges as a masterful regulator of CNS homeostasis, neural synaptic plasticity and cognitive function. Exp Neurol. 2014;261:469–74. doi:10.1016/j.expneurol.2014.06.019. Epub 2014/07/01. 42. Cherry JD, Olschowka JA, O’Banion MK. Neuroinflammation and M2
microglia: the good, the bad, and the inflamed. J Neuroinflammation. 2014; 11:98. doi:10.1186/1742-2094-11-98. PubMed PMID: 24889886, PubMed Central PMCID: PMC4060849, Epub 2014/06/04.
43. David S, Kroner A. Repertoire of microglial and macrophage responses after spinal cord injury. Nat Rev Neurosci. 2011;12(7):388–99. doi:10.1038/nrn3053. Epub 2011/06/16.
44. Walker DG, Lue LF. Immune phenotypes of microglia in human neurodegenerative disease: challenges to detecting microglial polarization in human brains. Alzheimers Res Ther. 2015;7(1):56. doi:10.1186/s13195-015-0139-9. PubMed PMID: 26286145, PubMed Central PMCID: PMC4543480, Epub 2015/08/20.
45. Sheffield LG, Berman NE. Microglial expression of MHC class II increases in normal aging of nonhuman primates. Neurobiol Aging. 1998;19(1):47–55. Epub 1998/04/30.
46. Painter MM, Atagi Y, Liu CC, Rademakers R, Xu H, Fryer JD, et al. TREM2 in CNS homeostasis and neurodegenerative disease. Mol Neurodegener. 2015; 10:43. doi:10.1186/s13024-015-0040-9. PubMed PMID: 26337043, PubMed Central PMCID: PMC4560063, Epub 2015/09/05.
47. Parkinson GM, Dayas CV, Smith DW. Perturbed cholesterol homeostasis in aging spinal cord. Neurobiol Aging. 2016;45:123–35. doi:10.1016/j. neurobiolaging.2016.05.017. Epub 2016/5/24.
48. El Gaamouch F, Jing P, Xia J, Cai D. Alzheimer’s disease risk genes and lipid regulators. J Alzheimers Dis. 2016;53(1):15–29. doi:10.3233/JAD-160169. 49. Blyth FM, Cumming RG, Nicholas MK, Creasey H, Handelsman DJ, Le
CHAMP study. Pain. 2011;152(2):447–52. doi:10.1016/j.pain.2010.11.022. Epub 2010/12/21.
50. Johannes CB, Le TK, Zhou X, Johnston JA, Dworkin RH. The prevalence of chronic pain in United States adults: results of an Internet-based survey. J Pain. 2010;11(11):1230–9. doi:10.1016/j.jpain.2010.07.002. Epub 2010/08/28. 51. Costigan M, Scholz J, Woolf CJ. Neuropathic pain: a maladaptive response of the nervous system to damage. Annu Rev Neurosci. 2009;32:1–32. doi:10. 1146/annurev.neuro.051508.135531. PubMed PMID: 19400724, PubMed Central PMCID: PMC2768555, Epub 2009/04/30.
52. Grace PM, Hutchinson MR, Maier SF, Watkins LR. Pathological pain and the neuroimmune interface. Nat Rev Immunol. 2014;14(4):217–31. doi:10.1038/ nri3621. Epub 2014/03/01.
53. Mika J, Zychowska M, Popiolek-Barczyk K, Rojewska E, Przewlocka B. Importance of glial activation in neuropathic pain. Eur J Pharmacol. 2013; 716(1–3):106–19. doi:10.1016/j.ejphar.2013.01.072. Epub 2013/03/19.
• We accept pre-submission inquiries
• Our selector tool helps you to find the most relevant journal
• We provide round the clock customer support
• Convenient online submission
• Thorough peer review
• Inclusion in PubMed and all major indexing services
• Maximum visibility for your research
Submit your manuscript at www.biomedcentral.com/submit