WGA RFA Page 1 of 10
ATTACHMENT 1 – TECHNICAL PROPOSAL
Deterministic & Empirical Assessment of Smoke’s Contribution to Ozone
(DEASCO3) -
An online technical resource to support FLMs in air quality planning
Western Governors’ Association / Western Regional Air Partnership
CFDA No. 15.232JFSP Request for Applications (RFA) 2011-1, Task 6
Principal Investigator
Charles Thomas (Tom) Moore, Jr., of the Western Governors’ Association (WGA) is the Principal Investigator for the DEASCO3 project. WGA is incorporated under Article 26 of Title 7 of the 1973 Colorado Revised Statutes as a non-profit association to advocate policies and programs before any branch or agency of state and/or federal government. WGA staffs, manages, and implements the Western Regional Air Partnership (WRAP), a voluntary partnership of states, tribes, federal land managers, local air agencies and the US EPA, whose purpose is to understand current and evolving regional air quality issues in the context of the Clean Air Act (CAA) and its Amendments.
I.
Overview
The DEASCO3 project will produce analytical results and a dynamic and accessible technical tool that enables Federal Land Managers (FLM) to participate more fully in ozone air quality planning efforts. We will turn complex technical analyses of a series of well-chosen historic events (Case Studies) into accessible and instructive tables, charts, and maps that describe how and to what extent fires contribute to ambient ozone concentrations. About 20 Case Studies will be developed to characterize the relationship of emissions from fire to ozone concentrations across a broad range of circumstances (e.g., geographic locations, fuel conditions, time of year, fire types, and contributions to elevated background levels and levels in excess of the proposed Ozone NAAQS). This suite of Case Studies will characterize situations analogous to those that FLMs may face with current conditions and in the future. The online tool will allow FLMs to survey, review, and grab the technical results and findings of the most analogous Case Study(ies) that FLMs can use to effectively contribute to the state and EPA processes of SIP development, declaration of Exceptional Events, nonattainment area
designations (NAA), establishing background levels of ozone, and others. Our Team is comprised of technical and policy experts from a regional air quality partnership organization (RO), technical consulting firms, and FLMs. The 18-month project will stay focused on the JFSP’s stated RFA objectives throughout. Work will include: 1) emission inventory development for wildland and agricultural fires in 2002 and 2008; 2) deterministic (photochemical grid modeling (PGM) with source apportionment) and empirical analyses to better assess fire’s contribution to ozone; 3) development of an accessible online tool for FLMs to access results and technical products; 4) collaborative review and analysis by NPS and USFS air program staff and integration of FLMs’ technical and policy needs and perspectives into the technical products; 5) essential documentation and summary reports of methods and results; and 6) project management and coordination by a Principal Investigator. The Team’s approach and schedule for the project should provide initial findings pertaining to fire’s contribution to elevated ozone in advance of EPA’s NAA designations.
Three coordinated Task Teams (Emissions, Modeling, and Air Quality Planning & Policy) will implement a surgical, “smart” approach that utilizes multiple layers of disparate data to zero-in on Case Studies across the U.S. We will conduct extensive SIP-grade retrospective air quality analyses for these events. From the analytical results, the Team will develop a suite of “lessons-learned” pertaining to the contribution of wildland fire to ambient ozone concentrations. The Team will then develop the technical and policy bridges to enable these lessons-learned to be applied to current and anticipated future conditions of wildland fire and ozone NAA issues. These technical and policy bridges will inform the integration of air quality and land-based data sets into the dynamic web-based tool, as well as the content and design of maps, reports, and data outputs to support FLMs. The suite of instructive Case Studies based on rigorous technical analyses will put critical and useful information in FLMs’ hands without the need for additional resource-demanding work. FLMs can use these products as screening tools or to effectively inform decisions made in ozone air quality planning. The cornerstone product of the technical tool(s) will be a ranked order of locations where fire emissions have the
WGA RFA Page 2 of 10 greatest potential to challenge attainment and the new ozone standard. Other deliverables will include a beta-tested online tool, associated user training, and summary reports (including a manuscript submitted to a refereed publication).
1.
Project Justification and Expected Benefits
The following facts set the stage for important technical work to investigate fire’s contribution to ambient ozone levels throughout the U.S.: 1) a more stringent (range of 0.060 – 0.070 parts per million (ppm)) Ozone NAAQS is expected to be promulgated by EPA in late 2010; 2) monitoring data for many existing and new (e.g.,
southwest, rural, Class I areas) locations around the U.S. show ambient levels of ozone at or above the new standard, and many of these areas are expected to be designated as NAA for the new standard; 3) the new NAAQS may extend the typical ozone nonattainment season into spring and fall months and overlap more with the typical prescribed burning season in wildlands; and 4) emissions from fire will be addressed in many ways in the air quality planning for these Ozone NAA (accounting for “exceptional events” and establishing background levels of ozone as potential sources of emissions reduction).
Based on the research literature predicting a longer fire season, increased fire severity, and a larger number of wildland fires in the future, FLMs will have an ever-growing stake in how fire emissions are addressed in air quality planning efforts. Of course, FLMs’ interests and options available to address fire’s contribution to ozone vary widely depending on many factors including location, fuel conditions, land management options, funding, proximity to urban areas, and many others. Additionally challenging is that the transport of ozone precursors and their photochemical transformation to ozone are complicated processes that can require the dedication of
significant financial and technical resources to adequately characterize air quality planning analysis. The deliverables of DEASCO3 are designed to support the FLMs in meeting these challenges in several ways: 1) technical methods routinely accepted for use in air quality planning (including SIPs) will be used; 2) the range of fire’s contribution to ozone levels throughout the U.S. will be quantified; and 3) technical products will support FLMs to represent their interests with regard to NAA designation, “exceptional event” identification, background level definition, and fire emissions reduction strategy evaluation.
These DEASCO3 products will contribute to excellent decisions in ozone air quality planning that will increase the effectiveness of FLMs to manage lands (including the application of prescribed fire) and address important ozone matters. Benefits to FLMs could include: enhancing understanding of the state of science of fire-caused ozone precursors and associated ozone impacts; limiting the bases for NAA designation to relevant monitoring data; maximizing land management options and flexibility; and aligning land management decisions with strategies to avoid causing or contributing to exceedances of the ozone NAAQS.
2.
Project Objectives and Hypotheses
The DEASCO3 Team proposal work tasks are directly aligned with the JFSP’s RFA Task 6 objectives: Quantify the contributions from fires to ambient levels of ozone using tools and procedures that are similar to those that will be used by state and local air agencies in State Implementation Plan (SIP) development.
x Use emission inventories using fire emissions data sets applied across the U.S. in 2002 SIP efforts and based on fire activity data sets routinely collected across the U.S. for 2008.
x Apply PGM modeling using the Comprehensive Air Quality Model with extensions (CAMx).
x Apply the Anthropogenic Emissions Culpability Assessment (APCA) ozone source apportionment technique.
x Develop well-documented, transparent, and repeatable analyses to inform the collaborative review and to provide data layers for the project’s technical deliverables.
Use results of this quantification, ambient data, and other available information to produce a rank order of locations where fire emissions have the greatest potential to challenge attainment and maintenance of the new ozone standard.
x Use a “smart” approach to identify areas of interest.
x Utilize ambient data, deterministic modeling, and tested empirical analyses to develop quantitative data pertaining to fire emissions’ potential to influence ozone concentrations.
WGA RFA Page 3 of 10
x Apply disciplined technical routines and collaborative review to identify important lessons pertaining to fire emissions and ozone impacts.
x Develop efficient and non-proprietary software coding to “wrap” data layers in an online dynamic tool to produce FLM-useful products.
x Produce clear, concise data presentations and documentation for JFSP, FLMs, and state air quality program personnel to review and understand technical methods and results.
x Provide FLMs with technically accurate, policy-relevant, and timely materials to enable them to participate more fully in future ozone SIP development.
The DEASCO3 Team proposes to conduct technical work and collaborative review using several hypotheses. By testing these five hypotheses, we intend to address critical technical and policy issues identified in RFA Topic 6. Technical Hypotheses
Ho1 – Mature and well-mixed smoke emissions from wildland fire do not titrate ambient ozone, but do
contribute to increased downwind formation of ambient ozone and, therefore, elevate background concentrations of ozone across a large geographic area of the U.S.
Ho2 – A number of wildland fire variables assessed and managed by operational fire managers in planning and executing individual fires (e.g., fuel loading, fire size, timing and length of fires) affect formation of ozone. Ho3 – Cumulative emissions from groupings of proximate and coincident managed wildland fires over multi-day periods cause or contribute to exceedances of the level of the new primary ozone NAAQS.
Policy Hypotheses
Ho4 – Improved quantitative information about fire emissions’ contribution to ambient ozone levels will allow fire managers to demonstrate the change in air quality resulting from smoke management programs (e.g., individual fire management methods, cumulative fires, emissions reduction techniques), and more effectively participate in air quality planning efforts to address ozone nonattainment areas.
Ho5 – Improved quantitative information will increase FLMs’ understanding of spatial and temporal variation in fire emissions’ contribution to elevated ambient ozone events and accommodate more effective and timely involvement of FLMs in air quality planning processes.
II.
Methods
1.
Study Site(s)
DEASCO3’s technical deliverables and the online tool will be based on the findings developed from
approximately 20 detailed analyses of wildland fire’s contribution to ozone levels. We have identified 20 areas in order to capture a broad range of relationships of wildland smoke and ozone formation with the intent of characterizing wildland fire’s contribution across a wide geographic area of the continental U.S. In this suite of Case Studies, we intend to capture a sufficient range and combination of past circumstances in which fire emissions contributed to ozone formation to develop technical products (e.g., maps, charts, tables) that portray situations that are analogous to situations that FLMs will encounter in the future. In addition, 20 analyses areas are feasible given the 18-month duration and proposed project budget. Lastly, 20 Case Studies built from comprehensive analyses is a manageable number of case studies for FLMs to review and bring relevant, timely input to air quality planning efforts.
2.
Sampling Design
2.1 Fire Emissions Inventories
We propose development of two emission inventories covering the fire types of wildfire, prescribed fire, and agricultural burning. Although the JFSP RFA Topic 6 only identifies the need to evaluate the potential ozone contributions associated with emissions from wildfires and prescribed burns, we have included agriculture burning as a separate source category in our emission inventory development and ozone source apportionment modeling because it will allow a complete assessment of all combinations of emissions from fires (e.g., wildfires alone, prescribed burns alone, combined wildfires and prescribed burns, combined all fires, etc.). Fire emissions
WGA RFA Page 4 of 10 will be developed for oxides of nitrogen (NOx), volatile organic compounds (VOCs), carbon monoxide (CO) and speciated PM2.5, elemental carbon (EC), organic aerosol (OA), sulfate (SO4), nitrate (NO3), and crustal (soil) material. For photochemical modeling, VOCs will be further speciated into organic compounds used by CB05 chemical mechanisms using the very latest VOC speciation profiles for fires (e.g., the TROFFEE experiments). 2002 Fire Emissions Inventory: A fast-track ozone precursor inventory could be compiled within two months of project start-up taking advantage of existing fire emissions modeling databases for 2002. Existing PGM model-ready emissions inventories for fire will be used by the Team to the greatest extent feasible. These will include the All-RPO Wildfire Emissions Inventory and supplemented by the 2002 fire emissions inventories prepared separately for each of the five regional organizations. The 2002 fire emission inventories are well-documented and have been used for SIP development efforts across the U.S.
2008 Fire Emissions Inventory: We propose to develop new fire emission estimates developed using NOAA’s Hazard Mapping System (HMS), Monitoring Trends in Burn Severity data (MTBS) from the USFS’s Remote Sensing Applications Center, and WRAP’s Fire Emissions Tracking System (FETS) extended to satisfy technical input requirements of the photochemical grid model (PGM). This “bottom up” fire emissions inventory will be based on ongoing work by WRAP that is based on fire incident reporting and reconciliation with HMS and MTBS. Starting in 2008, FETS has been acquiring and storing detailed fire activity and emissions data classified by fire type for 15 western states and tribal lands. FETS would be expanded under this effort to accommodate data from the entire United States, to accept fire incident data from satellite-based detection methods (HMS), and to take advantage of detailed, retrospective burn perimeter and severity analyses (MTBS). Reported fire
occurrences from other state smoke management programs (e.g., Florida) and tracking systems, as available, will be added to FETS. Several enhancements to supporting spatial data will be made, including: 1) agricultural data from the National Agricultural Statistics Services; 2) vegetation health and national daily rainfall maps to derive fuel moisture; and 3) comprehensive land ownership for the WRAP region to improve (or, for satellite-based data, enable) classification, characterization, and emissions calculation of Wx, Rx, and agricultural fire events. Emissions inventory data for 2008 from the Satellite Mapping Automated Reanalysis Tool for Fire Incident Reconciliation (SMARTFIRE) program were considered. As a dynamic suite of fire activity and emissions estimation tools developed for operational forecasting, SMARTFIRE is considered state-of the-science and will likely be included as the basis for emission estimates in other projects funded by JFSP. The DEASCO3 project team has chosen a different basis for the 2008 inventory for a number of reasons. Under the CAA SIP planning process, emissions are the variable to which states apply controls for the purpose of demonstrating attainment with NAAQS. The emissions estimates for all source categories are carefully assessed to increase regulators’ and other SIP reviewers’ confidence in air quality model simulation results. The Team decided to use an alternate and more transparent and reproducible methodology, applying data from the state and FLM fire emissions community not used in SMARTFIRE to generate emissions estimates. We propose a retrospective analytical approach that uses post-fire constructed perimeter data from MTBS to constrain HMS fire detections for large, multi-day events to report daily activity. Detections on all dates inside an MTBS perimeter will be matched with that fire, and acres per day apportioned such that the daily perimeters (created by connecting adjacent HMS detections) add up to create the final MTBS perimeter. For small fires not associated with an MTBS perimeter, acres will be estimated from a rule set including land use, ownership, FCCS vegetation type, time of year, and, where possible, local/regional knowledge of “typical” fire size. The 2008 FETS bottom-up fire emissions inventory would be used along with the CAMx/APCA modeling system to estimate the ozone
contributions due to different types of fires during the 2008 calendar year.
In addition to the FETS bottom up fire emissions inventory for the U.S., a top down fire emissions inventory for the U.S. would also be acquired and used in the modeling. The top-down inventory contains fire estimates based on measurements from the Moderate-resolution Imaging Spectroradiometer (MODIS) remote sensors. NCAR has developed procedures for estimating fire emissions using the MODIS observed as described by Wiedinmyer and co-workers (2006) and Friedli and Wiedinmyer (2008). Fire emissions derived from the MODIS data include NOx, CO, VOC and PM species, along with other compounds not likely to be used in this study (e.g., Hg). The
WGA RFA Page 5 of 10 NCAR MODIS fire inventory has been used in several recent studies including the 2008 Denver ozone SIP1 as well as ozone modeling for the Texas Commission on Environmental Quality (TCEQ). Similar data quality standards and emission calculation methods will be employed and documented to prepare the 2008 inventory. 2.2 Photochemical Grid Modeling
The ozone contributions due to emissions from fires would be estimated using a photochemical grid model (PGM) with ozone source apportionment. Two rounds of PGM modeling would be used to estimate ozone fire contributions: (1) fast-track ozone modeling that could be completed within four months taking advantage of existing PGM and fire emissions modeling databases for 2002 developed by RPOs); and (2) use of a new PGM modeling database for 2008 based on 2008 fire emission estimates. Given the episodic nature of fires, it is important to use multiple years of ozone source apportionment modeling to produce a ranked ordering of locations where fires have the most potential to challenge attainment and/or maintenance of the new ozone NAAQS. PGM modeling of fire ozone contributions would also be used in conjunction with data analysis of ambient ozone data and fire emissions data to develop a multiple year record of potential fire emission ozone contribution that can be integrated into the web-based fire ozone mapping tool.
The Comprehensive Air Quality Model with extensions (CAMx) Anthropogenic Emissions Culpability
Assessment (APCA) ozone source apportionment technique would be used to separately simulate the incremental ozone contributions due to emissions for three types of fires: 1) wildfires, 2) prescribed burns, and 3) agricultural burning. The CAMx/APCA ozone source apportionment is the same technique utilized by EPA in their
Transport Rule2 to estimate which upwind states contribute significantly to ozone nonattainment in a downwind state. CAMx would be applied following the procedures outlined in EPA’s guidance for ozone SIP modeling3 to assure quality results and policy-relevant modeling analyses. CAMx would be run for 2002 and 2008 calendar years for the continental U.S. (CONUS) using a 36 km grid resolution, as well as for two separate 12 km modeling domains covering the western and eastern U.S.
Figure 1: WRAP (left) and VISTAS (right) 2002 36/12 km modeling domains.
Fast Track Ozone Fire Modeling for 2002: The ozone contributions due to emissions from 2002 fires will be estimated using existing PGM modeling databases developed by WRAP and the Visibility Improvements States and Tribal Association of the Southeast (VISTAS). DEASCO3 Team members were principally involved in the technical development of WRAP 2002 fire emissions inventories, WRAP regional modeling, and the VISTAS Emissions and Air Quality Modeling project. CAMx/APCA would first be applied to obtain separate ozone contributions due to emissions from wildfires, prescribed burns and agricultural burning to the extent possible. For western states, WRAP has a detailed 2002 fire emissions categorized for all wildland fire types and
agricultural burning with the central states (CENRAP; from Texas north to Minnesota) also having fire emissions for 2002 separated similarly. The southeast states (VISTAS) also have information on the different fire types. 2008 Ozone Fire Modeling: We propose to use similar procedures as described above to estimate ozone contributions due to emissions from fires for 2008 calendar year. The same 36 km CONUS and 12 km western and southeastern U.S. modeling domains would be utilized (Figure 1) with CAMx/APCA source apportionment modeling procedures for 2008 modeling. However, for 2008 calendar year modeling we would use two
estimates of fire emissions: 1) a “bottom-up” fire emissions inventory as described above, and 2) a “top-down”
1http://www.colorado.gov/airquality/documents/deno308/
2http://www.epa.gov/airtransport/
WGA RFA Page 6 of 10 fire emissions inventory based on MODIS satellite observations. The 2008 CAMx/APCA modeling would leverage the 2008 model setup being developed by WRAP as part of the West-wide Jumpstart Air Quality Modeling Study (WestJumpAQMS) so DEASCO3 project can focus on development of fire emissions and 2008 fire emissions ozone source apportionment modeling. The top-down fire emissions inventory based on MODIS satellite observations is readily available at low cost and has been used recently in photochemical modeling studies (e.g., Denver Ozone SIP). However, the top-down fire inventory fails to distinguish between different types of fires. We would compare the estimated incremental ozone concentrations due to “bottom-up” and “top-down” fire estimates to better understand uncertainties associated with the two approaches and to help better design the empirical fire contribution approach discussed next, that can be applied for multiple years. 2.3 Empirical Assessment Approach
Under this task, the Team will apply modeling and source apportionment results with empirical data analyses to identify apparent relationships between fire incidents and observed (especially elevated) ambient ozone
concentrations. For the years 2002-2008, observed daily maximum 8-hour ozone concentrations and available sources of fire incident and emissions data (e.g., MODIS, FETS, others) would be processed along with available meteorological data to identify instances and locations when emissions from fires have likely contributed to elevated ozone concentrations. Other, experiential understandings of Team members will also be used to identify areas of interest for the empirical studies. Examples may include: 1) focus on fire “hot spots” like the
Southeastern U.S. for Rx and Western U.S. for WF; 2) focus on sylvan areas upwind of (urban) ozone hot spots with high incidence of WF and/or Rx fire; 3) include areas presumed to be high ozone areas but with no current ozone monitoring data; 4) review available sources of other pollutants (i.e., non-ozone precursors) that indicate the presence of emissions due to fire (e.g., organic carbon, elemental carbon, NO2, CO, etc.); and 5) consider procedures discussed by Nikolov (2008) to relate sources of ozone precursors to air quality observations. The 2002-08 empirical data assessment will be informed by the modeling and expert analysis of the Team to define and implement a web display tool with graphical outputs and “data selected” tables. An empirical data
assessment tool demonstration application will use: 1) back and/or forward air mass trajectories and residence time data from on-line NOAA models; 2) for 2002 and 2008, gridded emissions data from the PGM inputs; 3) for 2003, 04, 05, 06, and 07, fire incident and activity data as described above; 4) ozone monitoring data from state/EPA networks used to select “high ozone events and locations” in this project; 5) monitoring data across fetch, determined by modeled source apportionment and back- and/or forward-trajectories; 6) model predictions for “unmonitored grid cells”; 7) simplified methodologies to account for deposition and titration; and 8) other data, tools, and methods selected by the Team.
3.
Field Measurements – No new measurements will be made.
4.
Data Analysis
A distinctive strength of the DEASCO3 Team is the combined analytical horsepower of consulting firms, FLM collaborators, and PI. During the execution of every major technical task we will execute two important steps to promote excellent deliverables: 1) technical results will be deliberately organized and data will be carefully designed to promote effective review and interpretation, and 2) Task Teams (e.g., Emissions, Modeling, Empirical Assessment, Data Analysis) formed from DEASCO3 Team members (and, likely, other interested experts/stakeholders) will convene to review and interpret data and develop findings. The DEASCO3 Team’s model for executing the technical work of each major task will be: Data Gathering Æ Execute Technical Work Æ QA/QC Æ Organize/Present Data Æ Review/Interpret Æ Develop Findings/Lessons-Learned Æ Build Bridges to Final Deliverables Æ Document.
A set of policy-relevant integrated ozone contribution metrics would be developed that relate CAMx/APCA-generated ozone contributions due to emissions from fires to ozone levels accounting for the fact that fire ozone contributions are more important under conditions in which the ambient ozone without the fires present is relatively higher than when ozone is lower. For this reason we propose integrated metrics with ozone
concentration thresholds or weights that are a function of ozone concentration and are related back to the new 8-hour Ozone NAAQS. An example of policy-relevant integrated ozone metrics related to potential primary Ozone NAAQS include the summation of the incremental increase in daily maximum 8-hour ozone concentrations due to fires when ozone is above specific threshold values (e.g., the new Ozone NAAQS). Spatial maps of integrated
WGA RFA Page 7 of 10 ozone metrics would identify those locations where fire emissions are more likely to contribute to exceedances of the new ozone NAAQS. We would also calculate these metrics at monitoring sites. By doing so, we will be able to substitute the observed ozone concentrations for the modeled estimated total ozone concentration in order to address uncertainties in the modeled total ozone concentrations and estimate the fire contributions to observed ozone concentrations. The empirical relationships developed in DEASCO3 would be evaluated against the deterministic ozone source apportionment modeling of fire contributions in 2002 and 2008. Findings of the evaluations would be used to evaluate and refine the empirical relationship to be applied to the 2002-2008 period. Findings from the empirical analyses will be used as one piece of a larger, more comprehensive weight of
evidence analysis to characterize fire’s contribution to ozone concentrations across the U.S. Integrated ozone metrics would be developed using the 2002-2008 data base that would identify U.S. locations where fires have the greatest potential to contribute to exceedances of the Ozone NAAQS.
FLM DEASCO3 Team members will take advantage of the generation, compilation, and accessibility of the deterministic and empirical assessment results to investigate other matters. These in-kind efforts by FLMs will include several factors. Evaluation of fire-enhanced ozone impacts at National Parks will be extended to consider EPA's proposed "W126" secondary standard, designed to protect sensitive vegetation and ecosystems. The impact of fire emissions on ozone is regional, but the extent of a fire's "footprint" is not well-known (using reactive tracer techniques, spatial and temporal evolution of fire impacts on regional ozone will be evaluated). Beyond their role in ozone formation, fires are also significant sources of both NOx and reduced nitrogen that can contribute to nitrogen deposition at downwind receptors. Nitrogen deposition and its role in ecosystem change is a primary concern at many National Parks, but the contribution to deposition from fires is currently unknown.
5.
Materials
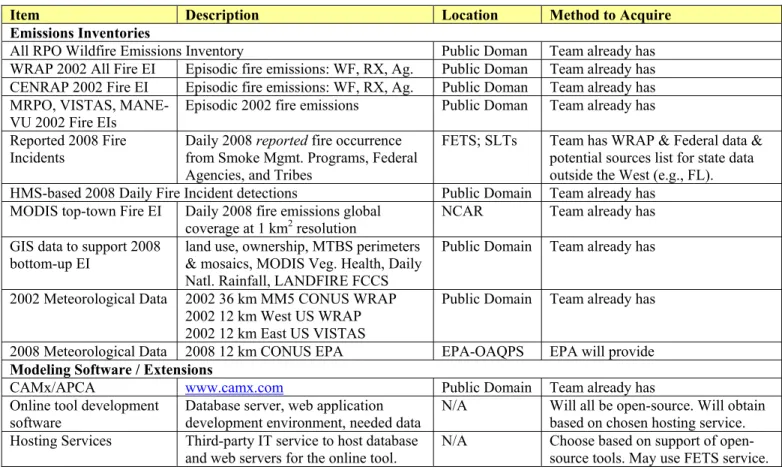
Table 1: Data sources and software to be used in the DEASCO3 project.
Data sources and software for use are either publicly-available or already belong to Team members. DEASCO3 deliverables will not be encumbered by software licensing fees or use-limiting intellectual property agreements.
Item Description Location Method to Acquire
Emissions Inventories
All RPO Wildfire Emissions Inventory Public Doman Team already has WRAP 2002 All Fire EI Episodic fire emissions: WF, RX, Ag. Public Doman Team already has CENRAP 2002 Fire EI Episodic fire emissions: WF, RX, Ag. Public Doman Team already has MRPO, VISTAS,
MANE-VU 2002 Fire EIs
Episodic 2002 fire emissions Public Doman Team already has Reported 2008 Fire
Incidents Daily 2008 reported fire occurrence from Smoke Mgmt. Programs, Federal Agencies, and Tribes
FETS; SLTs Team has WRAP & Federal data & potential sources list for state data outside the West (e.g., FL). HMS-based 2008 Daily Fire Incident detections Public Domain Team already has
MODIS top-town Fire EI Daily 2008 fire emissions global
coverage at 1 km2 resolution NCAR Team already has
GIS data to support 2008 bottom-up EI
land use, ownership, MTBS perimeters & mosaics, MODIS Veg. Health, Daily Natl. Rainfall, LANDFIRE FCCS
Public Domain Team already has 2002 Meteorological Data 2002 36 km MM5 CONUS WRAP
2002 12 km West US WRAP 2002 12 km East US VISTAS
Public Domain Team already has 2008 Meteorological Data 2008 12 km CONUS EPA EPA-OAQPS EPA will provide
Modeling Software / Extensions
CAMx/APCA www.camx.com Public Domain Team already has Online tool development
software
Database server, web application development environment, needed data
N/A Will all be open-source. Will obtain based on chosen hosting service. Hosting Services Third-party IT service to host database
open-WGA RFA Page 8 of 10
III.
Project Duration and Timeline
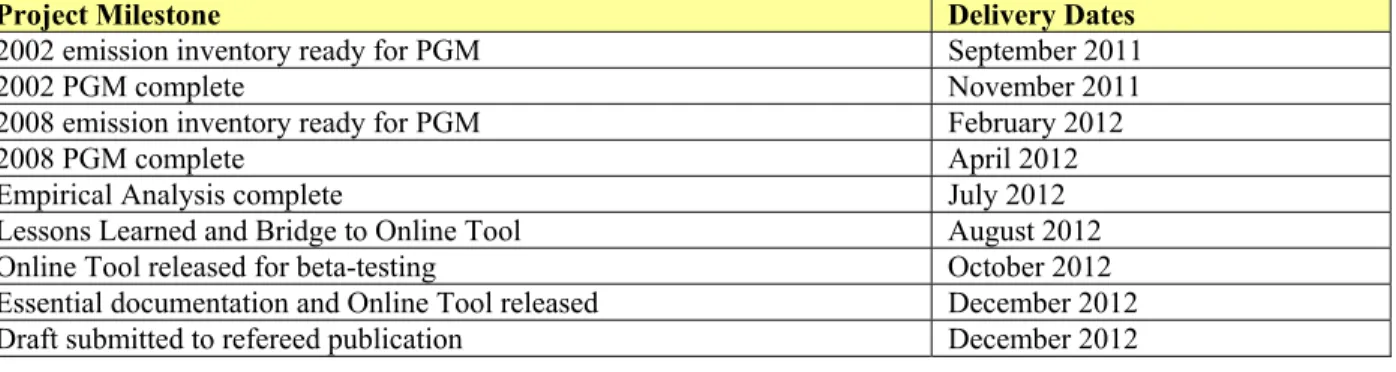
This project will last 1.5 years, assuming a start date of July 1, 2011, with completion in December 2012. Table 2: Project Timeline
Project Milestone Delivery Dates
2002 emission inventory ready for PGM September 2011
2002 PGM complete November 2011
2008 emission inventory ready for PGM February 2012
2008 PGM complete April 2012
Empirical Analysis complete July 2012 Lessons Learned and Bridge to Online Tool August 2012 Online Tool released for beta-testing October 2012 Essential documentation and Online Tool released December 2012 Draft submitted to refereed publication December 2012
IV.
Project Compliance - NEPA and other clearances
– Not Applicable.
V.
Research Linkage
The DEASCO3 proposal to prepare and analyze fire emissions and assess ozone impacts will be fully integrated with the WRAP’s WestJumpAQMS. The WestJumpAQMS project will assess regional air pollution transport and source contributions for Ozone and related air quality indicators in support of air quality planning by WRAP members, using emissions, meteorological, and air quality modeling tools, source apportionment methods, and data analysis techniques. The project is sponsored by western state air agencies, EPA, federal land managers, and private industry, and it will start in early 2011 and run through early 2012. Also, as an input to modeling work in both DEASCO3 and WestJump, WGA will complete a Biogenic Emission Inventory Improvement study for WESTAR Council. Like WRAP, the Southeastern States Air Resource Managers (SESARM) has a similar regional Ozone, PM2.5, and regional haze air quality analysis and planning support (SEMAP) project underway. Results from DEASCO3 will be shared with the SEMAP project to advance air quality analysis and planning in the southeastern U.S. U.S. EPA Office of Air Quality Planning and Standards’ (OAQPS) Modeling Group has requested DEASCO3 emissions data and ozone source apportionment for national scale air quality modeling. Table 3: Current and Pending Research Grants
Grant Program Project or Proposal Description/Identification Funding Amount Project Completion Date
Federal & State Agencies and Private Industry Collaborative
WestJumpAQMS - Modeling and Analysis of
Regional Ozone and Related Air Quality Indicators. $750,000+ Spring 2012 WESTAR Council Biogenic Emission. Inventory Improvement. $130,000 Winter 2011-12
VI.
Deliverables and Science Delivery
The DEASCO3 Team recognizes and appreciates the JFSP’s continued significant investment in the
advancement of wildland fire science. Every step in all of the tasks in this technical proposal has been thought through and developed with the purpose of delivering innovative and useful technical products. DEASCO3’s centerpiece deliverable will be a ranked order of locations where fire emissions have the greatest potential to challenge attainment and maintenance of the new ozone standard. To efficiently leverage the investment in wildland fire science, we considered the ranked order location product as an example of a report produced by a dynamic online tool and extended the scope of work for this project to include the development of such a tool. “DEASCO3, An Online Technical Resource to Support FLMs in Air Quality Planning,” will be built open-source (e.g., PHP or Railo, Google Maps, or MapServer), securely hosted, and it will allow users to save preferences and past results. It will deliver the science and technical results of the DEASCO3 project to field managers and other interested end users. It will also be a screening tool to evaluate fire’s contribution to ozone levels for incidents outside of the chosen modeling years (2002 and 2008). Outputs from the online tool will include source-apportioned modeling results and rank-order locations vulnerable to ozone impacts from fire. In addition, products such as a set of spatial (map-based) tools, plots, and tabular reports will be produced based on
WGA RFA Page 9 of 10 rule-sets developed from the empirical assessment task. These products will be available for users to visualize, combine, overlay, and analyze in order to inform excellent decisions pertaining to current and anticipated conditions of fire occurrence and ambient ozone concentrations. Additionally, we intend for users of DEASCO3 to be able to pull pertinent data from other online tools and data sources, such as ozone monitoring locations and data, NOAA’s online back-trajectory model, WFDSS operational fire perimeters, and FETS fire reports. The combination of features and resources of DEASCO3 will enable users to understand and assess the contribution to ozone due to fires for ozone planning (i.e., nonattainment boundaries, exceptional event analyses, and SIP development).
This deliverable will essentially bring well-organized and presented wildland fire occurrence, emissions, modeling results, and source attribution information together for FLMs to query, review, and produce reports. Always-on, web-based, secure access will be an effective and efficient way to transfer data, analytical tools, and findings of the project to field managers and other end users. Other deliverables for DEASCO3 include: 1) essential documentation explaining data sources, technical methods, QA/QC, results, data interpretation, and assessments of uncertainty (or other potential limitations to the technical work and findings); 2) a 10-20 page final report that presents the major methodologies of the project, describes the significant findings, presents the ranked order of locations where fire emissions have the greatest potential to challenge attainment and
maintenance of the new ozone standard, and identifies ways that the ranked order locations could be effectively used in air quality planning processes (the Team will prepare this report with the intention of submitting the document for publication in a refereed journal); 3) online demonstration tools and a webinar session to explain and train FLMs on their use (and other potential users or reviewers of the reports generated by the online tool); and 4) an annual progress report delivered one year after the start month.
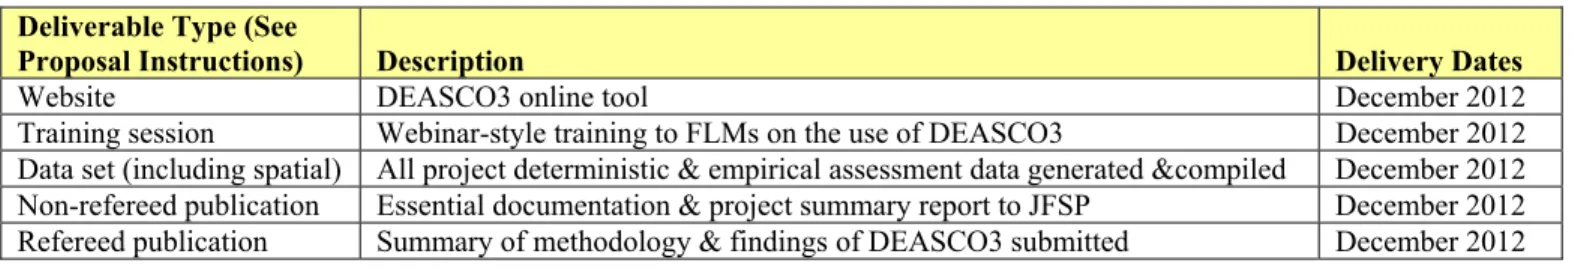
Table 4: Deliverable, Description, and Delivery Dates
Deliverable Type (See
Proposal Instructions) Description Delivery Dates
Website DEASCO3 online tool December 2012
Training session Webinar-style training to FLMs on the use of DEASCO3 December 2012 Data set (including spatial) All project deterministic & empirical assessment data generated &compiled December 2012 Non-refereed publication Essential documentation & project summary report to JFSP December 2012 Refereed publication Summary of methodology & findings of DEASCO3 submitted December 2012
VII.
Roles of Investigators and Associated Personnel
The proposed project has Tom Moore as Principal Investigator to coordinate and manage the project. In the context of supporting air quality planning to comply with CAA requirements, he has significant experience with large-scale air quality data analysis/assessment projects and detailed knowledge of fire emissions and
applications of PGM results, and he has led projects to develop and deliver well-regarded web database tools for state air agency and FLMs’ use, through the Regional Haze planning process. He also has a proven track record in managing the experienced and well-regarded key technical contractor personnel assigned to technical analysis and work product delivery activities for fire emissions and empirical analyses and tools (David Randall) and ozone photochemical grid modeling and source apportionment (Ralph Morris). Both technical contractors have performed comprehensive SIP-quality analyses under Mr. Moore’s direction in support of state air quality implementation plans, within specified time frames and limited resources.
Further, Mr. Moore’s time will coordinate analysis and review activities by FLM collaborators. A strong team of FLMs with extensive experience in and current responsibility for air quality resource protection has been
assembled to span the entire project scope, assure analysis work is solid, and see that results are delivered in FLM-ready format and level of detail. Mark Fitch has extensive experience with fire activity and emissions through his career with a state air agency smoke management program, with a USFS regional office in a similar capacity, and now with the NPS at NIFC. Significant experience with photochemical modeling applications for air quality issues affecting national parks from fire and other sources is contributed by Michael Barna of NPS as well as by Bret Anderson, now of USFS through his previous career with U.S. EPA. With respect to interpreting technical results for FLM use in SIP air quality planning processes and evaluation of exceptional events, Michael George and John Vimont of NPS, and Ann Acheson of USFS bring strong technical and management
WGA RFA Page 10 of 10 backgrounds to this project from their tenures as state air agency and EPA regional office regulators, and NPS and USFS smoke management and air resource protection programs, respectively, with their current
responsibilities for air resource protection, planning, and policy analysis. A unified PI-technical contractor-FLM collaborator team will assess technical data, analysis results, and deliverables for each proposed task to meet FLM needs.
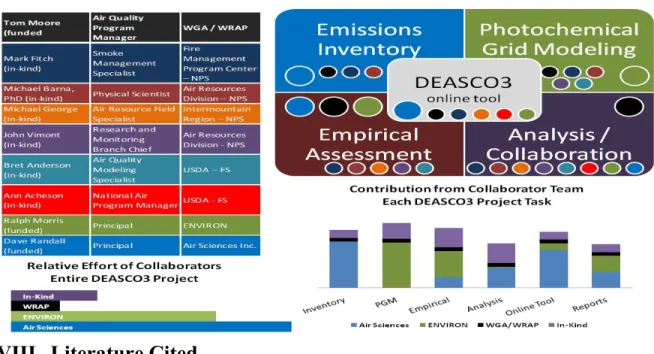
Figure 2: Collaborators, Roles, and Relative Efforts in DEASCO3 – Colored circles in the project tasks indicate collaborators’ roles in the project. Larger circles indicate task leads (or co-leads). Bar charts indicate the relative effort of collaborators in each task and in the entire DEASCO3 project.
VIII.
Literature Cited
Air Sciences. July 2005. 2002 Phase II Fire Emission Inventory for WRAP Region. Air Sciences Golden, CO. Air Sciences/EC/R. May 2005. Inter-RPO 2002 National Wildfire Emission Inventory. Air Sciences, Golden,CO. Brewer, P. and Moore. T. 2009. Source Contributions to Visibility Impairment in the Southeastern and Western
United States. AWMA Journal, Air & Waste Management Association; September.
ENVIRON. 2010. Users Guide to the Comprehensive Air-quality Model with extensions (CAMx) – Version 5.3. ENVIRON International Corporation, Novato, CA.
EPA. 2007. Guidance on Use of Models and Other Analyses for Demonstrating Attainment of Air Quality Goals for Ozone, PM2.5 and Regional Haze. U.S. EPA, Research Triangle Park, NC. EPA-454/B-07-002. April. Friedli and Wiedinmyer. 2008. Paper to be published in Environmental Science and Technology (ES&T). Mactec. 2008. Documentation of the Base G2 and Best & Final 2002 Base Year, 2009 and 2018 Emissions
Inventory for VISTAS. Mactec Engineering and Consulting, Inc. March 14.
Moore, T. and Brewer, P. 2007. Regional Haze Planning in the Western and Southeastern United States. Environmental Manager, Air & Waste Management Association; September.
Morris, R.E., B. Koo, B. Wang, G. Stella, D. McNally and C. Loomis. 2009a. Technical Support Document for VISTAS Emissions and Air Quality Modeling to Support Regional Haze State Implementation Plans. ENVIRON, Novato, CA and Alpine Geophysics, LLC, Arvada, CO. March.
Nikolov, N. 2008. Impact of Wildland Fires & Prescribed Burns on Ground Level Ozone Concentration: Review of Current Science Concepts and Analytical Approaches. METI Inc. USFS Contractor, Fort Collins, CO. (http://www.nifc.gov/smoke/documents/Impact_Wildland_fire_on_Ozone.pdf)
UNC. 2009. Peer Review of Source Apportionment Tools in CAMx and CMAQ. University of North Carolina, Institute for the Environment, Chapel Hill, North Carolina. August 31.
Tai, et.al. 2008. Boundary Conditions and Fire Emissions Modeling. Prepared for the Texas Commission on Environmental Quality by ENVIRON, Novato, CA.
Wiedinmyer, C. 2006. Estimating emissions from fires in North America for air quality modeling. Atmos. Env., 40.