Chapter 4
Notarial databases
The notarial databases make it possible to calculate quarterly price indexes, based on the transactions recorded in them, which are published at regular intervals.40
4.1 Description of bases
There are two distinct notarial databases:
• The “BIEN” base, managed by the Chambre Interdépartementale des Notaires de Paris41 (CINP), covers the Paris Region. Coverage starts in 1980 for Paris, 1986 for the inner suburbs (Petite Couronne), and 1996 for the outer suburbs (Grande Couronne).42
• The “Perval” France base is managed by Perval, a subsidiary of the Conseil Supérieur du Notariat (CSN). It cover the Provinces, and was set up in 1994.
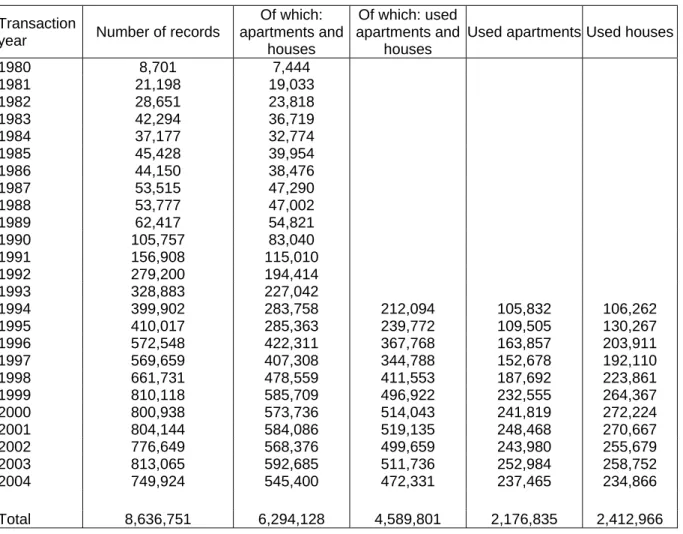
These bases register transactions concerning all types of properties—not only apartments and houses, but also buildings, business premises, land, garages, vineyards, and other agricultural properties. In July 2005, they contained 8,636,751 records for transactions between 1980 and 2004 (table 4.1). Each year, they add about 500,000 new transactions concerning used apartments and houses (30% in the Paris Region and 70% in the Provinces), suitable for inclusion in the calculation of the Notaires-INSEE indexes. The use of notarial databases and the calculation of the indexes are governed by agreements between CNIP or CSN and INSEE.43
4.2 Timing of incorporation of transactions
It takes about 3-4 months for a transaction to be added to one of the databases. In 2004, the average waiting period for the Paris Region was 103 days (49 to receive the deeds, 54 to capture the data and add them to the base) and for the Provinces about 120 days (60 to receive the deeds, 60 to process them). In the Provinces, the waiting period was longer than in 2003, but the processing backlog should be cleared by 2005. At present, 60% of deeds are added to the base within three months, 90% within six months. For the Paris Region, more than 80% are added within four months.
40
For the other statistical sources available, see end of appendix 11.1 (chapter 11): information sources on used-housing market.
41
Chambre Interdépartementale des Notaires de Paris, de la Seine-Saint-Denis and du Val-de-Marne. 42
For the Petite Couronne indexes, the Chambre des Notaires des Hauts-de-Seine is involved (CINP covers only Paris and the Val-de-Marne and Seine-Saint-Denis départements): the Chambres des Notaires of the Seine-et-Marne, Essonne, and Yvelines/Val-d'Oise départements are involved in the Grande Couronne indexes.
43
Table 4.1 - Records in notarial databases in November 2004, by transaction year
Transaction
year Number of records
Of which: apartments and houses Of which: used apartments and houses
Used apartments Used houses
1980 8,701 7,444 1981 21,198 19,033 1982 28,651 23,818 1983 42,294 36,719 1984 37,177 32,774 1985 45,428 39,954 1986 44,150 38,476 1987 53,515 47,290 1988 53,777 47,002 1989 62,417 54,821 1990 105,757 83,040 1991 156,908 115,010 1992 279,200 194,414 1993 328,883 227,042 1994 399,902 283,758 212,094 105,832 106,262 1995 410,017 285,363 239,772 109,505 130,267 1996 572,548 422,311 367,768 163,857 203,911 1997 569,659 407,308 344,788 152,678 192,110 1998 661,731 478,559 411,553 187,692 223,861 1999 810,118 585,709 496,922 232,555 264,367 2000 800,938 573,736 514,043 241,819 272,224 2001 804,144 584,086 519,135 248,468 270,667 2002 776,649 568,376 499,659 243,980 255,679 2003 813,065 592,685 511,736 252,984 258,752 2004 749,924 545,400 472,331 237,465 234,866 Total 8,636,751 6,294,128 4,589,801 2,176,835 2,412,966
4.3 Coverage rate
The notarial databases are fed on a voluntary basis and are not exhaustive. It is important to determine their coverage rate for two main reasons. First, the quality of the index requires unbiased transaction recording: if a certain type of transaction was under-recorded and its price change displayed a specific profile, the index would be biased.44 This would happen if the notaries’ behavior in regard to forwarding information to the bases varied with the characteristics of property-price changes. Hence the importance of measuring the coverage rate by property type and geographic area.
Second, it is interesting per se to determine the number of real-estate transactions in order to monitor their cycle. This cannot be done from the transactions recorded in the notarial databases unless the coverage rate is constant. Until recently, however, the rate increased in step with the ramp-up of the notarial databases; as a result, it was not easy to interpret the change in the number of transactions recorded by notaries.
44
We can minimize this potential bias by choosing a reference stock whose structure is not too different from the stock that can be determined from censuses. In fact, two issues are intertwined. First, the reference stock must give an unbiased picture of total transactions: this is the issue of the representativeness of notarial databases, of which the coverage rate is one factor. Second, the reference stock must also be an acceptable proxy for housing stocks, as the purpose of the index is to measure the change in (theoretical) value of the housing stocks (see above, chapter 1: “What are the prices observed?”) and not only the value of flows of traded goods. This second issue justifies the comparison (by structure) of the reference stock with the census. In appendix 11.6 (chapter 11), on definitions, see: table 11.2 on the structure of the Paris reference stock; tables 11.15-11.18, comparing the structures of the index estimation stocks with the corresponding breakdowns in the 1999 census.
Absent national statistics on the number of sales of existing dwellings by dwelling type, computing the coverage rate of notarial databases is not simple, and we must use indirect approaches. There are three possible solutions: using an enumeration of notarial deeds; relying on an ad hoc survey; or using the tax data of the Directorate-General for Taxation (DGI).
• Enumeration of notarial deeds
For the Paris Region, the CINP base is linked to a survey on notarial-office activity that allows a monthly census, by département, of the number of notarial deeds, and therefore of transactions. We estimate the base’s coverage rate as the ratio of the number of deeds recorded in the base to the total number of deeds of sale signed. For January-November 2004, the total coverage rate was 85% in the Paris Region (89% for Paris; 88% for the Petite Couronne, 78% for the Grande Couronne). However, the enumeration does not distinguish between transactions concerning new properties and those concerning used properties. The coverage rate is an overall measure and amalgamates the types of stock. The location taken into account is that of the notarial office, not that of the property sold. For the Provinces, there is no deed enumeration, so we must use a different method to estimate the coverage rate.
• Ad hoc survey
In the 1990s, the Ministry for Infrastructure conducted a recurrent survey of local tax offices called Existan, which has proved to be a valuable tool for us. Until 2000, Existan covered all of France. Since then, it has been restricted to a few regions for cost reasons, and pending the extraction of data from the asset database compiled by the DGI.45 Existan categorized properties (apartments, houses, entire buildings) and the characteristics of buyers and sellers. It allowed comparisons, by département, of the number of transactions in notarial databases with those registered in the survey, thus making it possible to estimate coverage rates.
• Tax data
Since Existan was discontinued at national level, we have been using the tax source to estimate coverage rates.46 The basic information consists of transfer-tax revenues (droits de mutation) collected in each département. We divide these revenues by the corresponding taxation rates to obtain a tax-assessment base, i.e., total property sales. By comparing this amount with the figure in the notarial databases, we obtain the coverage rate for the databases in monetary-value terms. Also, by dividing total property sales by the average selling price—estimated from notarial databases over the same period47—we obtain an estimate of the total number of transactions.
Before 1999, used-housing transactions were taxed at a special rate, and the corresponding revenues were shown separately in the DGI accounts. The calculation was therefore easy. Since that date, a single rate (4.80%) has applied to all transactions (excluding new properties and equivalents), whether they concern residential real estate, business real estate, or even certain tracts of building land. The DGI accounts no longer classify revenues from taxes on used-housing transactions separately. However, we can still estimate a coverage rate for all used properties, both residential and non-residential; under certain assumptions and hence certain approximations,48 we can deduce, from that general rate, a specific coverage rate for existing dwellings.
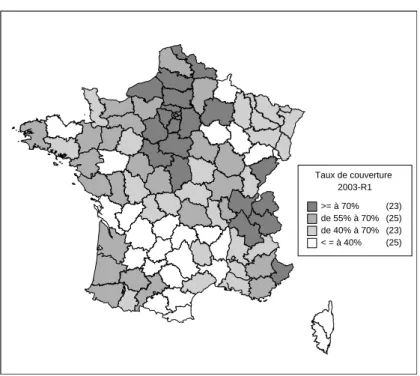
Estimated with the above procedure, the coverage rate of the notarial databases for existing dwellings in 2003 was 66% for all of France (Corsica and overseas départements included), 83% for the Paris Region, and 59% for the Provinces. It is highly variable from one département to another: in 2003, excluding Corsica and overseas départements and territories, it was under 30% in 12 départements, ranged between 30% and 50% in 23 départements, ranged between 50% and 70% in 36
départements, and exceeded 70% in 23 départements (figure 4.1).
45
For details on this survey, see appendix 11.1 (chapter 11): information sources on used-housing market. 46
The comparison between this method and the previous one (Existan survey), conducted for 1997, shows transaction numbers and values identical to within 1% for all of France, with some wider gaps observed in certain
départements. 47
Lagged by a few months to take account of perception lags. 48
Figure 4.1 - Estimated coverage rate of notarial databases, for existing dwellings, by département, 2003 Taux de couverture 2003-R1 >= à 70% (23) de 55% à 70% (25) de 40% à 70% (23) < = à 40% (25)
How to read this map: Départements are classified into four roughly equivalent groups of 23-25 départements each, from which we derive the bracket boundaries. Recall that the coverage rates are calculated
om transaction amounts. fr
A low coverage rate does not, in itself, pose a statistical problem provided that the number of records exceeds a given threshold. What is more problematic is the fact of not knowing whether the deeds recorded in the database are representative of all transactions or whether they display bias. This would happen if, for example, some notarial offices never sent information on deeds concerning particular markets, or if certain notaries did not send information on deeds involving a given category of clients. The partial comparisons made until now show no evidence of significant bias, except in the few départements with the lowest coverage rates (notably Pyrénées-Orientales). As the coverage rates in Corsica and in overseas départements and territories are extremely low (10% and 27% respectively in 2003), the indexes do not cover those geographic areas. The France index should therefore be understood as covering “France excluding Corsica and overseas départements and
erritories.” t
.4 Scope of coverage of indexes
4
The scope of the Notaires-INSEE indexes is confined to existing dwellings as defined for tax purposes (apartments or houses). New dwellings are excluded. We also exclude what are deemed to be non-standard dwellings such as rooms, attics, lofts, workshops, concierges’ lodgings, manors, large properties, and townhouses. The dwelling must be unoccupied at the time of sale, designated for residential purposes only, and acquired with full property rights by a private individual or real-estate company. We therefore remove the dwellings that are leased at the time of purchase, whether the tenant is the buyer or not. The reason for our exclusion is that, given the regulation on rental leases, such dwellings are usually sold below the going price. Lastly, the sales taken into account are private transactions, i.e., excluding auction sales. This definition of the scope of coverage eliminates, for example, 14% of notarial database records for apartments and 18% for houses in the Provinces. The
roportions for the Paris Region are similar: 16% for apartments, 13% for houses. p
4.5 Housing characteristics; non-response treatment
The documents sent by notarial offices are photocopies of excerpted deeds or full deeds (called “standardized mortgage documents” [documents hypothécaires normalisés: DHNs]), plus a slip giving some additional information such as the floor space of the property.49
In addition to the transaction date, the characteristics available to define dwelling quality are as follows: floor space (in sq. m.), neighborhood, construction period (nine date ranges: before 1850, 1850-1913, 1914-1947, 1948-1969, 1970-1980, 1981-1991, 1992-2000, 2001-2010), number of rooms (from 1 to 5+), average floor space per room by property size,50 number of bathrooms (0, 1, or 2+), number of garages or parking spaces (0, 1, or 2+), building floor and presence of an elevator (ground floor, 1st, 2nd, 3rd, 4th or higher without elevator, 4thor higher with elevator), cellar (0 or 1), balcony or terrace (yes or no) and property condition (good, needs work, needs renovation). For the Paris Region, the list does not include terrace, balcony or property condition.
For houses, the building floor, elevator, cellar, terrace, and balcony criteria are not relevant; by contrast, we need to add the number of stories (1, 2, 3+), plot size (in sq. m.), and basement. For the Paris Region, the criteria do not include property condition and basement.
The non-response rate differs for each variable (table 4.2). Depending on the variable, non-response will lead to either a rejection of the transaction or to an imputation (table 4.3).
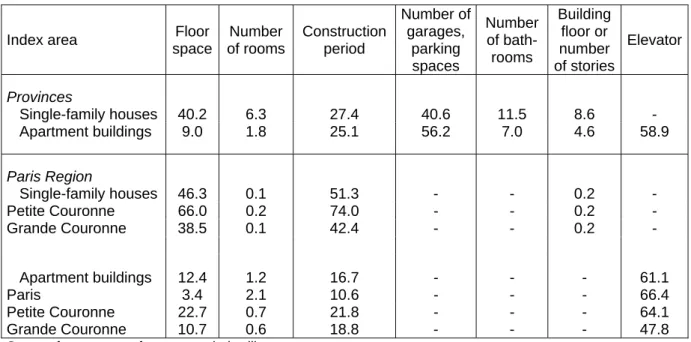
Table 4.2 - Non-response rate
Index area Floor space Number of rooms Construction period Number of garages, parking spaces Number of bath-rooms Building floor or number of stories Elevator Provinces Single-family houses 40.2 6.3 27.4 40.6 11.5 8.6 - Apartment buildings 9.0 1.8 25.1 56.2 7.0 4.6 58.9 Paris Region Single-family houses 46.3 0.1 51.3 - - 0.2 - Petite Couronne 66.0 0.2 74.0 - - 0.2 - Grande Couronne 38.5 0.1 42.4 - - 0.2 - Apartment buildings 12.4 1.2 16.7 - - - 61.1 Paris 3.4 2.1 10.6 - - - 66.4 Petite Couronne 22.7 0.7 21.8 - - - 64.1 Grande Couronne 10.7 0.6 18.8 - - - 47.8
Scope of coverage: reference-stock dwellings.
How to read this table: In Paris, the gross non-response rate for floor space is 22.3%. By editing, we can lower the rate to 3.4%. In the Paris Region, for garages, bathrooms, and apartment-building floor, the rate is not quantified, for there is a confusion between the “no bathroom” or “no garage” choices and non-responses.
49
There are minor differences in the slips used in the Paris Region and the Provinces. In the Paris region, for an apartment, the slip gives the floor space, number of main rooms, building floor, number of bathrooms, presence of a elevator, and presence of a simple or double enclosed parking garage or open parking space. In the Provinces, the slip also gives information on the dwelling’s condition (good condition, needs work, needs renovation) and view (adds value, diminishes value), as well as on the main exposure and a negotiation variable (notary, agency, direct private sale). The information on some of these variables, however, is poor; as a result, they have not all been used in this version of the hedonic models.
50
The average floor space per room for studios is 20-30 sq. m., for two-room apartments, 17-24 sq. m., for three-room apartments, 18-22 sq. m., and for apartments with four or more three-rooms, 17-21 sq. m.
Table 4.3 - Non-response treatment
Type of non-response Action Method, if imputation
Price rejected Floor space and number of rooms rejected
Floor space imputed Econometric imputations (Paris Region and Provinces)
Number of rooms rejected (Provinces) imputed (Paris Region)
Based on floor space (Paris Region) Dwelling removed from estimation stock, but kept in reference stock
Property type rejected
Elevator imputed Non-response = yes
Building floor imputed Ground floor
Bathroom imputed No bathroom
Garage, parking space imputed No garage, no parking space
Construction date “Non-response” choices counted
separately
Type of buyer imputed Individual or real-estate company (SCI)
Type of seller Variable not used
Occupancy status imputed Vacant
Property use imputed Strictly residential, with full property rights
Plot size (for houses) rejected
Table 4.4 - Number of primary calculation strata and number of neighborhoods
Index Number of strata Number of neighborhoods Paris Region 62 230 Apartments 55 205 Houses 7 25 Provinces 234 1,125 Apartments 88 509 Urban unit > 10,000 inhab. 74 410 of which: central cities 57 297 of which: suburbs 17 113 Urban unit < 10,000 inhab., rural 14 99 Houses 146 616 Total 296 1,355