UC Santa Barbara Electronic Theses and Dissertations
TitleAnalyzing and Processing Big Real Graphs Permalink https://escholarship.org/uc/item/0896j24v Author Zhao, Xiaohan Publication Date 2014 Peer reviewed|Thesis/dissertation
Santa Barbara
Analyzing and Processing Big Real Graphs
A Dissertation submitted in partial satisfaction of the requirements for the degree of
Doctor of Philosophy in Computer Science by Xiaohan Zhao Committee in Charge:
Professor Ben Y. Zhao, Chair Professor Haitao Zheng Professor Xifeng Yan
Professor Haitao Zheng
Professor Xifeng Yan
Professor Ben Y. Zhao, Committee Chair
Copyright c 2014 by
First of all, I would like to express my sincere gratitude to my advisor, Prof. Ben Y. Zhao. I am amazingly fortunate to have an advisor who gives me the invaluable guidance to my research, and grants me great freedom to pursue independent work. In the last five years, Ben has taught me how to conduct good research with his patience, enthusiasm and immense knowledge. Meanwhile, he is also my advisor outside of academia. He always shares with me his wisdom on how to live a happy life, laughs with me about funny jokes, and has trained me to be a fan of X-men. As I always say, Ben is my academic “father”, who always gives me great support and encouragement.
Second, I would like to gratefully and sincerely thank Prof. Haitao Zheng. She is like my second advisor. Through our collaboration, I have learned to be careful with each step and every detail of my research, which is critical to my future career. I am deeply grateful for her insightful advice on my work, talks and papers.
I also sincerely thank my committee member Prof. Xifeng Yan. I am deeply grateful for his valuable feedback and insightful suggestions on my work.
My sincere thanks go to Dr. Alessandra Sala and Prof. Christo Wilson. It is my pleasure to work with them on multiple projects. I am also grateful to Prof. Xia Zhou, Dr. Lei Yang, Dr. Lili Cao, Dr. Krishna Puttaswamy, and Dr. Vinod Kone for their various forms of help during my graduate study. Also I appreciate the efforts of Adelbert Chang who worked with me on the incredible VLDB paper. I am indebted to all the current members of SAND Lab: Zengbin Zhang, Gang Wang, Yibo Zhu, Ana Nika, Qingyun Liu, Lin Zhou, Tianyi Wang, and
moments with me.
I would like to acknowledge my collaborators and mentors for their valuable advice and numerous discussions: Prof. Sabrina Gaito, Dr. Atish Das Sarma, Dr. Walter Willinger, Xiao Wang, Dr. Antony Rowstron, and Chris Conrad.
Finally, and most importantly, I would like to thank my loving family. Thanks to my father Wenjie Zhao and my mother Chunyan Zhou for their endless love, and for always being there for me. Thanks to my husband Bo Zong for his unconditional love, support and encouragement. Thank you.
Xiaohan Zhao
Education
2014 Ph.D in Computer Science, University of California, Santa Barbara.
2009 Master of Science in Electronic Engineering, Tsinghua University, China.
2007 Bachelor of Enginnering in Electronic Engineering, Tsinghua University, China.
Experience
08/2009 – 08/2014 Research Assistant, University of California, Santa Barbara.
06/2013 – 09/2013 Research Intern, Microsoft Research, Cambridge, UK.
10/2012 – 12/2012 Research Intern, Microsoft Research, Cambridge, UK.
06/2012 – 09/2012 Software Intern, LinkedIn.
Publication
Matteo Zignani, Sabrina Gaito, Gian Paolo Rossi, Xiaohan Zhao, Haitao Zheng, and Ben Y. Zhao. “Link and Triadic Closure Delay: Temporal Metrics for Social Network Dynamics.” International Conference on Weblogs and Social Media (ICWSM), Jun. 2014.
Zengbin Zhang, Lin Zhou,Xiaohan Zhao, Gang Wang, Yu Su, Miriam Metzger, Haitao Zheng, and Ben Y. Zhao. “On the Validity of Geosocial Mobility Traces.” ACM Work-shop on Hot Topics in Networks (HotNets), Nov. 2013.
“On the Embeddability of Random Walk Distances.” Very Large Data Bases (VLDB), Sept. 2013.
Xiaohan Zhao, Alessandra Sala, Christo Wilson, Xiao Wang, Sabrina Gaito, Haitao Zheng, and Ben Y. Zhao. “Multi-scale Dynamics in a Massive Online Social Network.”
Internet Measurement Conference (IMC), Nov. 2012.
Sabrina Gaito, Matteo Zignani, Gian Paolo Rossi, Alessandra Sala, Xiaohan Zhao, Xiao Wang, Haitao Zheng, and Ben Y. Zhao. “On the Bursty Evolution of Online Social Networks.” ACM International Workshop on Hot Topics on Interdisciplinary Social Networks Research (HotSocial), Aug. 2012.
Gang Wang, Christo Wilson, Xiaohan Zhao, Yibo Zhu, Manish Mohanlal, Haitao Zheng, and Ben Y. Zhao: “Serf and Turf: Crowdturfing for Fun and Profit.” Interna-tional World Wide Web Conference (WWW), Apr. 2012.
Xiaohan Zhao, Alessandra Sala, Haito Zheng, and Ben Y. Zhao: “Efficient Shortest Paths on Massive Social Graphs.” IEEE International Conference on Collaborative Computing: Networking, Applications and Worksharing (CollaborateCom), Oct. 2011. (Invited Paper)
Alessandra Sala, Xiaohan Zhao, Christo Wilson, Haitao Zheng, and Ben Y. Zhao. “Sharing Graphs using Differentially Private Graph Models.” Internet Measurement Conference (IMC), Nov. 2011.
“Orion: Shortest Path Estimation for Large Social Graphs.” Workshop on Online Social Networks (WOSN), Jun. 2010.
Xiaohan Zhao, Xiaoxiao Song, Xiao Wang, Yang Chen, Beixing Deng, and Xing Li. “Analysis of Security Policy in Practical Internet Coordinates.” International Journal of Security and Its Applications, Vol. 3, No. 1, 2009.
Yang Chen, Xiao Wang, Xiaoxiao Song, Eng Lua, Cong Shi, Xiaohan Zhao, Beix-ing Deng, and XBeix-ing Li.“Phoenix: Towards an Accurate, Practical and Decentralized Network Coordinate System.” International IFIP-TC 6 Networking Conference (NET-WORKING), May 2009.
Xiaoxiao Song, Xiaohan Zhao, Eng Keong Lua, Zengbin Zhang, Beixing Deng, and Xing Li. “SLINCS: A Social Link based Evaluation System for Network Coordinate Systems.” IEEE Consumer Communications & Networking Conference (CCNC), Jan. 2009. (Short Paper)
Xiaohan Zhao, Xiaoxiao Song, Xiao Wang, Yang Chen, Beixing Deng, and Xing Li. “Attacks against Network Coordinate System: Vulnerable PIC.”International Sympo-sium on Computer Science and its Applications (CSA), Oct. 2008.
Analyzing and Processing Big Real Graphs by
Xiaohan Zhao
As fundamental abstractions of network structures, graphs are everywhere, ranging from biological protein interaction networks and Internet routing net-works, to emerging online social networks. Studying graphs is critical to under-standing the fundamental processes behind the networks, and of practical im-portance in experimental research. Although many studies on graphs have been carried out in decades, most of the work focused on small or synthetic graphs. In recent years, because of the unprecedented increase of existing networks and the emergence of new complex networks, more and more big real graphs are becoming available. Compared to the graphs studied in prior work, the graphs from these networks are significantly different in scale, level of dynamics and structure.
In this dissertation, we tackle three important graph research problems caused by the significant differences of the big real graphs: efficient node distance com-putation, graph dynamic analysis and modeling, and graph privacy.
First, we target on a fundamental graph analysis problem, i.e. node distance computation. As a primitive of graph analysis and network applications, the com-putation of shortest path or random walk distances is comcom-putationally expensive, and difficult to scale with the sheer size of big real graphs. To address the scal-ability issue, we design a novel node distance computation method, named graph
real graphs. Specifically, we propose methods to analyze graph dynamics at mul-tiple network scales and explore temporal properties of network growth. Through measurements on Renren first two-year dynamic data, we find independent and predictable processes at different network levels, and detect self-similar properties in its edge creation process. Based on the observations, we propose a new dynamic graph model to capture both temporal and spatial properties. Calibrated with the Renren dataset, our model successfully produces synthetic graphs showing similar dynamic properties.
Finally, to address privacy issue in sharing graphs, we design a graph privacy system to guarantee the required level of privacy. The goal of our work is to de-sign a system that can both maintain a meaningful graph structure and provide strong privacy guarantee. To navigate the tradeoff between the strength of pri-vacy and graph structure utility, we propose a differentially-private graph model. Our rigorous proof shows that the graphs produced by the system can achieve the required level of privacy. By running the system on real graphs collected from Facebook, Internet, and Web, the results demonstrate that the generated syn-thetic graphs match the original graphs in terms of graph structural metrics and application-level performance.
In summary, to analyze and process the graphs from today’s large complex networks, we work on three important problems, including efficiently computing node distances in massive graphs, analyzing and modeling high volume of dynam-ics in big real graphs, and protecting graph privacy in sharing graphs. We propose novel solutions to address these problems. Through our extensive experiments, we show that our designs perform consistently well on big real graphs.
Curriculum Vitæ vii
List of Figures xvi
List of Tables xx
1 Introduction 1
1.1 Efficient Node Distance Computation . . . 4
1.2 Dynamic Graph Analysis and Modeling . . . 5
1.3 Graph Privacy. . . 6
1.4 Contributions . . . 7
1.5 Thesis organization . . . 8
2 Efficient Node Distance Computation 10 2.1 Introduction . . . 10
2.2 Experiment Datasets and Evaluation Metrics . . . 14
2.2.1 Datasets . . . 14
2.2.2 Evaluation Metrics . . . 15
2.3 Graph Coordinate Systems . . . 17
2.3.1 Design Goals . . . 17
2.3.2 A Landmark-based Framework . . . 19
2.3.3 Evaluating Landmark Selection Strategies . . . 22
2.4 Embedding Shortest Path Distances . . . 23
2.4.4 Finding Shortest Paths Using Graph Coordinates . . . 36
2.5 Embedding Random Walk Distances . . . 44
2.5.1 Random-Walk Distances and Challenges . . . 45
2.5.2 A Directional Height Space . . . 51
2.5.3 Fast Precomputation . . . 55
2.5.4 Performance Evaluation . . . 59
2.6 Related Work . . . 70
2.6.1 Shortest Path Estimation . . . 70
2.6.2 Random Walk Distance Estimation . . . 71
2.6.3 Network Coordinate Systems . . . 72
2.6.4 Applications Using Node Distances . . . 74
2.7 Summary . . . 75
3 Analyzing and Modeling Dynamics in Big Real Graphs 77 3.1 Introduction . . . 77
3.2 Dataset and Basic Analysis . . . 81
3.2.1 Renren Dynamic Dataset . . . 81
3.2.2 Network Level Measurement . . . 82
3.3 Understanding Network Dynamics at Multiple Scales . . . 86
3.3.1 Edge Evolution . . . 87
3.3.2 Community Evolution . . . 91
3.3.3 Merging of Two OSNs . . . 99
3.3.4 Summary of Observations . . . 106
3.4 Detecting Self-Similarity in Edge Creation . . . 106
3.4.1 Background . . . 107
3.4.2 Preliminary Analysis on Sampled Data . . . 110
3.4.3 Wavelet-Based Analysis . . . 115
3.4.4 Summary of Observations . . . 118
3.5.3 Model Validation . . . 125
3.6 Related Work . . . 134
3.7 Summary . . . 138
4 Privacy Preserving Graph-Sharing 140 4.1 Introduction . . . 140
4.2 A differential private graph model . . . 144
4.2.1 Background and Goals . . . 144
4.2.2 Differential Privacy . . . 147
4.2.3 Differential Privacy on Graphs . . . 149
4.3 Basic Design . . . 152
4.3.1 Sensitivity ofdK −2 . . . 153
4.3.2 The dK-Perturbation Algorithm . . . 155
4.3.3 Validation on Real Graphs . . . 157
4.4 Improvement via Partitioning . . . 160
4.4.1 Divide Randomize and Conquer Algorithm . . . 161
4.4.2 Theoretical Analysis . . . 164
4.4.3 Evaluating and Optimizing DRC . . . 169
4.5 End-to-end Graph Similarity . . . 171
4.5.1 Graph Metrics. . . 172 4.5.2 Application Results . . . 178 4.5.3 Summary of Evaluation . . . 182 4.6 Summary . . . 183 5 Conclusion 185 5.1 Summary . . . 185 5.2 Lessons . . . 187 5.3 Future Work . . . 190
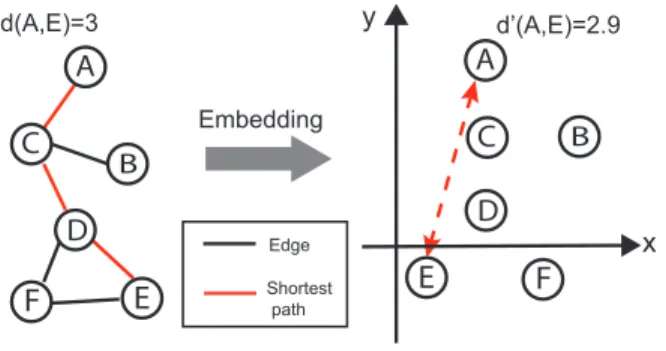
2.1 An example to map graph into a Euclidean space. The shortest path between nodeAandE is 3 hops (left) and their Euclidean distance is 2.9 hops (right). . . 17
2.2 ARE of nodes’ distances with different combination of landmark
selection and computation strategies in India graph . . . 22
2.3 Impact of hyperbolic curvature on accuracy. . . 27
2.4 Impact of dimensionality on embedding accuracy. . . 28
2.5 A high-level view of how embedding is parallelized and its net im-pact on embedding latency for Renren, our largest graph. . . 30
2.6 Average speedup achieved by Parallel Rigel on different cluster
configurations. . . 31
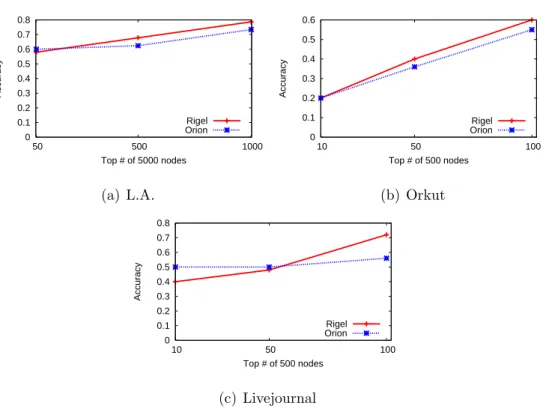
2.7 Average accuracy of queries for the top k high centrality nodes.
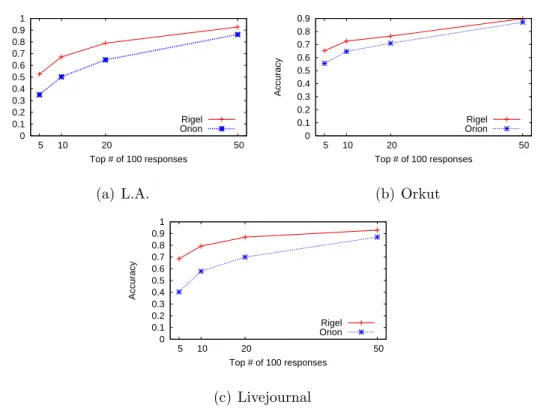
Rigel consistently outperforms Orion. . . 34 2.8 Average accuracy of social search queries that return topk ranked nodes . . . 35 2.9 Absolute error (in hops) of shortest paths returned by Rigel Paths,
Sketch, SketchCE, SketchCESC and TreeSketch. . . 40
2.10 CDF of the absolute error in path finding among Rigel Paths,
Sketch, SketchCE, SketchCESC and TreeSketch. . . 41
2.11 CDF of computing time in path finding among Rigel Paths, Sketch,
SketchCE, SketchCESC and TreeSketch. . . 43
2.12 Relative error CDF of random-walk distances embedding using Orion in Facebook graphs . . . 49
2.14 An example of two nodes in our new coordinate space composed of the 2D Euclidean space and two heights. The vertical lines rep-resent height vectors, and the arrows mark the directionality (incom-ing/outgoing). The lineerepresents the distance in the Euclidean space, and the red dashes represent the predicted random walk distances pro-duced by our system. Note that a node’s outgoing vector is typically
smaller than its incoming vector. . . 54
2.15 Percentage of visited nodes vs. the computation time of a random walk normalized by the time to visit all nodes. . . 57
2.16 Percentage of nodes with stable hitting time vs. Repeating times of random walks . . . 58
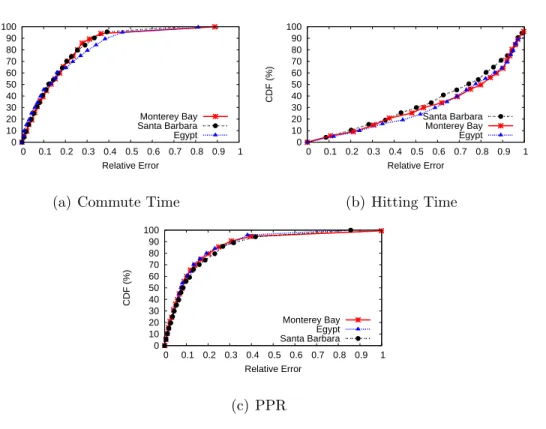
2.17 Relative error CDF of embedding Hitting Time, PPR and Com-mute Time in Egypt using 10D Leo vs. 10D Orion. . . 60
2.18 Impact of embedding dimension on the accuracy of hitting time. . 62
2.19 Accuracy of Top k ranked nodes. . . 68
3.1 Network growth over time. . . 83
3.2 The evolution of four important graph metrics over time. . . 84
3.3 The portion of edges created by new nodes each day. . . 88
3.4 Evolution of α(t). . . 89
3.5 Tracking communities over time and the impact of δ. . . 94
3.6 Analysis on the evolution of communities. . . 96
3.7 Comparing activity of users inside and outside communities. . . . 97
3.8 The number of active users over time after the network merge event. 101 3.9 Analysis of edge creation over time after the network merge event. 102 3.10 Distance between the two OSNs over time . . . 104
3.11 The number of new edges created per second in the sampled dataset. 111 3.12 Variance analysis in the sampled dataset. . . 112
3.13 R/S analysis in the sampled dataset. . . 112
3.17 The estimate of H of all the disjoint 3-hour segments between
September - December 2007 on the dataset without sampling. . . 117
3.18 CCDF of edge # created per user in Dec. 2007. . . 120
3.19 Synthetic edge creation process in Dec. 2007 . . . 127
3.20 Variance analysis of synthetic edge creation. . . 127
3.21 R/S analysis of synthetic edge creation process. . . 127
3.22 Wavelet analysis of synthetic edge creation process in segments of 3 hours. . . 128
3.23 The synthetic network growth trace of Dec. 2007 generated by the temporal component vs. the original network growth trace in Dec 2007. 129 3.24 Network growth fitted by F(n). . . 131
3.25 Synthetic graph dynamic properties . . . 132
4.1 An illustrative example of thedK-series. ThedK-2 series captures the number of 2-node subgraphs with a specific combination of node-degrees, and the dK-3 captures the number of 3-node subgraphs with distinct node-degree combinations. . . 150
4.2 Overview of Pygmalion. ǫ-differential privacy is added to measured graphs after sorting and clustering the dK-2-series. . . 152
4.3 The noise required for different privacy levels quantified as the Eu-clidean distance between a graph’s original and perturbed dK-2 series. 159 4.4 Euclidean distances of the dK-2-series of different ǫ-Differential Privacy strategies on three real graphs. . . 170
4.5 Degree distribution of three real measured graphs, i.e. Russia, WWW and AS, each compared to thedK-synthetic graph without noise and Pygmalion synthetic graphs with different ǫ values. . . 174
4.6 Assortativity of three real measured graphs, i.e. Russia, WWW and AS, each compared to the dK-synthetic graph without noise and Pygmalion synthetic graphs with different ǫ values. . . 175
4.7 Average path length of three real measured graphs, i.e. Russia, WWW and AS, each compared to thedK-synthetic graph without noise and Pygmalion synthetic graphs with different ǫ values. . . 177
without noise and Pygmalion synthetic graphs with different ǫvalues. . 179
4.9 Results of the Degree Discount Influence Maximization algorithm
on the AS graph, compared to dK graphs without added noise, and
Pygmalion synthetic graphs with different ǫ values. . . 180 4.10 Results of the Degree Discount Influence Maximization algorithm on the MontereyBay graph. . . 181
2.1 Datasets used in our experiments. . . 14
2.2 Evaluating different embedding spaces via several metrics on the
Facebook LA graph. . . 26
2.3 Response time for Rigel-S, Rigel and BFS. . . 29
2.4 Comparing the time complexity of Rigel and Parallel Rigel
(P-Rigel) using a cluster of 50 servers. . . 31 2.5 Comparing separation metric results, as computed by Rigel, Orion, and BFS (ground truth). . . 32
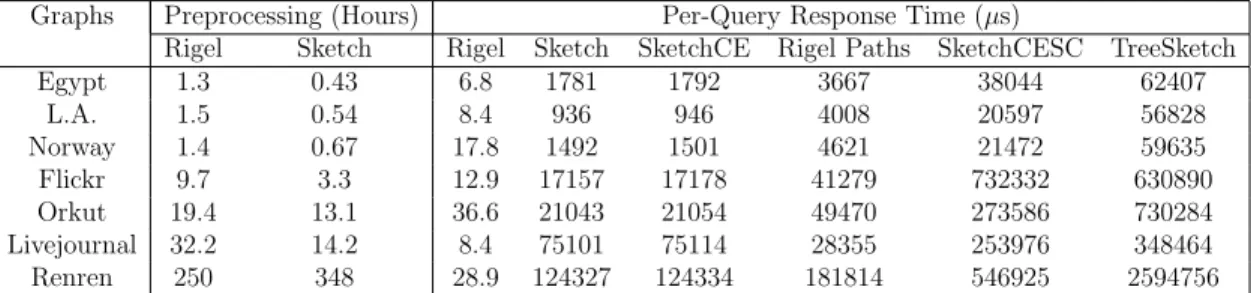
2.6 Comparing the preprocessing times and per-query response times
of Rigel Paths, Sketch and variants SketchCE, SketchCESC and TreeSketch. Preprocessing/embedding time for Rigel (and Rigel Paths) is for single server (non-parallel version). . . 42 2.7 90th percentile relative errors for Hitting time, PPR and Commute time (Leo vs. Orion w/ 10 dimensions) . . . 61
2.8 Computation time of Leo on three largest real graphs, including
bootstrap time and per-query response time. . . 64
2.9 Link prediction application accuracy using hitting time, commute
time, and PPR, based on Ground Truth (GT) and Leo. . . 69
3.1 Statistics of 3-hour segments with start time shifts. . . 116 3.2 Self-similar analysis on the self-similar component of the synthetic data. . . 126 3.3 Statistics of the original graph and the synthetic graph generated by our spatial component. . . 130
Introduction
Graphs are fundamental abstractions of network structures. They are every-where, ranging from biological protein interaction networks and Internet rout-ing networks, to emergrout-ing online social networks. Studyrout-ing graphs is critical to understanding the fundamental processes behind networks, and of practical implications in real world applications. For example, understanding and mod-eling influence propagation in online social networks, such as Facebook, Twit-ter, and Renren, is important for the service providers to successfully launch social advertising [33]. In previous decades, there have been many studies on graphs [104, 102, 182, 117, 5, 6, 18]. Most of the prior work focused on small or synthetic graphs [104, 102, 182, 117, 5, 6, 18], such as arXiv citation networks, DBLP collaboration networks, and Email communication networks.
More recently, because of the unprecedented increase of existing networks, such as Internet, and the emergence of new networks like online social networks, more and more big real graphs are becoming available. Compared to the graphs studied in prior work, these big real graphs are significantly different in the following three aspects. First, big real graphs are much larger in scale. For example, in online
social networks, like Facebook, Twitter, and LinkedIn, there are millions or even billions of users while only hundreds of thousands of nodes exist in the graphs in prior studies, such as arXiv networks and DBLP networks [104, 102, 182, 117, 5, 6, 18]. Second, big real graphs have higher level of dynamics. Compared with online social networks like Renren, which has hundreds of thousands of new users and more than 1 millions new edges per day, there are only thousands of new nodes and new edgesper yearin the arXiv network [104]. Third, from the perspective of graph structure, big real graphs have significantly distinct properties. Take graph density as an example. In online social networks, such as Facebook, its average degree of each user are more than 190 [12], which is several times larger than the average degree in the prior graphs [104].
Thus, it is challenging to understand big real graphs. First, because of their sheer size, many traditional graph algorithms are not scalable in big real graphs, which makes processing these graphs extremely difficult. For example, to com-pute one shortest path in a graph with millions of nodes and billions of edges, it can take up to minutes or even an hour using breadth-first search (BFS), which is too slow to support any real-time applications based on shortest paths. Sec-ond, although many studies have worked on dynamic graphs [104, 102, 5, 6], few progress is reported on understanding high volume of graph dynamics. In order to understand dynamic processes in big real graphs, systematic analysis methods and comprehensive dynamic graph models are desired. Third, protecting privacy in sharing big real graphs is a new issue. This is because the structure of big real graphs may contain sensitive information, such as strength of social ties, number and frequency of social interactions, and information flows in online social net-works. Sharing such graphs raises risks to expose users’ private information to
the public. Therefore, how to preserve graph privacy is becoming one important problem in studying big real graphs.
My research work aims to address the above three challenges in big real graphs, and the statement of this dissertation is as follows:
To analyze and process an increasing number of big real graph datasets today, we need to build tools and algorithms to address issues of scale, dynamics, and data privacy.
Driven by the statement, the following are the three goals in this dissertation. First, we target on a fundamental graph processing problem, i.e. node distance computation. As a primitive of graph analysis and network applications, the com-putation of shortest path or random walk distances is comcom-putationally expensive. In this dissertation, we design a new node distance computation method, named graph coordinate systems, which can accurately approximate node distances in constant time. The second goal of the dissertation is to understand and model dynamic processes in big real graphs. Specifically, we propose methods to ana-lyze graph dynamics at multiple network scales, and explore temporal properties of network growth. Based on the observations, we design a new dynamic graph model to capture both temporal and spatial dynamic properties. Finally, we tackle privacy issue in sharing graphs. To protect graph privacy, we design a differentially-private graph model, which can guarantee the required level of pri-vacy while maintaining a meaningful graph structure. In the following, we briefly introduce the work included in this dissertation.
1.1
Efficient Node Distance Computation
Node distance computation, including shortest path distances and random walk distances, is computationally expensive, and difficult to scale to big real
graphs. To address this problem, we propose an efficient approach, named graph
coordinate systems, which can accurately estimate node distances in real time. At high level, in graph coordinate systems, we embed graph nodes to a geo-metric space. After the embedding, each node can be represented by its geogeo-metric coordinates. With the coordinates, we estimate the distance between any pair of nodes by computing their geometric distance, which is a constant time computa-tion. Based on this idea, we propose the framework of graph coordinate systems, which is a landmark-based scheme.
To accurately embed shortest path distance in large graphs, we explore two key design decisions in the implementation of a graph coordinate system, including choice of geometric spaces and scalable embedding process. By implementing three graph coordinate systems using three well-studied geometric spaces, such as Euclidean space, spherical space, and hyperbolic space, we study the impact of geometric spaces on estimation accuracy, and find that the hyperbolic space performs the best out of the three spaces. Thus, we adopt the hyperbolic space in the design of the graph coordinate system to embed shortest path distances. Further, to scalably embed big real graphs, we naturally parallelize the embedding process across multiple servers. The resulting parallel hyperbolic graph coordinate system is calledRigel. Moreover, we propose a heuristic method to locate shortest paths using the generated coordinates. By running the system on different big
real graphs, we show that Rigel can accurately approximate graph shortest path distances in microseconds.
Different from shortest path distances, graph coordinate systems using tradi-tional geometric spaces can not accurately approximate asymmetric random walk distances. To address this challenge, we study the cause of the asymmetry in random walks, and propose a new space with two independent height vectors to explicitly account for the asymmetry. By embedding various large graphs, we show that the new space not only accurately estimates asymmetric distances, such as hitting time and personalized PageRank (PPR), but also improves the accuracy of symmetric distance prediction, like commute time.
1.2
Dynamic Graph Analysis and Modeling
In this work, we analyze and model the high level of dynamics in big real graphs. More specifically, we aim to design systematic dynamic graph analysis methods, and build a complete dynamic graph model that can capture both tem-poral and spatial dynamic properties. To make it concrete, we focus on analyzing dynamics in a large time-stamped social network, Renren, with 19 million nodes and 199 million edges.
To comprehensively understand dynamics in the Renren network, we measure the network in two dimensions: spatial dimension and temporal dimension. In spatial analysis, instead of considering a single dynamic process in the graph, we understand users’ activities at different network levels. In particular, we propose a multi-scale dynamic measurement method, including individual node level, com-munity level, and network level. At each level, we seek for the evidence of the
underlying processes, and learn how they impact users’ behavior. Along the way, we also make a number of intriguing observations about dynamic processes in net-work communities and netnet-work-wide events. In temporal analysis, we explore the efforts to detect and identify the existence of self-similarity in Renren’s network growth. Self-similarity refers to that the relative variance or volatility of a dynamic process stays similar across different time scales. Because of the non-stationary diurnal pattern in Renren’s network growth, it is challenging to detect self-similar properties in a statistically rigorous manner. To overcome the challenge, we use a range of different detection algorithms to reliably identify self-similar properties.
Finally, to capture the observed spatial and temporal properties, we propose a new dynamic graph model. It includes a temporal component and a spatial component, which explicitly accounts for “when” and “where” an edge is created. As a whole, this model can produce a sequence of graph events that captures the evolutionary dynamics in graph structure. By calibrating the model with the Renren network, the generated graphs not only reproduce the self-similar edge creation process but also match the evolution of several structural metrics.
1.3
Graph Privacy
Successes of studies on big real graphs strongly depend on the availability of the graphs from the real networks. However, sharing graph data raises risks to expose sensitive users’ data to the public. Unfortunately, current studies [71, 111] only focus on defending a specific attack, and have been proved vulnerable [13, 126, 127]. In our work, our goal is to design a graph privacy system that can
both maintain a meaningful graph structure and provide strong privacy guarantee without any assumptions about attacks.
To balance such tradeoff, we propose a differentially-private graph model, called Pygmalion. Given a graph and a desired level of privacy guarantee, the system extracts the graph structure represented by the joint degree distribution, adds a controlled level of noise, and produces synthetic graphs similar to the original graph.
However, by running this method on big real graphs collected from various networks, we find that directly adding the required noise to the graph structure representation introduces high distortion into the generated synthetic graphs. To maintain the utility of differentially private graphs, we further develop a partition-ing method, which significantly reduces amount of added noise while providpartition-ing the same level of privacy guarantee. We run the improved system on the same set of graphs. The results show that the generated synthetic graphs consistently match their original graphs in terms of graph structural metrics and application-level performance.
1.4
Contributions
In this dissertation, there are two key contributions to the study of big real graphs. First, we design novel systems or solutions to address the important problems in big real graph study. In Chapter 2, we propose the framework of graph coordinate systems, which can efficiently approximate node distances with high accuracy. Based on this framework, we implement a practical graph co-ordinate system to embed shortest path distances. Furthermore, to accurately
capture asymmetric distances, we design a novel embedding space with two in-dependent heights. In Chapter 3, we develop a multi-scale measurement method to understand graph structural dynamics. Also, inspired by lessons from network traffic modeling, we explore the self-similar properties in Renren edge creation process. Based on the measurement results, we propose a new dynamic graph model, which not only captures the structural evolution but also produces the sequence of edge creation events in absolute time. At the last of this dissertation (Chapter 4), we apply differential privacy to address graph privacy issue. The proposed differentially-private graph model can generate synthetic graphs similar to the original graph in terms of structure with a desired privacy guarantee.
Second, we validate our solutions on a range of big real graphs. To demonstrate the generality of our designed systems, including the graph coordinate systems and the differentially-private graph model, we evaluate their performance on a number of big real graphs collected from various networks, including different online social networks and computer networks. The results from these graphs show that in most of big real graphs, our systems can consistently perform well. Our work in Chapter 3 is the first dynamic study on such massive scale. By fitting the model with the Renren dynamic dataset, we generate synthetic graphs showing dynamic properties similar to the Renren network.
1.5
Thesis organization
The roadmap of the dissertation is as follows:
In Chapter 2, we describe the design of graph coordinate systems. We be-gin with description of the framework of graph coordinate systems. Then we
implementation a graph coordinate system to embed shortest path distances by exploring studying two design decisions, such as embedding space and scalable embedding process. We also run it on three applications to demonstrate its accu-racy, and propose a heuristic method to locate shortest path with the generated coordinates. Finally, we explore a new embedding space to explicitly account for the asymmetry of random walk distances, and evaluate its performance on various networks.
In Chapter 3, we elaborate our analysis on the Renren dynamic dataset, and describe a new dynamic model based on the measurement. After describing the dataset and showing basic measurement results, we introduce our measurement on Renren graph structure at different network levels, including nodes, commu-nities, and networks. Second, we apply three methods to detect and identify the self-similar properties in edge creation process, which is an important temporal property in network growth. At last, to reproduce the observed spatial and tem-poral properties, we propose a new dynamic graph model combining a temtem-poral component and a spatial component, and validate it using the Renren dataset.
In Chapter 4, we propose a differentially-private graph model to protect graph privacy. Following the background, we propose our basic solution by applying differential privacy to graphs. Because of high distortion in the graphs generated by the basic design, we improve the system using a partitioning method, and provide a rigorous proof to show the improved system maintains the same level of differential privacy with much less noise. Finally, we use different big real graphs to evaluate the structure utility of the generated graphs.
At the end of this dissertation, we summarize the work, and discuss future directions.
Efficient Node Distance
Computation
2.1
Introduction
1 Analysis of large graphs is critical to understanding the ongoing growth of complex networks, such as online social networks, biological protein interaction networks, and Internet router backbone. One important measure in such analysis is to compute node distance. Such distance can be quantified either by short-est path, or by random-walk distances, such as commute time, hitting time and personalized PageRank (PPR).
Computing the shortest path distance between two nodes is a primitive that lies at the core of both graph analysis and complex network applications. For
example, in a network of n nodes, computing exact values for node separation
metrics like graph radius, diameter and average path length, requires
comput-1
Abbreviated version of content in this chapter can be found in papers ”Orion: Shortest Path Estimation for Large Social Graphs” [186], ”Efficient Shortest Paths on Massive Social Graphs” [187], ”Fast and Scalable Analysis of Massive Social Graphs” [188], and ”On the Em-beddability of Random Walk Distances” [184].
ing O(n2) shortest path. Node distance is also the determining factor for other common graph problems, such as centrality and mutual friend detection.
Unfortunately, current algorithms to compute shortest path distances cannot scale with graph size. For a graph withn nodes and m edges, efficient implemen-tations of traditional algorithms, such as breadth-first-search (BFS), Dijkstra and Floy-Warshall, compute short path between two nodes in O(nlogn +m) time, and all pair shortest-paths in Θ(n3) [36]. Tolerable for small graphs, the com-putation for a single pair of nodes on a large million-node graph can take up to minutes on modern computers [141]. Given the prohibitively high costs of storing precomputed distances, researchers have little choice but to sample portions of the graph or seek approximate results.
In this chapter, we propose a novel method to approximate shortest path
distance computation, called as Graph Coordinate Systems. A graph coordinate
system maps nodes in high dimensional graphs to positions in a geometric space. Using the coordinates associated with each graph node, we can use a simple ge-ometric distance computation to estimate, in constant time, its distance to any other node in the graph.
Moreover, compared to shortest path distances, random-walk distances are more useful in term of quantifying similarity between nodes in graphs. For exam-ple, social networks like LinkedIn often provide a measure of similarity between users. Pure shortest path distance cannot reflect the strength of ties between users. An alternative uses the number of paths between nodes. But this fails to capture the impact of a user’s degree, i.e. m paths between userA and user B is
more significant when A and B each have few friends. On the contrary, random
affinity between graph nodes, namely the node distance and the number of paths. Intuitively, two nodes are more similar if they are close in terms of their graph distance. Independently, two nodes are more similar if they have more paths between them. Random walk distances, such as commute time, hitting time and PPR, successfully capture both of the notions through the simple iterative random walk process.
However, the computation of random walk distances is also computationally expensive. For example, hitting time is the expected number of random walk hops from a source node to a destination node. Computing the expected hitting time
from node A to node B requires computing hundreds of thousands of random
walks. Such costs are intractable in today’s massive graphs with millions of nodes and billions of edges. Assuming the availability of sufcient memory resources, Computing a single hitting time on a massive graph can take anywhere from minutes to an hour or longer. Thus, it is unsurprising that random walk distances are rarely used in practice.
With the proposed graph coordinate systems, we investigate the possibility of using a geometric space embedding to provide an efficient way to answer queries on random walk distances. Unlike shortest path length, random walk distances, such as hitting time and PPR, are asymmetric, i.e. the distance from node A to nodeB may be not the same as the distance in the reverse direction. In addition, the distances in any geometric space,e.g. Euclidean space or hyperbolic space, are symmetric. The asymmetry of random walks can cause high errors in embedding graphs into a geometric space, which is confirmed by our extensive measurements. Based on this observation, we design a new space for graph coordinate systems to account for the asymmetry of random walks.
In this chapter, we make four contributions. First, we propose graph coordi-nate systems, i.e. the use of embedding graphs into geometric spaces, as a new method to approximate node distances in constant time. By explaining the de-sign goals, we describe a landmark-based framework of graph coordinate systems. In the design, we consider and discuss several schemes to select and compute landmarks.
Second, we use graph coordinate systems to embed shortest path distances, and explore the key design decisions in the implementation of graph coordinate systems, including choice of geometric spaces and parallel techniques to fast embed large graphs. The study results in a parallel hyperbolic graph coordinate system named Rigel, which estimates shortest path distances in microseconds with high accuracy.
Third, we propose an algorithm to efficiently locate shortest paths between node pairs with the generated coordinates. Comparing with several sketch-based algorithms, our method is more efficient in finding shortest paths, which matches the best accuracy of these algorithms.
Finally, considering the power of random walk distances in applications, we design a new embedding space to capture the asymmetry of random walk dis-tances. Based on the insight of the asymmetry of random walks, we propose two independent heights to capture the intuition of graph density on a per-node basis. In addition, we propose a simple low cost technique to generate ground truth. With the two techniques, we implement a new practical graph coordinate system named Leo. By running Leo on a range of big real graphs, the extensive exper-iments show that using this new graph coordinate system not only accurately
Networks Node # Edge # Avg. Degree Monterey Bay 6K 31K 10.26 Santa Barbara 26K 226K 17.05 Egypt 246K 1,618K 13.12 Los Angeles 275K 2,115K 15.38 Norway 293K 5,589K 38.15 India 363K 1, 556K 8.57 Flickr 1,715K 15,555K 18.14 Orkut 3,072K 117,185K 76.29 Livejournal 5,189K 48,942K 18.86 Renren 43,197K 1,040,429K 48.17 Collaboration 21,363 91,342 8.55 AS 26,475 533,831 40.33 Citation 34,401 420,828 24.47 P2P 62,562 147,878 4.73 Email 224,832 339,925 3.02 Amazon 262,111 899,792 6.87 Web 325,729 1,117,563 6.86 Planar 265,722 531,441 3.99
Table 2.1: Datasets used in our experiments.
estimates the asymmetric random walk distances, but also significantly improves the accuracy of symmetric distances.
2.2
Experiment Datasets and Evaluation
Met-rics
Before we describe the details of graph coordinate system designs, we first introduce the graph datasets used in later sections, and explain the metrics used to evaluate the performance of the systems.
2.2.1
Datasets
Throughout this chapter, we use a number of anonymized graph datasets gath-ered from different networks to evaluate our system design. We utilize 17 graphs
listed in Table 2.1, ranging in size from 6K nodes and 31K edges, to 43 million nodes and 1 billion edges. We also generate one synthetic planar graph for the evaluation. We use these graphs to demonstrate the scalability and applicability of graph coordinate systems across a variety of graph topologies.
Listed in Table 2.1, six of the graphs, Monterey Bay, Santa Barbara, Egypt, Los Angeles, Norway and India, are Facebook regional networks [179]. We also use four large graphs collected from four different online social networks, i.e. Flickr, Orkut, Livejournal [125], and Renren [78]. The next seven graphs in Ta-ble 2.1 are from various networks. They are a collaboration network graph from arXiv [105], an Internet Autonomous system (AS) graph from CAIDA [104], a ci-tation graph from arXiv [104], a snapshot of the Gnutella peer-to-peer file sharing network [104], a measurement Email network graph of a large European research institution [105], an Amazon product co-purchasing graph [100], and a web graph from North Dame [7]. Finally, we produce a synthetic planar graph using the Dorogovtsev-Goltsev-Mendes Internet Model [46]. In each section of this chap-ter, we run the experiment on a subset of the graphs in Table 2.1 to show the performance of the graph coordinate systems.
2.2.2
Evaluation Metrics
Accuracy Metrics. We use Relative Error to evaluate the accuracy of graph coordinate systems. For each node pair in a graph, the relative error is the ratio of the absolute difference between the ground truth node distance and the geometric node distance (the estimated distance) to the ground truth distance. A smaller relative error means the estimated node distance matches the ground truth better.
We also use two other metrics to describe the accuracy of the system. The first metric is average relative error (ARE) of the estimated distances, which is used in evaluating the accuracy of the graph coordinate systems when embedding shortest path distance. The second accuracy metric is the 90th percentile relative error over all node pairs, called 90th relative error, which is the key metric to measure the accuracy of embedding random-walk distances.
Efficiency Metrics. To investigate the efficiency of the system, we use compu-tation time. It includes two parts,i.e. the system bootstrap time and the response time for per query. First, the system bootstrap time involves two main opertation time, including the time to measure distances between each landmark and all the other nodes and the time to compute coordinates for all nodes. As shown later, since the complexity of embedding scales linearly with graph size, we parallelize the bootstrap process across multiple servers. In this case, the parallel bootstrap time is defined as the longest computation time for the servers used in the par-alle embedding process. Second, the response time for per query is measured as the average time to compute pairwise node distances using generated coordinates. Our measurement results show that the per-query response time in our system is almost constant time in microseconds after up to several hours of bootstrap process. This bootstrap time is acceptable since bootstrapping is a one-time cost, which enable us to respond queries in real time.
2.3
Graph Coordinate Systems
The goal of our work is to accurately and efficiently estimate distance between any two nodes in large graphs. To achieve this goal, we propose graph coordinate systems, which use a geometric coordinate space to capture node distances on large graphs.
In this section, we first explain the goals of graph coordinate system design. Then, based on the goals, we describe a landmark-based framework of graph co-ordinate systems, and discuss different methods to select and compute landmarks. Finally, through experiments on several graphs collected from Facebook, we study the impact of three landmark selection schemes on the accuracy.
Shortest path Edge Embedding d’(A,E)=2.9 d(A,E)=3 E F D y x B C A B C A F E D
Figure 2.1: An example to map graph into a Euclidean space. The shortest path between node A and E is 3 hops (left) and their Euclidean distance is 2.9 hops (right).
2.3.1
Design Goals
Graph coordinate systems are designed to efficient approximate node shortest path distances with high accuracy. At a high level, this approach captures complex graph structures by embedding node shortest path distance relationships into a
geometric space, such as a Euclidean space, a spherical space and a hyperbolic space. Each node is represented by a set of coordinate in the geometric space such that its distance to another node in the geometric space matches its shortest path length to the node in the actual graph. For example in Figure 2.1, the shortest path between nodeAand nodeE is 3 hops in the graph and the Euclidean distance calculated using their coordinates is 2.9.
Graph coordinate systems work in two phases. First, nodes in the graph are it-eratively added to the coordinate space, the position of each node being calibrated by ground truth node-distance measurements. This “calibration phase” is where a graph coordinate system incurs its one-time computational overhead. Once all nodes in the graph have been added, the resulting system can be integrated with graph applications to answer node distance queries with estimates.
Since the per-query computation cost is O(1), the focus of our design is to ensure the calibration phase is computationally efficient, and the results are as accurate as possible. More specifically, our goals are three-fold:
• Scalability. The computational cost of the calibration phase must scale
linearly with the number of nodes, i.e. O(n).
• Accuracy. While individual node distance predictions might incur
reason-able errors, predictions should approximate ground truth at the large scale.
• Fast convergence. Impact of individual node calibrations should be localized, i.e. should not trigger significant new adjustments to their neighbors. Based on these goals, we describe the design and explain key decisions in the next section.
2.3.2
A Landmark-based Framework
To accurately translate pairwise hop-count distances in the graph into geomet-ric distances in the coordinate space, the framework of graph coordinate systems is based on landmarks, where the positions of all nodes are calibrated with their rel-ative distances to a fixed number (k) of chosen landmark nodes. Landmark nodes are initially chosen from the entire graph based on their position and degree of connectivity.
We use a landmark-based scheme in the framework for two main reasons. First and foremost, we wish to minimize the number of shortest path computations needed to establish ground truth on the actual graph, since each computation can, in the worst case, require a full traversal of the graph. Using a landmark approach, we limit the total number of Breadth-First-Search operations to k, the number of landmarks. Each BFS computes the shortest path distance from a landmark to all other nodes. Computing BFS for all landmarks essentially precomputes all values needed to calibrate all nodes in the graph.
The second advantage of a landmark-based scheme is that the positions of incoming nodes depend only on the landmark nodes. This bounds the number of operations required to compute a node’s position, guaranteeing fast convergence. In contrast, in decentralized models adding a new node will often force its nearby neighbors to make adjustments on their position, a process that can propagate adjustments iteratively throughout the entire space.
Scalable Landmark Coordinates. Intuitively, the number of landmarks used to calibrate a graph should have a direct impact on the accuracy of the Euclidean mapping. The highly connected and complex nature of social graphs leads us to
believe that an accurate graph coordinate system requires a significant number of landmarks. The challenge is to find a way to accurately and quickly compute the coordinates for a large number of landmarks.
To compute a node’s D-dimension coordinates, we consider Simplex
Down-hill algorithm [128] by minimizing the sum of squares of prediction errors. The algorithm runs in O(k2 ·D) time to compute coordinates of k landmarks. Since running Simplex Downhill on our desired number of landmarks (up to 100 in our study) is computationally expensive, we propose a new approach, where we sep-arate our landmarks into two groups, a small initial group of 16 landmarks, and a larger secondary group composed of the remaining landmarks.
We leverage the Simplex Downhill algorithm to compute the coordinates for the initial (kI = 16) landmarks, thus its asymptotical complexity is O(kI2 ·D). The secondary group of landmarks calibrate their positions using the initial kI landmarks as anchors, contributing to a computational complexity of onlyO(kI·D) each. Thus, the total time required to compute landmark coordinates is O(kI2 ·
D) + (k−kI)×O(kI ·D), where k is the total number of landmarks.
Furthermore, we describe two ways to compute the coordinates of the sec-ondary group of landmarks, while maintaining the same computational
complex-ity. In the global approach, we compute the coordinates of each node in the
secondary group relying only on the initial group as anchors. In the incremental landmarks approach, nodes in the secondary group are added one by one. Once a node receives its coordinate values, it becomes an anchor for all remaining nodes. To compute its coordinates, any remaining node in the secondary group can choose any kI nodes from all embedded nodes to be its landmarks.
Landmark Selection. Finally, we consider the problem of choosing landmark nodes to produce the most accurate graph to geometric coordinate mapping. Prior work by Potamias et. al considered the problem of choosing landmarks, and con-cluded experimentally that choosing nodes with high centrality performed signifi-cantly better than random choice [141]. Given the complexity of computing node centrality, we consider two groups of alternative landmark selection strategies as possible approximations of centrality-based selection: Random and High-degree.
• Random. This is the basic landmark selection strategy. Landmarks are chosen uniformly at random from all nodes in the graph.
• High-degree. Prior measurements on social networks [125, 179] show that social graphs exhibit a power-law-like degree distribution. Intuitively, high degree nodes reside at the core of social graphs, effectively approximating central nodes. This strategy chooses nodes with the highest degree.
• Landmark separation. Closely positioned landmarks are less effective at “covering” the graph as anchors. Therefore, we add variants to the two basic strategies, where we select the landmarks one by one, ignore any po-tential landmarks that are too close in the graph to existing landmarks, and continue selecting landmarks until the desired number has been met.
Summary. The framework of graph coordinate systems works as a landmark-based scheme, where an initial core of 16 landmarks is first fixed in the space using Simplex Downhill optimization. A secondary group of landmarks position themselves based on the original landmarks. Finally, all remaining graph nodes
0 0.05 0.1 0.15 0.2 0.25 0.3 0.35 0.4
Original 2-hop 3-hop 4-hop
Average relative error
Minimum distance between landmarks Random Strategy (Global) High-degree Strategy (Global) Random Strategy (Incremental) High-degree Strategy (Incremental)
Figure 2.2: ARE of nodes’ distances with different combination of landmark selection and computation strategies in India graph
calibrate their positions based on node distances obtained from computing BFS from all landmarks.
2.3.3
Evaluating Landmark Selection Strategies
We now empirically evaluate the effectiveness of the landmark selection strate-gies. Based on framework, we implement a prototype graph coordinate system,
named Orion [186], which embeds node shortest path length into a Euclidean
space. In the evaluations, we select 1000 random nodes and compute the pairwise distances between them with different landmark computation methods. The met-ric used here is the average relative error (ARE). All the experiment is repeated
for 5 times and on the four largest Facebook graphs, i.e. Norway, Egypt, Los
Angeles and India, in Table 2.1.
As the results on the four graphs are consistent, we only show India in Fig-ure 2.2 for brevity. FigFig-ure 2.2 plots AREs for a variety of landmark selection strategies using the India graph. It shows that the graph coordinate system using Euclidean space provides low relative errors compared to actual path lengths for different landmark selection strategies. Among the considered strategies,
high-degree strategies can produce slightly lower errors. Furthermore, the impact of landmark separation on the accuracy of shortest path length estimation is fairly small. Overall, the two landmark strategies have no significant impact on the accuracy. Thus, in the later sections of this chapter, we use the Random method to select landmarks.
2.4
Embedding Shortest Path Distances
In this section, we apply graph coordinate systems to embed shortest path distances. Although the study in Section 2.3 shows that the system can accu-rately approximate shortest path distances using a Euclidean space, there are two key questions to be addressed when implementing a practical graph coordinate system in practice. First, among different geometric spaces, such as a Euclidean space, a spherical space and a hyperbolic space, can we find a better space in terms of the accuracy in embedding shortest path? Second, since the centralized embedding process is computationally expensive in large graphs, can we improve the embedding process to scale with large graphs?
In this section, we address the above two key questions and implement a practical graph coordinate system for shortest path distances called Rigel. First, we study the embedding accuracy using the three popular geometric spaces, and determine to use the most accurate space in capturing shortest path distances, i.e. a hyperbolic space. Second, we naturally parallelize the embedding process across servers. The embedding time can be significantly accelerated. In addition, in Section 2.4.4, we propose an approach to approximate shortest path for any node pair using graph coordinates. Comparing with the proposed algorithms,
our proposed method produces the accuracy similar to the most accurate scheme, while resolving queries up to 18 times faster.
2.4.1
Choice of Geometric Spaces
Based on the framework of graph coordinate systems, we now study the impact of geometric spaces on the estimation accuracy. First, we introduce three popular geometric spaces: a Euclidean space, a spherical space and a hyperbolic space, and empirically compute the distortion metrics [110] using different spaces.
Discussion on Geometric Spaces. A Euclidean spaceis the most widely used coordinate space. Each node in aD-dimension Euclidean space is represented by a D-dimension coordinate, i.e. (x1, x2, ..., xD). The distance between any two
nodes, A and B, is calculated by Equation 2.1. The dimension of a Euclidean
space may impact the estimation accuracy of the graph coordinate system.
dAB =
q ΣD
i=1(xAi −xBi )2 (2.1)
A spherical space is a 3-dimension space, which is the nature representation of a sphere, such as the Earth. One representation of a node’s spherical coordinate is a tuple (r, φ, λ), wherer is the radius of the sphere, φ is the latitude and λ is the longitude. The distance between two nodes, A and B, in a spherical space is the shortest distance between the two nodes on the surface of the sphere, which is computed using Equation 2.2. The radius of a spherical space is an important parameter in defining a spherical space.
A Hyperbolic space can be thought of a space with a tightly connected core, where all paths between nodes pass through. There are five known “Hyperbolic models” that have been proposed for different purposes and graph structures, including the Half-plane, the Poincar´e disk model, the Jemisphere model, the Klein model and the Hyperboloid model [153]. Each model is a different method of assigning coordinates and computing distances over the same hyperbolic structure. Since choosing a model fundamentally changes how graphs can be embedded, it is currently unknown how the choice of models affects embedding distortion.
In our design, we chose theHyperboloidmodel for two practical reasons. First, computing distances between two points in this model is computationally much simpler than alternative models. Second, the computational complexity of calcu-lating distances is independent of the space curvature. This gives us additional flexibility in tuning the structure of the hyperbolic space for improved embedding accuracy.
For a Hyperboloid model with curvaturec, the distance between twon-dimension points x= (x1, x2, . . . , xn) and y= (y1, y2, . . . , yn) is defined as follows:
δ(x, y) = arccosh v u u t(1 + n X i=1 x2 i)(1 + n X i=1 y2 i)− n X i=1 xiyi · |c| (2.3)
We empirically evaluate the accuracy of the above three graph coordinate systems using the three popular geometric spaces. Here, we use a 10-dimension Euclidean space, the best tradeoff between accuracy and efficiency [186]. In the Hyperbolic graph coordinate system, we use the curvature parameterc=−1 and the dimension of the space is also 10, which gives us the best accuracy in the later
Metrics Euclidean Hyperbolic Spherical Ideal Value ARE 0.16 0.10 0.36 0 AAE 0.78 0.50 1.83 AER 0.97 1.00 0.91 1 ACR 1.07 1.02 1.72 ASPD 1.19 1.11 1.96 SD 58.46 30.63 134173.04
Table 2.2: Evaluating different embedding spaces via several metrics on the Facebook LA graph.
study. For a fair comparison, we vary the radius of the spherical space from 5 to 50, and display the best results.
We run the experiment on LA graph in Table 2.1 and use different distor-tion metrics [110], including average relative error (ARE), average absolute error (AAE), average expansion ratio (AER), average contraction ratio (ACR), aver-age symmetric pair distortion (ASPD), and space distortion (SD). The results are shown in Table 2.2. Compared among the three spaces, we find that the hyper-bolic space is significantly more accurate than Euclidean and spherical space in all metrics. This result is consistent previous study in network distance embed-ding [153, 40, 138]. An intuitive explanation is that both social graphs and the Internet topology feature highly connected graph cores, which fit the hyperbolic model well. Therefore, for the best estimation accuracy, we use the Hyperboloid model in the graph coordinate system to embed shortest path.
Optimizing Local Paths. It has been shown in Internet embedding sys-tems [113] that the largest errors are introduced when estimating node distances for nearby nodes, i.e. nodes separated only by 1 or 2 hops. In addition, accuracy in resolving “local” graph queries is critical to many graph operations. In the context of graphs, this is an easy limitation to overcome, since 1-hop neighbors
0 0.05 0.1 0.15 0.2 0.25 0.3 0.35 -1 -5 -10 -20 -30 -40 -50
Average Relative Error
Curvature
Curvature=0 Norway
Egypt L.A.
Figure 2.3: Impact of hyperbolic curvature on accuracy.
are easily accessible via graph representations, e.g. edge lists or adjacency matri-ces. The hyperbolic system uses local neighbor information to augment the node knowledge about its close-by topology. Before answering a query for a pair of nodes, it first checks their adjacency lists to detect if they are direct neighbors or 2 hop neighbors (share a node in their adjacency list), which guarantees 0 dis-tortion in estimating 1- or 2-hop shortest path length. This optimized system is called Rigel.
Embedding Accuracy on Real Graphs. We now investigate how two impor-tant parameters in Rigel, i.e. curvature of the space cand number of dimensions
of the space n, impact the embedding accuracy. Also we evaluate the efficiency
of the system in terms of per-query time. We report experimental results using three Facebook datasets presented in Table 2.1, i.e. Egypt graph, LA graph and Norway graph.
Impact of Curvature. The curvature c of a hyperbolic space is an important parameter that determines the structure of the space. We build different Hyper-bolic spaces using curvature values that range from −50 to 0, and investigate the effect on the accuracy of the distance estimation. When the curvature is 0, the
0 0.05 0.1 0.15 0.2 0.25 0.3 2 4 6 8 10 12 14
Average Relative Error
Dimension Norway
Egypt L.A.
Figure 2.4: Impact of dimensionality on embedding accuracy.
hyperbolic space is equivalent to a Euclidean space. We include this value as the rightmost point in our plot. From our results in Figure 2.3, we see that the average error decreases significantly as the curvature approaches −1. We performed fur-ther fine grain tests with curvature values around−1, and find that the accuracy of our system reaches a plateau near−1. Results at curvature of -1 are 30% more accurate than results from a Euclidean system, shown in the plot as curvature of 0. Thus we use the curvature value at −1 in the rest of this chapter.
Impact of Dimensionality. The number of dimensions of a geometric space plays an important role in determining the accuracy level in the estimate of dis-tances between nodes. Therefore, we vary the number of dimensions from 2 to 14 and evaluate the resulting accuracy. Figure 2.4 shows that increasing dimensions reduces the error from more than 0.2 to about 0.1, with most of the significant im-provement occurring between 2 and 6 dimensions. Since the number of dimensions is a linear factor in the computational complexity of the Simplex method used in our embedding, we need to balance prediction accuracy against computational complexity. We find a sweet spot close to 10 dimensions, where the accuracy has essentially reached a plateau. Thus we also use 10-dimension for our hyperbolic system.
Graphs Rigel-S Rigel BFS
Egypt 0.33µs 6.8µs 750,000µs
L.A. 0.33µs 8.5µs 1,027,000µs
Norway 0.33µs 17.8µs 1,440,000µs
Table 2.3: Response time for Rigel-S, Rigel and BFS.
Summary. The accuracy of the hyperbolic graph coordinate system is
im-pacted by the choice of the space curvature c and the space dimension n. The
results measured from real graphs shows that as the curvature increases, the ARE of the system decreases. While with the dimension more than 10, there is no significant improvement on accuracy. Therefore, in the remaining of this chapter, we use a 10-dimensional hyperbolic space with curvature of -1 in Rigel.
Per-Query Latency. Table 2.3 shows the average per-query response time to compute the distance of two random nodes using Rigel, and BFS. We also list the query time of Rigel without the local path optimization labeled as “Rigel-S”. Since memory access in Rigel’s the local path optimization adds several microseconds to each query, the per-query time of Rigel is slightly longer than Rigel-S (see the second column). But overall, Rigel per-query time is still 5 orders of magnitude faster than BFS.
2.4.2
Parallelizing Embedding Process
Since the complexity of Rigel embedding scales linearly with graph size, this processing overhead presents a significant performance bottleneck for large graphs with millions of nodes, and prevents practical applications of Rigel on large social graphs. Here, we describe a mechanism to address this challenge by parallelizing
Parallel Rigel Rigel Input Output Parallel Bootstrap 50 machines 1 machine 2.7 hours >10 days Embedding Bootstrap 136.2 hours Parallel Embedding
Renren Graph Coordinates
43M nodes; 1B edges 43M nodes; 10 dimensions 50 machines 6.4 hours Graph Partitioning 0.07 hours
Figure 2.5: A high-level view of how embedding is parallelized and its net impact on embedding latency for Renren, our largest graph.
Rigel’s embedding process across multiple servers, named as “Parallel Rigel”. We then evaluate its impact using four large social graphs.
Parallel Rigel. We integrate the parallel mechanisms with the original Rigel design, calledParallel Rigel. Figure 2.5 demonstrates the Parallel Rigel system on top of and contrasts it to the original Rigel design. It consists of three components: parallel bootstrapping, graph partitioning and parallel embedding. The parallel bootstrapping module distributes BFS tree computation related to each landmark across servers, one or more landmarks per server. The graph partitioning module provides a balanced distribution of nodes across servers. The cost of this operation is negligible since simple partitioning schemes are sufficient. Finally, the parallel embedding module embeds all graph nodes in parallel across the servers, allowing Parallel Rigel to achieve significant speedup.
Computational Efficiency Evaluation. We have implemented a fully func-tional prototype of parallel Rigel, and used it to four of the largest social graphs available today, Flickr, Orkut, Livejournal and Renren in Table 2.1, to examine
Graphs Bootstrap Graph Partitioning Embedding (hours) Response
(hours) (hours) (hours)
Rigel P-Rigel P-Rigel Rigel P-Rigel BFS Rigel
Flickr 1.4 0.028 0.003 9.7 0.24 24,500,000µs 12.9µs
Orkut 7.5 0.15 0.005 19.4 0.42 56,200,000µs 36.6µs
Livejournal 4.8 0.096 0.008 32.2 0.66 65,200,000µs 8.4µs
Renren 136.2 2.7 0.07 250 6.4 1,598,000,000µs 28.9µs
Table 2.4: Comparing the time complexity of Rigel and Parallel Rigel (P-Rigel) using a cluster of 50 servers.
0 5 10 15 20 25 30 35 40 45 50 1 5 10 20 50 Speedup # of machines Flickr Orkut Livejournal Renren
Figure 2.6: Average speedup achieved by Parallel Rigel on different cluster configurations.
the efficiency of Parallel Rigel. All the experiment is tested on a cluster of 50 servers (Dell Xeon, 2GB).
We evaluate the efficiency of Parallel Rigel by comparing its computation time to that of original Rigel. By utilizing a cluster of servers, Parallel Rigel distributes the tasks of landmark bootstrapping and graph embedding over multiple parallel servers. While Parallel Rigel does require an extra step of graph partitioning by distributing nodes among machines, it only leads to a minor increase in time complexity, less than 0.1% of the original bootstrapping time. Table 2.4 shows the comparison when Parallel Rigel runs on a cluster of 50 servers. We see that Parallel Rigel achieves close to linear speedup, even slightly better due to reduced virtual memory paging on each server.
Metric Method Egypt L. A. Norway Flickr Orkut Livejournal Renren
Radius Ground Truth 9 11 8 13 6 13 12
Rigel 8.7 11.0 7.5 12.7 6.4 12.2 12.0
Orion 9.2 10.7 7.8 12.6 6.3 12.0 12.1
Diameter Ground Truth 14 18 12 19 8 17 15
Rigel 14.8 17.9 11.7 18.6 10.2 17.7 14.9 Orion 14.4 17.8 12.2 17.3 10.0 16.8 14.9 Average Path Length Ground Truth 5.0 5.2 4.2 5.1 4.1 5.4 5.0 Rigel 4.9 5.1 4.2 5.0 4.3 5.5 4.9 Orion 4.7 5.0 4.1 4.3 3.9 4.8 4.6
Table 2.5: Comparing separation metric results, as computed by Rigel, Orion, and BFS (ground truth).
To examine the impact of the cluster size, we compare the speedup of Parallel Rigel by using 5, 10, 20 and 50 servers, where speedup is the decrease in embedding time. Figure 2.6 shows that run time decreases almost linearly with cluster size.
2.4.3
Evaluating System Accuracy in Applications
In this section, we implement three path-length based applications, i.e. sep-aration metric computation, graph centrality computation and distance-ranked social search, and evaluate the performance of using the coordinates generated by Rigel. In each case, we compare the accuracy of using Rigel against that of Orion, the prototype system proposed in Section 2.3.
Computing Separation Metrics Social network graphs are known for dis-playing the “Small World” behavior. Graph separation metrics such as diameter, radius and average path length, have been widely used to examine and quantify the Small World behavior. But since each of these metrics relies on large num-bers of node distance computations, computing them for large graphs can become extremely costly or even intractable.
Using Rigel, we build an application to compute the graph separation metrics listed above, and examine their accuracy by comparing their results to ground truth. Since computing shortest path length between all node pairs takes several days even for our smallest graph (Facebook Egypt), we take a random sampling approach to compute the ground truth. We randomly sample 5000 nodes from the three Facebook graphs, 500 nodes from Flickr, Livejournal and Orkut, and 100 nodes from Renren, and use shortest path lengths between these pairs to derive the separation metrics.
We report the results in Table 2.5 for Radius, Diameter and Average Path Length on seven different graphs, for Rigel, Orion and Ground Truth. In general, Rigel consistently provides more accurate results compared to Orion. More im-portantly, Rigel provides results across all three metrics that are extremely close to ground