Insuring against Health Shocks: Health Insurance, Consumption
Smoothing and Household Choices
Kai Liu
Norwegian School of Economics∗ March 2014
Abstract
This paper presents new evidence on the role of public health insurance in mitigating the adverse outcomes associated with health shocks. I exploit a natural experiment from the rollout of universal health insurance in rural China. Using longitudinal data spanning the period in question, I find that health insurance helps households maintain investment in children’s human capital and agricultural activities during negative health shocks. Given that households were able to completely smooth consumption against health shocks before the reform, the evidence suggests that the benefit of health insurance could come from reducing the use of costly smoothing mechanisms.
JEL: D1, O1, I1
1
Introduction
Health risk is one of the most important and common risks facing members of a household. A negative
health shock could incur two types of costs. One is the direct effect on health and productivity, and
the other is the medical expenditure on treatment. The impacts of health shocks may be particularly
severe for low-income households, since the cost of treatment could be large relative to income and the
shock may have persistent negative impacts on health due to lack of or low-quality treatment.
Health insurance coverage had been low or even non-existing for low-income households, particularly
in developing countries where formal insurance and credit markets are less developed. Despite the lack
∗
I thank Arne Bigsten, Ilyane Kuziemko, Magne Mogstad, Marcos Vera and the participants at several seminars and conferences for helpful comments and discussions. All remaining errors are mine. Email: [email protected].
of formal health insurance coverage, the literature seems to suggest that households in developing
countries are able to, at least to a great extent, smooth their consumption in response to health shocks
(e.g. Townsend (1994), Kochar (1995), Morduch (1995), Gertler and Gruber (2002)). This result is
complemented by another set of papers emphasizing important roles of insurance provided by household
behaviors and institutions, such as savings and asset accumulation (Jalan and Ravallion, 1999), access
to microfinancial institutions (Gertler, Levine, and Moretti, 2009; Islam and Maitra, 2012), sales of
durables and livestock (Rosenzweig and Wolpin, 1993), and family networks (Angelucci, De Giorgi, and
Rasul, 2012).
This paper provides new empirical evidence on the value of health insurance for low-income
house-holds. In specific, it presents evidence on whether and how access to health insurance interacts with
household choices which were being used to smooth consumption in the absence of health insurance.
The answer to this question is important for policy. One policy implication from previous research is
that the welfare gain from additional social insurance (such as health insurance) may be small, as it
would only crowd-out other channels of consumption smoothing (Morduch, 1995). However, the
wel-fare gain of health insurance should depend on its relative cost to other smoothing mechanisms. To
infer the welfare value of health insurance, it is important to also examine the efficiency costs of the
behaviors used by households to smooth consumption. For example, if the household reduces
educa-tional investment of children in order to smooth consumption against health shocks, the value of health
insurance could be substantial. Theoretical frameworks developed in Chetty and Looney (2006) and
Chetty (2006) show that when households are very risk averse, they may choose highly costly measures
to smooth their consumption paths even though consumption may not fluctuate much with shocks to
begin with.
Obtaining convincing evidence to this question is challenging for a few reasons.1 The main challenge
is that identifying causal effect of any health insurance program requires exogenous variation in the
coverage of the program. Existing programs often target specific groups of the population and the
take-up rate is usually low and endogenous. For example, individuals with certain unobserved traits
(such as risk aversion) may self-select into insurance programs, and those unobserved characteristics
also affect their consumption choices and other behaviors. In addition, one also needs a large panel
1Chetty and Looney (2007) take a first step in this direction by comparing the effects of unemployment shocks on
data to observe consumption, health shocks, and other variables indicating private arrangements of
consumption smoothing over time.
This paper overcomes the first difficulty by exploiting a natural experiment from the introduction of
a large-scaled health insurance program in rural China. The new program, called the New Cooperative
Medical Scheme (NCMS), raises the health insurance coverage of rural households from 15% in 2000 to
over 90% in 2009. The new health insurance program was implemented over a six-year period from 2003
to 2008 in different counties in rural China at different times. As a result, some areas received coverage
earlier than others and residents of those areas (constrained by limitations on geographic mobility
because of the household registration system) received exogenous changes in health insurance status
at different points in time. My main estimation strategy exploits this variation in the timing of the
introduction of the program across counties, in a difference-in-difference setting. I compare households’
responses to health shocks before and after the health insurance reform, and between counties that have
already implemented the reform to those that have not yet implemented the reform. The identifying
assumption is that areas which implemented the reform late and areas which implemented the reform
early would have had the same time trend (but they are allowed to have different levels initially) in
the absence of the implementation. To overcome the data challenges, I use a large and long panel data
from the China Health and Nutrition Survey (CHNS), which spans the period in question. The CHNS
contains detailed information on health, income, food consumption, investment, and various social and
demographic variables at individual level.
The key findings are the following. First, using data on food consumption, I find that households
were fully insured against major health shocks, both prior to and after the reform. Based on this
evidence alone, one might be tempted to conclude that the welfare value of additional health insurance
is small. However, the second set of findings reveals that the benefit of health insurance could come from
reducing the use of certain costly smoothing mechanisms. I examine several choices the household may
use, without access to health insurance, to smooth consumption and find that child labor, investment
in children’s education and agricultural investment are the most prominent margins that the household
adjusts during a negative health shock. Prior to the reform, a negative health shock decreases investment
in agriculture activities and children’s human capital, the latter of which is achieved by reducing school
day of sickness to the head and the spouse (which is severe enough to make them unable to carry
out normal daily activities) reduces the share school enrollment by 3% and increase the share of child
labor within the household by 10%, relative to their overall mean levels. Given the large literature
documenting high return to human capital investment over the life cycle, these choices are costly to
the household in the long run. Access to health insurance eliminates the use of these costly smoothing
mechanisms: following a health shock, the household with access to health insurance invests more in
children’s human capital and agriculture, relative to the level it would have chosen in the absence of the
reform. These results are robust to several specification checks which could pose threats to identification.
Finally, I explore potential mechanisms driving these results. The availability of health insurance does
not reduce out-of-pocket medical expenditure incurred by the health shock. The main channel through
which health insurance mitigates the adverse outcomes appears to be an improvement in health after
the shock. There is some evidence that access to health insurance diminishes individual productivity
losses in the event of illness. Interestingly, income at household level is not affected by the health shock,
either before or after the reform. This is consistent with the finding that, without provision of health
insurance, the household used more child labor and invested less in agriculture to cope with the negative
health shock.
This paper connects to the large literature estimating the effects of health insurance. Most analyses
focus on the direct effects on medical expenditures and health outcomes. Yet the effects on non-health
outcomes could reveal interesting parameters that are useful for evaluating the welfare implication
of health insurance.2 The key empirical challenge facing researchers is to obtain credible variations in
health insurance coverage which are not correlated to unobservable characteristics. Random assignment
of health insurance is difficult to come by.3
The natural experiment from the Chinese expansion in health insurance is attractive in several
ways. First, it is a large-scaled program at a national level. Second, household mobility is restricted
because of the household registration system, reducing the extent of endogenous selection of health
insurance from mobility. Third, the coverage of health insurance in rural areas before the reform,
2See Currie and Madrian (1999) for a review. For example, Gruber and Yelowitz (1999) finds that expansion in Medicaid
leads to a reduction in savings and an increase in consumption. Similar findings have been found using data from developing countries (Chou, Liu, and Hammitt, 2003; Wagstaff and Pradhan, 2005).
3
Recently, an influential paper by Finkelstein, Taubman, Wright, Bernstein, Gruber, Newhouse, Allen, Baicker, et al. (2012) uses the Oregon Medicaid lottery as a convincing random variation in health insurance coverage for a group of uninsured low-income adults. The authors find that health insurance coverage leads to higher health care utilization, reduction in out-of-pocket medical expenditures and better self-reported health outcomes.
including private and public insurance, had consistently been very low and participation rate in the
new public health insurance program is very high. Since the share of compliers is high, the estimated
effects are close to the average treatment effects of health insurance coverage for the entire population.
Fourth, the level of implementation of the new health insurance program is at county level. Together
with limited household mobility, this rules out spillover effects which may confound the direct effects of
health insurance (Angelucci and De Giorgi, 2009).4
This paper is also related to a small but important literature on whether and how public programs
interact with different private channels of insurance. Studies have found that public health insurance
crowds out purchase of private insurance (Cutler and Gruber, 1996) and increases receipt of certain
public transfer programs (Baicker, Finkelstein, Song, and Taubman, 2013). Cox, Eser, and Jimenez
(1998), Attanasio and Rıos-Rull (2000) and Jensen (2004) find that an increase in the benefits from
public transfer programs crowds out private transfers which were used to support extended family
members. Results from the current paper add to these findings by showing that health insurance may
crowd-in some other private arrangements to cope with health shocks which could lead to very different
welfare implications of the insurance program. Chetty and Looney (2007) is the only paper I know
which tests the same hypothesis by comparing the effects of unemployment shocks on consumption and
investment behaviors in Indonesia and the US.
The paper proceeds as follows. Section 2 discusses institutional background of the health insurance
reform and introduces the data and main variables used in estimation. Section 3 presents the empirical
model. The impact of health insurance on consumption smoothing is presented in Section 4. Section
5 provides empirical evidence on how health insurance interacts with pre-existing household choices
used to smooth health shocks. Section 6 presents robustness checks providing additional support to
the empirical model. Section 7 investigates potential mechanisms underlying the key results. Section 8
concludes. A theoretical framework is outlined in the appendix.
4
A couple of studies have used the Chinese health insurance expansion to study its effects on health outcomes. Using data from early years of the reform, Lei and Lin (2009) and Wagstaff, Lindelow, Jun, Ling, and Juncheng (2009) evaluate the NCMS program on a range of health-related outcomes. They find that the program significantly increases the utilization of formal outpatient and inpatient care and preventive care. They do not find any evidence that health insurance improves averagehealth status nor do they any evidence that the program reducesaverageout-of-pocket expenditures (unconditional on the severity of illness). See Section 7 for details.
2
The Data and Institutional Background
2.1 The Health Reform and the NCMSBefore the transition from a planned economy to a market economy, households in rural China had
access to universal health insurance through the Cooperative Medical Scheme (CMS). When China
reformed its rural economy in 1979 and introduced the Household Responsibility System, the CMS
collapsed (due to lack of public funding) and left around 90 percent of all farmers uninsured (Yip and
Hsiao, 2008). In the next two decades, households in rural China had little formal insurance against
health shocks. During the 1990s, despite several attempts to rebuild the CMS, the coverage rate had
been less than 20%.
Aiming to provide a basic social safety net against the cost of illness for all rural households, in
2003, the central government launched the NCMS with the goal of offering health insurance to all rural
areas by 2010. The new program replaced the old CMS program and the introduction of the new
program was rolled out gradually at county level. The timing of the establishment was determined by
the provincial government following guidelines from the central government. In 2003, every provincial
government was required to select at least 2-3 counties as pilot counties for the NCMS (State Council,
2003). In 2006, the central government required provincial governments to expand the program to cover
at least 40% of all the counties by the end of 2006 and 60% of all the counties by 2007 (Department of
Health, 2006). By 2008, the program had been implemented in all rural areas, covering the entire rural
population. Therefore, for half a decade, rural households in China had different access to public health
insurance. Whether one was covered by the program depended on the county in which the household
was registered. Because of the strict household registration system (hukou), mobility of households
between counties is restricted.
Participation in the program is voluntary, but if the household decides to join the program, all
members of the household must be enrolled in the program. Annual premium has been kept low
thanks to heavy subsidies from the government. For example, in 2008, typical annual premium was
20 RMB (3 USD) per person, supplemented by a subsidy of 80 RMB (12 USD) from central and local
government (Department of Health, 2008).5 The amount of subsidies has been increasing over time, and
5In 2006, about 20% of the costs of the program were covered by the central government, 50% of the costs were financed
the central government provides larger subsidies for underdeveloped regions in central and western parts
of China. In the first few years of the reform, the program emphasized coverage of inpatient expenses
and outpatient expenses related to severe illness.6 In recent years, there have been efforts to increase the
coverage of outpatient expenses and lower the deductables for inpatient services (Department of Health,
2008). The benefits of the program vary by county. Two thirds of the counties cover both inpatient
service and outpatient service, with the cost of inpatient service reimbursed through a formula and the
cost of outpatient service reimbursed through a household medical savings account.
2.2 The CHNS Data and Definition of Health Shock
I use data from the China Health and Nutrition Survey. The survey is based on a multistage, random
cluster process that yields a sample of about 4,400 households with a total of 19,000 individuals that
are tracked over time. The sample covers nine provinces that vary substantially in terms of geography,
economic development, and other socioeconomic indicators. This survey was conducted in 1989, 1991,
1993, 1997, 2000, 2004, 2006, 2009 and 2011. I use data from 1993-2011, consisting of seven waves
which cover the entire period of the health insurance reform. The estimation is done in first-difference,
so data from 1993 serves as initial condition. I use data at both individual and household levels from
the CHNS and focus on the rural sub-sample. The rural households are defined by the head living in a
rural county. Individual level data contains information on health, education, health insurance, income,
food consumption and demographics such as age and relationship to the household head. Household
data includes information on agricultural expenditures, durable goods purchase, and various sources of
other income. I drop households with intermittent waves to make sure the observed changes in variables
always refer to changes between adjacent waves.
Since the enrollment into the health insurance program must be at household level, all the variables
analyzed in this paper are defined at household level. To focus on stable households, I keep only
households with no change in the household head. For each wave, I keep households with the head
aged between 25 and 65. The measure of consumption available from the CHNS is food consumption,
which accounts for roughly half of the budget share in total household expenditure in rural China
during the period of the sample.7 Food consumption is collected by a dietary questionnaire recording
6
See Wagstaff, Lindelow, Jun, Ling, and Juncheng (2009) for detailed evidence on the coverage from a sample of pilot counties in 2005.
7
items and amounts of food consumption for each member of the household over the past three days
(including food consumed both at and away from home). The CHNS calculates macronutrients based
on the individual food consumption data. The macronutrients include average daily intake of calories
(in kilocalorie), protein (in grams), fat (in grams) and carbohydrate (in grams). Monetary value of
the food consumption is, however, not readily available from the data. One advantage of working with
nutrition intake (as opposed to the monetary value) is that one does not need to compute the value of
home-produced food, since prices of home-produced food are usually difficult to predict. In addition,
while the budget share of food consumption decreases with income, nutrition intakes such as protein
are luxury goods which could be a better proxy of nondurable consumption over time (Angelucci and
Attanasio, 2013). One drawback is that nutrition intake would be affected by unobserved food prices
which could differ by location and time. In the empirical analysis, I account for location- and
time-specific differences in prices by including a separate intercept for each county and for each year. I
trim the top and bottom 0.5% of daily caloric intake (and the other nutrients associated with outliers in
calories), corresponding to daily caloric intakes that are above 5325 kilocalorie and below 544 kilocalorie.
Household consumption is calculated by summing up individual food consumption and dividing it by
an adult-equivalence scale.8
The variables related to health status rely on two questions from the survey. The first one asks
whether the individual, during the past four weeks, had been sick, injured, or suffering from a chronic
or acute disease and, if the answer is yes, the second one records the number of days the person had
been unable to carry out daily activities in the same period.9 These questions are available in all waves
of the survey for every adult respondent aged above 18 and they are supposed to capture duration
of severe illness, both chronic and acute, that poses severe damage in the ability of performing daily
activities. The baseline measure of sickness is the number of days of sickness during which the person
is unable to perform daily activities, ranging from 0 to 30 days (for an individual without sickness in
food in total expenditure is 59% in 1994 and falls to about 46% in 2003.
8
The adult equivalence scale, taken from Angelucci, De Giorgi, and Rasul (2012), is one for household members aged 18 or older, and 0.73 otherwise.
9
The survey questions are: “During the past 4 weeks, have you been sick or injured? Have you suffered from a chronic or acute disease?” and “For how many days during the past 4 weeks were you unable to carry out normal activities due to this illness?”. An alternative, which is not pursued in this paper, is to define health shocks from questions measuring health status based on the individual’s self-reported ability to perform daily activities, similar to that used in Strauss, Gertler, Rahman, and Fox (1993); Gertler and Gruber (2002). The CHNS, however, only collects data on physical limitations for persons aged over 55 and terminates the collection of these data after the 2006 wave. This means that the health shocks defined by physical limitations are only available for the elder population and health shocks are not defined for half of the counties that implemented the reform after 2006.
the past month, the number of days of sickness is coded zero). Health status at household level is the
sum of days of sickness for the head and/or the spouse of the household. Health shock is defined as the
change in health status between waves. In this baseline definition, its value ranges from -60 to 60. As
a robustness check, I also consider a dummy variable indicating major sickness which is equal to one if
the duration of sickness of at the household level is more than three days. In the alternative definition,
a health shock takes on three values: zero if there is no change between waves, -1 if the household
moves from sick to healthy and 1 if the household moves to sick from healthy. Sickness takes place in
a household as long as either the head or the spouse becomes sick. A healthy household is one where
both the head and the spouse are healthy.
2.3 Descriptive Statistics
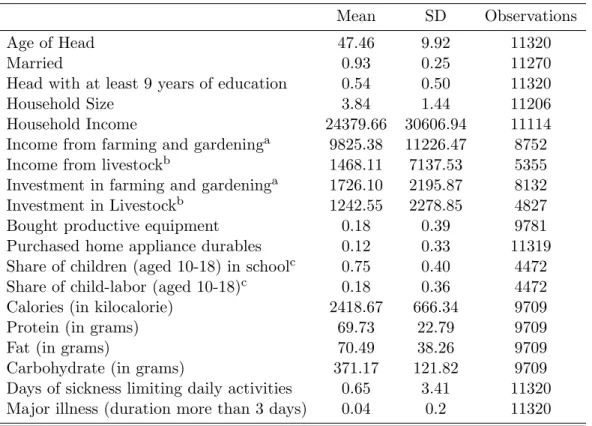
Table 1 presents means and standard deviations of the main variables in the selected sample. All
monetary values are deflated by the CPI provided in the CHNS.10Table 2 summarizes the expansion of
the health insurance program in the sample. Following Lei and Lin (2009), I use the community survey
data from the CHNS to determine the year of implementation of the NCMS at county level. Among
the 36 counties observed in the data11, three had started the program by 2004. The program expanded
quickly, with over 50% of counties having implemented the program by 2006. By 2009, all the counties
in the data were covered by the NCMS.
Turning to coverage at household level, we see from Table 3 the same pattern of increase for
house-holds with access to the NCMS. The proportion of househouse-holds who are insured by either the old CMS
or the NCMS grew quickly since the implementation of the reform, rising from 7.5% in 2000 to close
to 85% in 2009. Since the NCMS had replaced the old CMS in all counties in 2009, we could infer
that the take-up rate is 85% in 2009. The final two columns of Table 3 summarize the percentages of
households covered by any kind of health insurance, private and public combined. Health insurance
coverage never exceeded 20% before the reform, and was rising steadily up to 95% in 2009 due to the
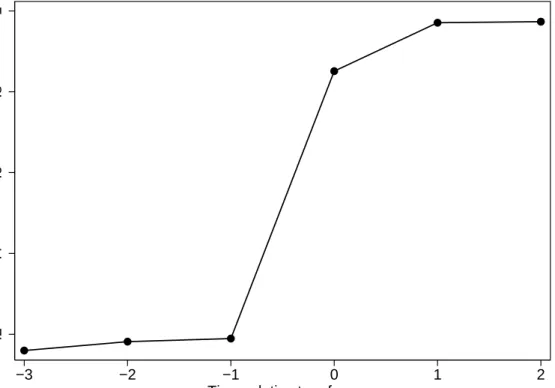
introduction of the NCMS. This pattern is confirmed graphically in Figure 1, which plots the average
10The price index in the first wave of the survey is calculated based on the cost of a standard consumer basket supplied
by the State Statistics Bureau of China (by province and urban-rural areas). Changes in the price index in future waves track changes in the national CPI. The price index will not affect the parameters of interest, because it is completely absorbed by year and county fixed effects.
11
insurance coverage on time (in terms of survey waves) relative to the health insurance reform. For each
county, I recenter the data such that time zero is equal to the first wave observed since the reform. The
picture shows a dramatic and persistent increase of health insurance coverage due to the reform.
The estimation strategy (to discuss in the next section) controls for any time-invariant characteristics
at county level. Nevertheless, it would be helpful if the timing of the implementation of the reform across
counties were uncorrelated with observable county-level characteristics before the reform. The selection
of pilot counties was decided by the provincial government. It could be that counties with low average
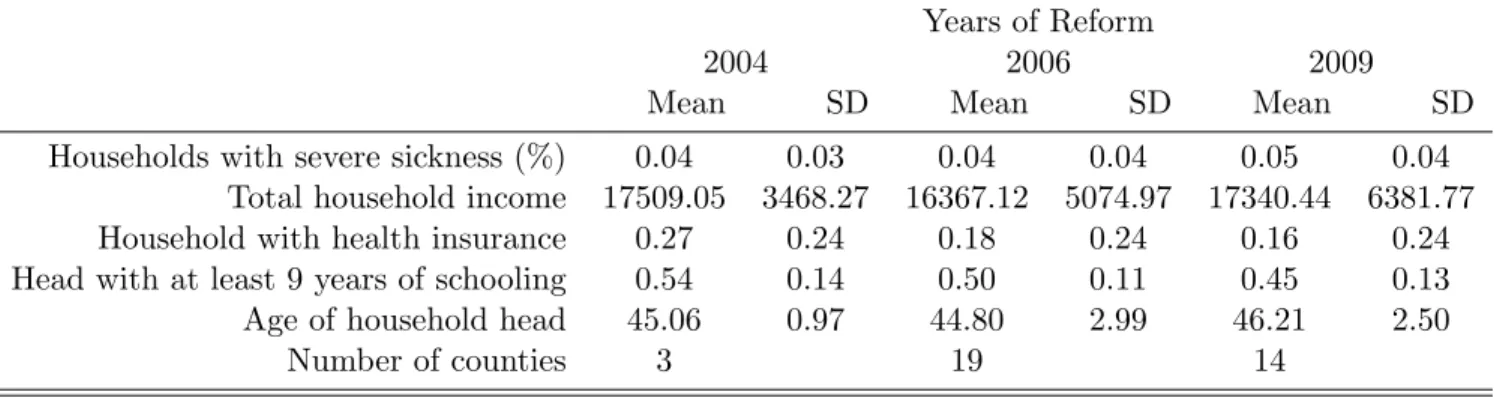
income had stronger incentives to push the provincial government for the reform. Table 4 compares
the means and standard deviations of several county-level characteristics in 1997 and 2000, by counties
grouped by years of reform (weighted by the number of observations in the county) . The table suggests
that there is little relationship between most observable factors and the timing of the implementation
of the reform. One exception is the existing coverage of health insurance. It appears that counties
which were selected as pilots in 2004 also had higher existing coverage of health insurance. However,
if one regresses the year of reform on the set of county-level average variables shown in Table 4, none
of the estimated coefficients are significantly different from zero at 10% level (results not shown here).
Therefore, I conclude that counties that implemented the reform early do not appear to have significantly
different characteristics than counties that started the reform late.
3
Empirical Strategy
The basic empirical analysis is motivated from a simple model of consumption choice under two states
of the world. The model is based on Chetty and Looney (2006) and is outlined in the Appendix.
The intuition is simple: when a less costly smoothing mechanism becomes available (the NCMS in our
context), in the event of negative shocks to household resources, the household would substitute public
health insurance for more costly mechanisms. There are two predictions from the model that are directly
testable in our context. One is that consumption should fluctuate less in response to health shocks when
the NCMS is available. The extent of the fluctuation would still depend on risk aversion: if households
are very risk averse, consumption changes with the NCMS may not be significantly different from the
consumption changes without the NCMS. The other testable implication is that, if households resort to
of expensive insurance channels when public health insurance becomes available. The empirical analysis
below attempts to test for any substitutability between existing smoothing mechanisms and the NCMS.
To estimate the effects of health shocks, one can regress first-differenced outcomes against the change
in health, as in Gertler and Gruber (2002):
4yijt=λ4hijt+βXijt+γj+γt+εijt (1)
where 4yijt is change in the outcome of interest (such as out-of-pocket medical expenditure, labor income, or consumption) for individual i in county j and year t, 4hijt is the change in health, Xijt
is a series of demographic controls, γj and γt are county and year fixed effects, respectively. In the
baseline, 4hijt is change in the number of days of sickness in the past month. In Section 6, alternative
definition of health shock is constructed which relaxes the assumption that the effect of days of sickness
is linear. The first-difference setup already eliminates unobserved household heterogeneity (such as
preferences and health endowment) which may determine the outcome and correlate with sickness at
the same time. When 4yijt is the change in log per capita consumption, equation (1) becomes the standard test for consumption smoothing in the literature (e.g. Cochrane (1991),Townsend (1994)).
Under the null hypothesis of complete insurance, the coefficient on health shock, λ, should be zero.
If households are fully insured against idiosyncratic shocks (either through mutual insurance or
self-insurance), consumption growth should not be correlated with changes in health once growth in
county-level resources is controlled for.
To estimate how household behavior following the health shock changes with and without access to
the health insurance program, I allow λto shift with the reform:
λijt=α0+α1Rjt+γj +γt+νijt (2)
where Rjt is a dummy variable which equal one if the health insurance reform has been implemented
in county j and wave t.12 The wave fixed effects allow for secular changes in λover time that may be
completely unrelated to the reform. The county fixed effects allow for the fact that variation in the
timing of the reform across counties may not have been exogenous. Reform is a random assignment
12
Recall that the data is not collected in every year. The sample I am using contains six waves collected in 1997, 2000, 2004, 2006, 2009 and 2011 (after taking first-difference).
only conditional on permanent county-level characteristics γj and aggregate time trend γt. Consistent
estimation ofα1 is obtained so long as (a) these characteristics are fixed over time during the sampling
periods or (b) implementation of the reform is not correlated with changes in these characteristics.
Substituting equation (2) into equation (1) and adding a reform dummy, I obtain the following main
empirical model:
4yijt=α04hijt+α1(4hijtRjt) +4hijtγt+4hijtγj+α2Rjt+γj+γt+βXijt+εijt (3)
where Xijt consists of changes in household size, changes in share of children in the household, and a
set of characteristics of the household head including age, age-squared, education and marital status.
4hijtγt are wave fixed effects interacted with health shocks which allow for flexible time trend in the
effects of health changes (e.g. from country-wide changes in health care). 4hijtγj are county dummies
interacted with health shocks which control for persistent differences among counties in the severity
of health shocks or the quality of health care. To capture any common shock to consumption across
households within the county and over time, standard errors are clustered at the county level, which is
the level where the reform is implemented.
α1 identifies the effect of health insurance coverage in mitigating the adverse outcomes associated
with health shocks. In the context of consumption insurance, it is the causal effect of health insurance
on consumption smoothing against health shocks. α2 shows the direct effect of being covered by health
insurance (on households that did not experience health changes between waves). α0 shows the direct
effect of a health shock in the absence of health insurance.13 The predicted effect of a health shock after
the health insurance reform is given by the sum of α0 and α1.
Threats to identification. There are a couple of potential threats to identifying the causal effects
of the health insurance program. First, while the correlation between reform and permanent county
characteristics is controlled for through county fixed effects, there could be other changes that influence
the timing of the reform and affect the dependent variable of interest at the same time. One way to test
whether such a confounding factor exists is to check whether, conditional on year and county effects,
there is any remaining correlation between the timing of the future reforms and the outcome variables
13
In all the Tables, this coefficient is reported as the overall mean effect of a health shock in the absence of the health insurance, as opposed to the effect in the base county and in the base year.
before the reform. If future reforms predict outcome variables prior to the reform, then it is likely that
there exist unobservable county-specific trends that are correlated with the timing of the reform. An
empirical test is conducted in Section 6, where I find no evidence supporting this hypothesis, for almost
all major outcomes of interest. Second, changes in health status are assumed to be exogenous shocks,
conditioning on the observable characteristics, unobserved county and year effects.14 One possibility is
that the marginal utility of consumption may depend on health status directly, or indirectly through
induced changes in leisure when consumption and leisure are not additively separable. In this case, the
growth of consumption will vary with the state of health even with full insurance. Health shock will
then be correlated with omitted preferences in the error term. To test for such state dependence, in
Section 6, I estimate the model using changes in total consumption by household members who did not
experience a health shock. The main conclusions remain to hold.
4
Health Insurance and Consumption Smoothing
To evaluate the consumption smoothing effect of health insurance, I estimate the main empirical model
as specified in equation (3). The dependent variables are growth in household food consumption in terms
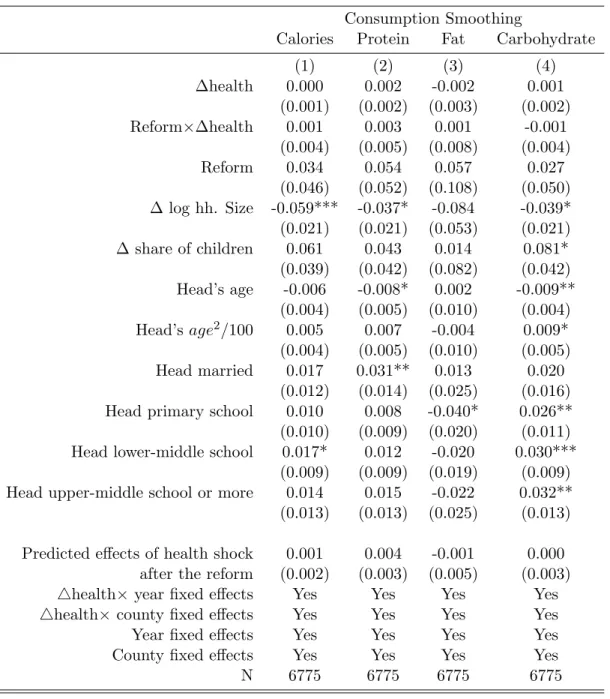
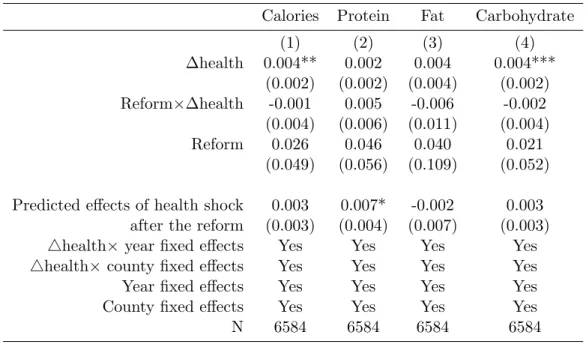
of four nutritional intakes: calories, protein, fat and carbohydrate. Table 5 reports the estimates. The
first row shows the average effects of a health shock (measured in one additional day of activity-limiting
sickness) on the growth of nutrition intakes before the reform. Prior to the reform, negative increments
to health are not associated with reductions in intakes of macronutrients. The point estimates are
very close to zero. As mentioned previously, these estimates would be biased if the marginal utility
of consumption depends on health and the effects of duration of sickness are nonlinear. In Section 6,
I consider alternative consumption and health measures which do not suffer from these biases. The
coefficients have the expected negative sign but remain insignificant. Therefore, I cannot reject the
hypothesis of full insurance against severe health shocks before the reform. The household appears to
be able to smooth food consumption fairly well following the severe health shock.
The second coefficient is the estimated consumption smoothing effects of health insurance (parameter
α1 on reform ×∆health). The point estimates are mostly positive and insignificant. Adding up the
14
Note that the first-differencing already eliminates any unobserved household characteristics (such as health endow-ments) that may confound identifying the effect of illness.
coefficients in the first and the second row gives the predicted net effects of the health shock after the
reform, shown at the bottom of Table 5. After the reform, I still cannot the hypothesis that households
are fully insured against health shocks. The coefficient on the reform dummy shows the direct effects
of health insurance on consumption growth (the third row of coefficients). For all types of nutrition
intakes, they are positive but not significantly different from zero, indicating that consumption behavior
of households without experiencing health changes is also not affected by the reform. Remaining rows
in Table 5 show the estimated coefficients on the main control variables. Growth in per capita log
consumption fall with increase in log household size, indicating some economics of scale in consumption.
Consumption grows at a faster rate for heads who have at least graduated from primary school.
Overall, households appear to be able to smooth food consumption fairly well even before the health
insurance reform. Based on these evidence, it is tempting to conclude that access to additional health
insurance may not provide welfare gains to households. However, there may be additional welfare
gains from the program if the household is very risk averse and relying on costly measures to smooth
consumption. Results from the next section suggest that this might well be the case.
5
Health Insurance and Household Choices
The theoretical model predicts that, when public health insurance becomes available, the household
should smooth consumption by switching from costly smoothing mechanisms to public health insurance.
To test this hypothesis, I employ the same empirical model as described in equation (3) to estimate
the effects of illness on household choices with and without health insurance. As dependent variables, I
consider the following choices which the household may rely on to cope with health shocks and which are
also readily available in the data: investment in children’s human capital, use of child labor, agricultural
investment and investment in durable goods. The findings below suggest that, in the absence of public
health insurance, the household reduces children’s schooling, agricultural investment and increases the
use of child labor following activity-limiting health shocks. Gaining access to health insurance eliminates
the use of these choices that otherwise would have been used to maintain household consumption.
Education. As human capital investment, I consider the rate of school enrollment, defined as the
share of children who are enrolled in school among those aged between 10 and 18 within the household.15
The normal age finishing 9 years of schooling is 16. Tuition is free for 9 years of schooling (primary and
lower-middle school education). Schooling would incur costs to purchase books, tools, transportation,
tuition for any schooling of more than 9 years, and opportunity costs in terms of forgone earnings.
Brown and Park (2002) document that in poor counties in rural China, a family with one child in
primary school and another in lower middle school spends as much as fifty percent of expenditures per
capita on fees related to education. In addition, as outside options such as employment opportunities in
other cities become increasingly attractive as they become late teens, the opportunity cost of additional
education could be high.16
The first column of Table 6 shows the estimates. The first coefficient means that, in the absence
of health insurance, health shock leads to a 2.2% reduction in the rate of school enrollment within a
household. A health shock with 10 days of work-limiting sickness to the head and/or the spouse would
reduce school enrollment of the children by nearly 30% relative to its mean (0.22/0.75). It appears that,
given the large education expenditures and opportunity cost of schooling for children of this age group,
one way to maintain household consumption is to reduce educational expenditures (and potentially
increase household income by child labor) by taking children out of school. Access to health insurance
completely mutes the effects of health shock on investment in children’s education: following a negative
health shock, households with health insurance are 2.4% more likely to keep their children in school,
relative to households experiencing a health shock without health insurance (second row of coefficients).
These estimates are precisely estimated at 1% level. The net effect of a health shock with health
insurance on school enrollment is very close to zero (fourth row of coefficients).
In results not reported in the table, I also estimate the model on school enrollment for boys and
girls separately.17 Interestingly, negative health shock leads to larger drop in school enrollment for
girls than for boys before the reform. Providing health insurance has a greater impact on mitigating
the negative impacts on girls’ school enrollment than boys’. These results are consistent with previous
evidence suggesting that girls’ schooling in rural China is more sensitive to economic conditions of the
currently enrolled in school. Prior to 2004, this variable was collected from a single household survey. Starting from the 2004 wave, this variable is collected from a separate child questionnaire where the respondents must be children under age 18 living in the household at the time of the survey. To track children who are members of the household but do not live with the household at the time of the survey (temporary migrant workers and students at boarding schools, in particular), I use another question from the household survey which, for each member away from the household, records the reasons for not currently residing in the household. A child is defined as enrolled in school if the answer to this question is “gone to school”. A child is defined as not in school if the answer is either “seeking employment in cities” or “in the military”.
16
See Meng (2012) for a recent survey of rural-urban migration in China.
17
household than boys’ (Connelly and Zheng, 2003; Hannum, 2005; Song, Appleton, and Knight, 2006).
Access to health insurance reduces the gender difference in schooling resulting from a negative health
shock within a household.
Finally, note that the direct effects of the reform are not significantly different from zero. One
hypothesis is that the availability of health insurance could reduce incentives in schooling. If investment
in children’s human capital were made as an ex-ante response against future health shocks to the
household (so the child may have higher earnings to compensate future earnings losses when the head
becomes sick), the availability of public health insurance may reduce the overall incentives to invest.
This does not appear to be the case empirically. Coefficient on reform are estimated close to zero and
insignificant, suggesting that health insurance does not change the investment behaviors of households
that did not experience a health shock.
Child Labor. Relating to the findings on children’s education, one important question is what
children do when they drop out from school due to a health shock to the household. Given the large
urban wage premium in China, one possibility is to seek employment in cities. I define the rate of
child labor as the share of children who are employed among those aged between 10 and 18 within the
household.18 The first coefficient in column (2) of Table 6 shows that, in the absence of health insurance,
health shock leads to a 1.9% increase in the rate of child labor (10% relative to its mean). The majority
of children who were taken out of school as a result of the negative household health shock appears to
be put into work. Health insurance provision eliminates the use of child labor as a way to cope with
health shock. The estimated coefficient on Reform×∆health is -0.024 (second row of coefficients), which
implies that, after the reform, the net effect of health shock is close to zero (fourth row of coefficients).
Similar to the gender differences in children’s education, providing health insurance also has a greater
impact on reducing the positive effects on using girls as child labor.
Agricultural Investment. As agricultural investment, I consider investment in farming and
gar-dening and in livestock. Investment in farming and gargar-dening refers to the total amount spent, in the
past year, on leasing land, purchasing seedlings, fertilizer, tools, insecticides and hiring labor.
Invest-ment in livestock includes the total amount spent on purchasing, feeding and caring for up to four types
18The main variable is whether an individual is employed at the time of the survey. Similar to the definition of school
enrollment, I use the question on the reasons of not residing in the household to trace children who seek employment in the cities.
of livestock and poultry. One problem with the measurement of investment in agricultural activities
is that it is based upon actual investment taken place in the past year. The health shocks are based
on health conditions in the last four weeks. Ideally one would also like to observe health shocks from
the past year, but this is not possible without additional data. The assumption underlying regressions
presented in this (and the next) section is that health shock in the past four weeks is proportional to
health shock in the past year.
Columns (3)-(4) present the estimates on farming and livestock investment. Before the reform, the
estimates show that a health shock would lower the investment in farming by 25 RMB and in livestock
by 29 RMB (the first row). The average investments of a household are 1726 RMB in farming and
1242 RMB in livestock. For a health shock that reduces capacity for daily activities for 10 days, the
household would reduce investment in farming and livestock by 15% and 23%, respectively. Consistent
with Rosenzweig and Wolpin (1993), these estimates suggest that the household could use sale of
livestock as a channel to insure against health shock. After the reform, neither livestock nor farming
investment is affected by health shocks (fourth row of coefficients). The estimated parametersα1(on the
interaction term between health shock and reform) are positive and border-line significant. Therefore,
it appears that access to health insurance helps rural households to maintain agricultural investment
following a health shock.
Durable Goods. As investment in durable goods, I create a binary variable indicating whether the
household had purchased durable good in the past 12 months. Two types of durable good are considered.
The first type is household appliance essentials. It includes television, refrigerator and washing machine,
which are the most common and useful appliances in Chinese households. The second type of durable
is productive equipment used in agriculture activities, which includes tractor, garden tractor, irrigation
equipment, power thresher and household water pump. Each type of durable good investment is a
binary variable, equal to one if the household had purchased any of the equipment in the last year (for
home appliances) or since the last survey (for equipment). Similar to the limitations with investment
variables, the underlying assumption here is that health shock in the past four weeks is proportional to
the health shock in the past year.19
19Each wave surveys the quantity of each type of equipment owned by the household. Investment is based on whether
there has been an increase in the aggregate quantity between the current wave and the previous wave. This could be a lower bound of actual purchases, if households are simply upgrading their technologies by replacing old equipments with new ones. This might be less of a problem here, since the share of ownership for any of these equipments was low in the 1997 survey and has been gradually increasing over time.
Columns (5)-(6) present the estimates. Without access to health insurance, the household is less
likely to purchase home appliance following a health shock. The probability of a new purchase reduces
by 0.8%, or 7% reduction relative to the overall mean (0.008/0.12). The estimated coefficient on the
term of reform interacted with health shock is positive and significant. The predicted effect of a health
shock after the reform is close to zero (0.004), indicating that,with health insurance, the household no
longer delays purchase of home appliance in response to a health shock. On productive equipment, it
does not appear that the household decreases investments in productive equipment, either before or
after the reform.
6
Robustness Checks
6.1 Pre-treatment Trend
One potential concern is that the timing of the reform could be correlated with changes in unobserved
characteristics (e.g. induced by other reforms). One way to test whether such a confounding factor
exists is to check whether, conditional on year and county effects, there is any remaining correlation
between the timing of the future reforms and the outcome variables before the reform. If future reforms
predict outcome variables prior to the reform, then it is likely that there exist unobservable
county-specific trends that are correlated with the timing of the reform. As a robustness test I estimate the
following equation:
4yijt=α04hijt+α1(4hijtRjt) +α014hijt1(t−Tj =−1) +α2Rjt+α021(t−Tj =−1)
+4hijtγt+4hijtγj+γj+γt+βXijt+εijt (4)
The indicator function is equal to one when the observation is one wave prior to Tj, the year when the
health insurance is provided in county j. α01 andα1 together describe the evolution of effects of health
shock just before and after the reform, relative to the effects two waves or more before the reform. The
coefficient α01 is an important test for differential evolution of outcomes before the reform that may
confound the true estimated effects of the program.
Table 7 shows the estimated α01 and α1, on the household choices analyzed in the previous table.
the omitted baseline, which is two or more waves before the reform). For household choices where there
are significant crowding-in effects, the effects after the reform (α1) rise sharply after the reform.
6.2 State-dependent Preferences
The growth of consumption can be shifted by changes in the state of health even with full insurance,
when the marginal utility of consumption depends on health status directly, or indirectly through
in-duced changes in leisure when consumption and leisure are not additively separable. One advantage of
the CHNS data, compared with other household panel data of consumption, is that it collects food
con-sumption data at individual level (including food consumed both at and away from home). I construct
an alternative measure of adult-equivalent consumption by excluding the consumption of the household
head and/or the spouse who ever experienced a health shock in the panel. This measure circumvents
the problem that changes in health may impact the marginal utility of consumption for the sick member
directly. Note that average caloric intakes from the head and the spouse account for about 65% of the
average level of household caloric intake. For a sick household, by excluding head and spouse who ever
become sick, I may only use the variation coming from the remaining 35% of household consumption.
If there are within-household allocation of food consumption in response to the health shock (such as
maintaining consumption level of children if parents are altruistic), then changes in consumption may
be even more muted for the rest of the household. Table 8 presents the set of consumption-smoothing
regressions, using changes in the log of this alternative consumption measure as the dependent variable.
The main conclusion remains to hold: the null hypothesis of complete insurance cannot be rejected for
any type of nutrition intakes, either before or after the reform.
6.3 Alternative Definition of Health Shock
The measure of health shock employed so far is based on continuous changes in the duration of sickness,
assuming that the effect of health shock is linear in the number of days of sickness. In this section, I
consider the alternative health shock variable measured by discrete changes in health status. I define
a dummy variable on major sickness which is equal to one if the head and the spouse had been unable
to carry out daily activities for a total of more than three days and zero elsewhere.20. A health change
20
is zero if there is no change between waves, -1 if the household moves from sick to healthy and 1 if
the household moves to sick from healthy. Table 9 present the estimates. Since health shock could
only takes on three discrete values, standard errors are much larger than those of baseline specification.
Overall, the following conclusions from the baseline model remain to hold: i) following a large negative
health shock, the household is able to perfectly smooth consumption regardless of provision of health
insurance; ii) provision of health insurance helps the household to maintain investment in children’s
human capital (by reducing the impacts of a major health shock on school enrollment and child labor)
and agricultural activities (especially for livestock investment).
7
Potential Mechanisms
While there are interesting patterns of substitution between public health insurance and private
ar-rangements of insurance, competing mechanisms could lead to similar findings. A negative health shock
could incur two types of costs on households. One is the medical expenditure needed to treat the illness,
which can be substantial relative to their income. Another is the negative shock to productivity, which,
depending on the quality of the treatment, could be persistent. The direct effect of health insurance is
to reduce out-of-pocket medical cost to treat severe sickness. In the context of the theoretical model,
this is represented by a direct reduction in the cost of consumption smoothing. Health insurance could
also reduce the productivity loss from a health shock, perhaps indirectly by improving the quality of
treatment after the health shock or by reducing the severity of the health shock if the household uses
more preventive care. Hence, the extent of the bad state in the model can also be changed by the
reform.
To evaluate the importance of each mechanism, I apply the main empirical model to conduct two
empirical tests. First, I test whether out-of-pocket medical expenditure for treating the severe health
shock is reduced after the reform. The out-of-pocket cost is the portion of the cost paid by the household
for being treated for the same illness that was used to define health shocks. It includes expenditures on
treatment at up to two clinics or hospitals, plus the cost of informal treatment if the individual seeks
informal care. In column (1) of Table 10, I report estimates from the model in equation (3) with the
dependent variable replaced by changes in out-of-pocket medical expenditure. The results indicate that,
out-of-pocket spending on treating the illness. For a major illness limiting daily activity for 10 days, the
amount of out-of-pocket medical expenditure is about 3% of average annual household income. After
the health insurance expansion, the out-of-pocket expense is not reduced: the interaction term between
reform and health shock is positive and insignificant, leading to roughly the same level of out-of-pocket
spending as the amount before the reform. These estimates suggest that the health insurance does
not reduce out-of-pocket expenditures. This result is consistent with findings from Wagstaff, Lindelow,
Jun, Ling, and Juncheng (2009) and Lei and Lin (2009), which conclude that the NCMS does not
have significant impacts on the out-of-pocket expenditures. One plausible hypothesis is that households
may afford higher-quality health care when they gained access to health insurance, leaving the total
out-of-pocket expenditure at the same level. Indeed, Lei and Lin (2009) and Wagstaff, Lindelow, Jun,
Ling, and Juncheng (2009) provide suggestive evidence that the the NCMS significantly increases the
utilization of preventive care and reduces the use of traditional folk doctors. Below I present some
additional evidence supporting this claim.
As a second test, I look for evidence of whether health insurance help families to reduce productivity
losses from the health shock. In column (2) of Table 10, I use a self-reported measure of health and
estimate the baseline model in equation (3) using changes in self-reported health status as dependent
variable. This measure is taken from a question asking the respondent to provide a rank, from 1 to 4,
describing his/her health compared to that of other people of the same age (1 being excellent and 4 being
poor). Column (2) shows that, as expected, one additional day of sickness deteriorates the self-reported
health status by a 0.02 point before the reform. After the reform, illness remains to have quantitatively
similar effects on the self-reported health status. Columns (3) presents estimates on the effects of illness
on head and spouse’s income. The dependent variable is change in log total income of the head and
spouse. It shows that, without health insurance, illness facing the head and the spouse has significant
negative impact on their total income. One additional day of sickness reduces total earnings of the
head and spouse by nearly 1.8%. With health insurance coverage, the negative impact on the income
is muted. The difference (identified by the term Reform ×∆health) is marginally significant (p-value
0.11). Therefore, it appears that health insurance dampens the productivity losses from health shock
experienced by the head and the spouse, which is supportive of the hypothesis that health insurance
model using changes in log of total household income as dependent variable. Household income is a total
of individual income of all household members and additional subsidies and other income. Interestingly,
health shock on the head and spouse of the household does not have any significant impact on total
household income. The effects are close to zero both before and after the reform. The differences
between estimates in column (3) and estimates in column (4) suggest that income from other household
members compensate the productivity loss incurred by the health shock on the head and spouse. The
previous findings appear to indicate that children’s labor supply and agricultural investments (which
are subtracted from agricultural income) are important margins of adjustment the household makes in
order to prevent income losses to the household.
Taken the evidence together, there is some evidence (from head and spouse income) that health
insurance reduces productivity loss after health shock (perhaps by providing affordable and higher
quality health care). On the other hand, household income is not affected by health shocks, indicating
the importance of children and agricultural investments as means to cope with health shocks. There
is no evidence that the reform changes out-of-pocket expenditure on treatment. Therefore, access to
health insurance seems to lessen the financial burden of illness on households by offering higher-quality
treatment that would otherwise not have been affordable. This in turn leads to better health and smaller
productivity loss following a health shock which can be used to maintain investment in children’s human
capital and agriculture.
8
Conclusion
This paper presents new evidence on the role of public health insurance in mitigating the adverse
outcomes associated with health shocks. I exploit a natural experiment from the rollout of universal
health insurance in rural China, which was expanded gradually across the country on a
county-by-county basis. As a result, some areas received coverage earlier than others and residents of those areas
(constrained by limitations on geographic mobility) received exogenous changes in health insurance
status at different points in time. I focus on two set of parameters which are indicative of the value
of the program. One is whether the new health insurance program helps households to have smoother
consumption path against shocks. I find that households are completely insured against major health
insurance interacts with existing private insurance arrangements. I find that the health insurance
program crowds out certain household choices that were being used to smooth consumption in the
absence of health insurance (such as reduction in investment in children’s education and increasing use
of child labor). The second set of estimates implies that the health insurance program may bring large
welfare gains to households, even though households were fully insured against health shocks without
the insurance. The empirical estimates can be interpreted as causal as they are free from endogenous
self-selection into insurance programs.
Results from this paper suggest that analyzing consumption fluctuations alone may provide an
incomplete picture of the true value of additional social insurance. To understand the net welfare gain
of public insurance programs, an important policy question is at what cost public insurance replaces
private arrangements of smoothing against shocks. The existing literature has argued that additional
public insurance programs may have little net effects on the welfare of the intended beneficiaries if they
are already completely insured against shocks, because the provision of these programs may crowd out
private arrangement of self-insurance. The evidence from the health reform in rural China suggests
that, at least for low-income households who are liquidity constrained and for idiosyncratic shocks that
are large relative to household resources, additional public insurance programs could lead to net gains
by reducing the use of costly self-insurance mechanisms.
A
Appendix: An Analytical Framework
I follow Chetty and Looney (2006) to sketch a simple model highlighting the welfare gains from publicly
provided insurance. Suppose there are two states in the world, one with good health and one with bad
health. Suppose that, in the good state, the utility cost of obtaining consumption level cis θgc. In the
bad state, the utility cost of reaching consumption level crequires a larger costθbc. I normalizeθg = 1,
so θb measures the additional utility cost of reaching consumption level c in the bad state, relative to
the cost in the good state. If θb is high, households that are hit by shocks will need to sacrifice more
in order to reach the same consumption level as before. To facilitate the discussion later, suppose the
household can choose from a menu of insurance channels denoted by {θ1
b, θb2, . . .}. θbk summarizes the
cost of consumption smoothing from different channels. A utility-maximizing household would choose
response to a bad health shock can be written as 4ci ci = 1−(1 θb )1/γ (5)
whereγ is the coefficient of risk aversion. From equation (5), it is obvious that changes in consumption
depend on two parameters: the cost of consumption smoothing and the coefficient of risk aversion.
Consumption may not fluctuate much in response to health shocks because of either a low cost of
smoothing (such as easy access to the credit markets) or a high cost of smoothing but with households
that are very risk averse (γ is large). To evaluate the welfare consequences of insurance policies, one
must determine why and how households smooth consumption – because of high risk aversion (largeγ)
or through good insurance arrangements (low θb). Looking at consumption changes alone would not be
sufficient to distinguish between these two explanations.
The health insurance reform considered in this paper can help to distinguish between the two
expla-nations of consumption smoothness. The availability of health insurance to cover lumpy expenditures of
health care can be thought of as an additional channel to insure against health shocks. Suppose the cost
of smoothing consumption using health insurance is θbh. Ifθhb is higher than θb, the existing channel of
insurance, consumption fluctuations in response to health shocks would not change after the availability
of health insurance. If public health insurance is a cheaper way to insure against health shocks (θbh
smaller than θb), then we should observe a smoother consumption stream in response to health shocks
after the reform than before the reform. The change in smoothness still depends on the risk aversion
parameter. If households are very risk averse, a health insurance program may still have a small impact
on consumption smoothness. A better measure of the welfare gain of the program is to look directly
at the substitution patterns between health insurance and other pre-existing insurance channels. If
households resort to costly consumption-smoothing mechanisms before the reform, one would observe
References
Angelucci, M., and O. Attanasio(2013): “The Demand for Food of Poor Urban Mexican
House-holds: Understanding Policy Impacts Using Structural Models,”American Economic Journal:
Eco-nomic Policy, 5(1), 146–205.
Angelucci, M., and G. De Giorgi (2009): “Indirect Effects of an Aid Program: How Do Cash
Transfers Affect Ineligibles’ Consumption?,”The American Economic Review, pp. 486–508.
Angelucci, M., G. De Giorgi, and I. Rasul (2012): “Resource Pooling Within Family Networks:
Insurance and Investment,” UCL Working paper.
Attanasio, O., and J.-V. Rıos-Rull (2000): “Consumption smoothing in island economies: Can
public insurance reduce welfare?,”European Economic Review, 44(7), 1225–1258.
Baicker, K., A. Finkelstein, J. Song,andS. Taubman(2013): “The Impact of Medicaid on Labor
Force Activity and Program Participation: Evidence from the Oregon Health Insurance Experiment,”
Working Paper 19547, National Bureau of Economic Research.
Brown, P. H.,andA. Park(2002): “Education and poverty in rural China,”Economics of Education
Review, 21(6), 523–541.
Chetty, R. (2006): “A general formula for the optimal level of social insurance,” Journal of Public
Economics, 90(10), 1879–1901.
Chetty, R.,andA. Looney(2006): “Consumption smoothing and the welfare consequences of social
insurance in developing economies,” Journal of Public Economics, 90(12), 2351–2356.
(2007): “Income risk and the benefits of social insurance: Evidence from Indonesia and the
United States,” inFiscal Policy and Management in East Asia, NBER-EASE, Volume 16, pp. 99–121.
University of Chicago Press.
Chou, S.-Y., J.-T. Liu, and J. K. Hammitt (2003): “National health insurance and precautionary
saving: evidence from Taiwan,”Journal of Public Economics, 87(9), 1873–1894.
Cochrane, J. H. (1991): “A Simple Test of Consumption Insurance,” The Journal of Political
Connelly, R., andZ. Zheng(2003): “Determinants of school enrollment and completion of 10 to 18
year olds in China,”Economics of education review, 22(4), 379–388.
Cox, D., Z. Eser, and E. Jimenez (1998): “Motives for private transfers over the life cycle: An
analytical framework and evidence for Peru,”Journal of Development Economics, 55(1), 57–80.
Currie, J., andB. C. Madrian (1999): “Health, health insurance and the labor market,”Handbook
of labor economics, 3, 3309–3416.
Cutler, D. M., and J. Gruber(1996): “Does public insurance crowd out private insurance?,” The
Quarterly Journal of Economics, 111(2), 391–430.
Department of Health, C. (2006): “On Expanding the New Cooperative Medical Scheme (in
Chinese),”Bulletin of the Department of Health of China, 2006(13).
(2008): “On Strengthening the New Cooperative Medical Scheme in 2008 (in Chinese),”
Bulletin of the Department of Health of China, 2008(17).
Finkelstein, A., S. Taubman, B. Wright, M. Bernstein, J. Gruber, J. P. Newhouse,
H. Allen, K. Baicker, et al. (2012): “The Oregon Health Insurance Experiment: Evidence
from the First Year*,”The Quarterly Journal of Economics, 127(3), 1057–1106.
Gertler, P., and J. Gruber (2002): “Insuring Consumption Against Illness,” American economic
review, 92(1), 51–70.
Gertler, P., D. I. Levine, andE. Moretti(2009): “Do microfinance programs help families insure
consumption against illness?,”Health economics, 18(3), 257–273.
Gruber, J., and A. Yelowitz (1999): “Public health insurance and private savings,” Journal of
Political Economy, 107(6), 1249.
Hannum, E.(2005): “Market transition, educational disparities, and family strategies in rural China:
New evidence on gender stratification and development,”Demography, 42(2), 275–299.
Islam, A., and P. Maitra(2012): “Health shocks and consumption smoothing in rural households:
Jalan, J., and M. Ravallion (1999): “Are the poor less well insured? Evidence on vulnerability to
income risk in rural China,”Journal of development economics, 58(1), 61–81.
Jensen, R. T. (2004): “Do private transfers displace the benefits of public transfers? Evidence from
South Africa,”Journal of Public Economics, 88(1), 89–112.
Kochar, A. (1995): “Explaining household vulnerability to idiosyncratic income shocks,” The
Amer-ican Economic Review, 85(2), 159–164.
Lei, X., andW. Lin(2009): “The new cooperative medical scheme in rural China: Does more coverage
mean more service and better health?,”Health Economics, 18(S2), S25–S46.
Meng, X. (2012): “Labor Market Outcomes and Reforms in China,” The Journal of Economic
Per-spectives, 26(4), 75–101.
Morduch, J. (1995): “Income Smoothing and Consumption Smoothing,” The Journal of Economic
Perspectives, 9(3), 103–114.
Rosenzweig, M. R., and K. Wolpin(1993): “Credit Market Constraints, Consumption Smoothing,
and the Accumulation of Durable Production Assets in Low-Income Countries: Investment in Bullocks
in India,”Journal of Political Economy, 101(2), 223–44.
Song, L., S. Appleton, and J. Knight (2006): “Why do girls in rural China have lower school
enrollment?,”World Development, 34(9), 1639–1653.
State Council, C. (2003): “Guidlines Establishing the New Cooperative Medical Scheme (in
Chi-nese),”Bulletin of the State Council of China.
Strauss, J., P. Gertler, O. Rahman, andK. Fox(1993): “Gender and Life-Cycle Differentials in
the Patterns and Determinants of Adult Health,”Journal of Human Resources, 28(4), 791–837.
Townsend, R. M.(1994): “Risk and Insurance in Village India,” Econometrica, 62(3), 539–591.
Wagstaff, A., M. Lindelow, G. Jun, X. Ling, and Q. Juncheng (2009): “Extending health
insurance to the rural population: An impact evaluation of China’s new cooperative medical scheme,”
Wagstaff, A., and M. Pradhan (2005): “Health Insurance Impacts on Health and Nonmedical
Consumption in a Developing Country,”World Bank Policy Research Working Paper, (3563).
Yip, W., and W. C. Hsiao (2008): “The Chinese health system at a crossroads,” Health Affairs,
27(2), 460–468.
Yu, X., and D. Abler(2009): “The demand for food quality in rural China,” American Journal of