Scholar Commons
Graduate Theses and Dissertations Graduate School
November 2013
Timely Doctoral Completion Rates in Five Fields:
A Two-Part Study
Angela Miller
University of South Florida, [email protected]
Follow this and additional works at:http://scholarcommons.usf.edu/etd
Part of theEducational Administration and Supervision Commons, and theHigher Education and Teaching Commons
This Dissertation is brought to you for free and open access by the Graduate School at Scholar Commons. It has been accepted for inclusion in Graduate Theses and Dissertations by an authorized administrator of Scholar Commons. For more information, please contact
Scholar Commons Citation
Miller, Angela, "Timely Doctoral Completion Rates in Five Fields: A Two-Part Study" (2013).Graduate Theses and Dissertations. http://scholarcommons.usf.edu/etd/4827
Timely Doctoral Completion Rates in Five Fields: A Two-Part Study
by
Angela Melissa Miller
A dissertation submitted in partial fulfillment of the requirements for the degree of
Doctor of Education
Department of Adult, Career, and Higher Education College of Education
University of South Florida
Major Professor: Donald Dellow, Ed.D. James Eison, Ph.D.
Deirdre Cobb-Roberts, Ph.D. John Ferron, Ph.D.
Date of Approval: September 9, 2013
Keywords: Graduate, Attrition, Program, Student, Faculty, Graduation
In loving memory of my father, Harry Schulz.
First of all, to my Mom – thank you for your loving encouragement over all these years, and for babysitting Isabelle and Gabriel while I finished up my coursework. I could not have done this without you. To my husband, Caleb – I love you with my whole heart. After all these years, you are still the greatest guy I know. Thank you for loving me, supporting me, and helping me stay the course. I would also like to acknowledge Susannah Olsen and Adrianna Brown for all the hours that they lovingly babysat my children while I worked on this dissertation. It gave me such peace of mind to often hear my children laughing in the next room. To my major
advisor, Dr. Donald Dellow, and to the rest of my committee – Dr. John Ferron, Dr. James Eison, and Dr. Deidre Cobb-Roberts –– I cannot thank you enough for your time and effort. It was a privilege to work with all of you on my dissertation, and I am so grateful for each and every one of your suggestions. I would also like to acknowledge Dr. Jim Voytuk for his assistance in retrieving the student data included in this study. Finally, I want to thank my Lord and Savior, Jesus Christ, for all the blessings in my life and specifically for supplying everything I needed to cross this finish line.
TABLE OF CONTENTS
List of Tables ...v
List of Figures ... vii
Abstract ... viii
Chapter One: Introduction ...1
Background of the Problem ...1
Purpose of the Study ...2
Rationale of the Study ...2
Research Questions ...3
Theoretical Framework ...5
Methodology ...5
Limitations ...6
Delimitations ...7
Significance of the Study ...8
Definition of Terms...9
Organization of the Study ...10
Tables and Figures ...12
Chapter Two: Review of the Literature ...14
Introduction ...14
Brief History of the Doctoral Program ...14
Overview of Doctoral Completion and Attrition ...15
Program Factors Related to Completion ...16
Orientations and Social Activities ...17
Academic and Student Support ...18
Student Factors Related to Completion ...18
Student Characteristics ...19
Student Finances ...21
Faculty Factors Related to Completion ...22
Faculty Research ...23
Faculty Diversity ...23
The Original NRC Study ...25
Recent National Initiatives ...31
Recommendations for Improving Completion Rates ...32
Summary of the Literature Review ...35
Tables and Figures ...36
Chapter Three: Methods ...38
Research Design ...38
Population and Sample ...39
Variables ...40
Instrumentation ...40
Data Collection Procedures ...41
Data Validation and Cleaning ...42
Data Analysis ...42
Summary ...43
Tables and Figures ...44
Chapter Four: Results ...47
Introduction ...47
Descriptive Statistics ...48
Multicollinearity Tests ...49
Research Question One: Multiple Regression Results ...49
Research Question 1a ...51 Research Question 1b ...52 Research Question 1c ...52 Research Question 1d ...53 Research Question 1e ...53 Research Question 1f ...54
Research Question Two: Independent T-Test / Chi-Square Results ...56
Research Question 2a ...57 Research Question 2b ...57 Research Question 2c ...57 Research Question 2d ...58 Research Question 2e ...58 Research Question 2f ...58 Summary ...59
Chapter Five: Findings, Implications and Recommendations ...76
Introduction ...76
Summary of the Study ...76
Review of the Methodology ...77
Principle Findings ...77
Research Question One ...77
Question 1a ...79 Question 1b ...79 Question 1c ...79 Question 1d ...80 Question 1e ...80 Question 1f ...80
Research Question Two ...81
Conclusions ...82
Multiple Regression Conclusions ...83
Independent T-test and Chi-Square Conclusions ...86
Implications for Program Administrators and Students ...86
Neuroscience ...87
Implications for Program Administrators in Neuroscience ...87
Implications for Students in Neuroscience ...87
Chemical Engineering ...88
Implications for Program Administrators in Chemical Engineering ...88
Implications for Students in Chemical Engineering ...89
Physics ...90
Implications for Program Administrators in Physics ...90
Implications for Students in Physics ...90
Economics ...91
Implications for Program Administrators in Economics ...91
Implications for Students in Economics ...93
English ...94
Implications for Program Administrators in English ...94
Implications for Students in English ...95
All Programs ...95
Implications for Program Administrators in General ...95
Implications for Students in General ...97
Implications for Policy Analysts ...98
Limitations of the Study ...100
Recommendations for Future Research ...101
Concluding Remarks ...102
Tables and Figures ...104
Appendices ...118
Appendix A: Program Questionnaire (NRC) ...118
Appendix B: Faculty Questionnaire (NRC) ...149
Appendix C: Admitted-to-Candidacy Student Questionnaire (NRC) ...167
Appendix D: Descriptive Statistics for Programs in the Neuroscience Field ...183
Appendix E: Descriptive Statistics for Programs in the Chemical Engineering Field...185
Appendix F: Descriptive Statistics for Programs in the Physics Field ...187
Appendix G: Descriptive Statistics for Programs in the Economics Field ...189
Appendix H: Descriptive Statistics for Programs in the English Field ...191
Appendix I: Descriptive Statistics for All Programs in the Dataset ...193
Appendix J: Scatterplot of the Standardized Residuals versus the Standardized Predicted Values in Neuroscience ...195
Appendix K: Scatterplot of the Standardized Residuals versus the Standardized Predicted Values in Chemical Engineering ...196
Appendix L: Scatterplot of the Standardized Residuals versus the Standardized Predicted Values in Physics ...197
Appendix M: Scatterplot of the Standardized Residuals versus the Standardized Predicted Values in Economics ...198
Appendix N: Scatterplot of the Standardized Residuals versus the Standardized Predicted Values in English ...199
Appendix O: Scatterplot of the Standardized Residuals versus the Standardized Predicted Values in All Programs ...200 About the Author ... End Page
LIST OF TABLES
Table 1: List of Independent Variables ...12
Table 2: Total Response Counts and Rates from the Program, Faculty, and Student Questionnaires for the Original NRC Study ...36
Table 3: NCR Assessment Issues and Related Impact on Current Study ...36
Table 4: Response Rates of Student Questionnaires by Field (NRC) ...37
Table 5: Variable Descriptions and Coding ...44
Table 6: Sample Sizes and Cut-Offs for the Low and High Completion-Rate Groups by Field...60
Table 7: Descriptive Statistics by Field ...60
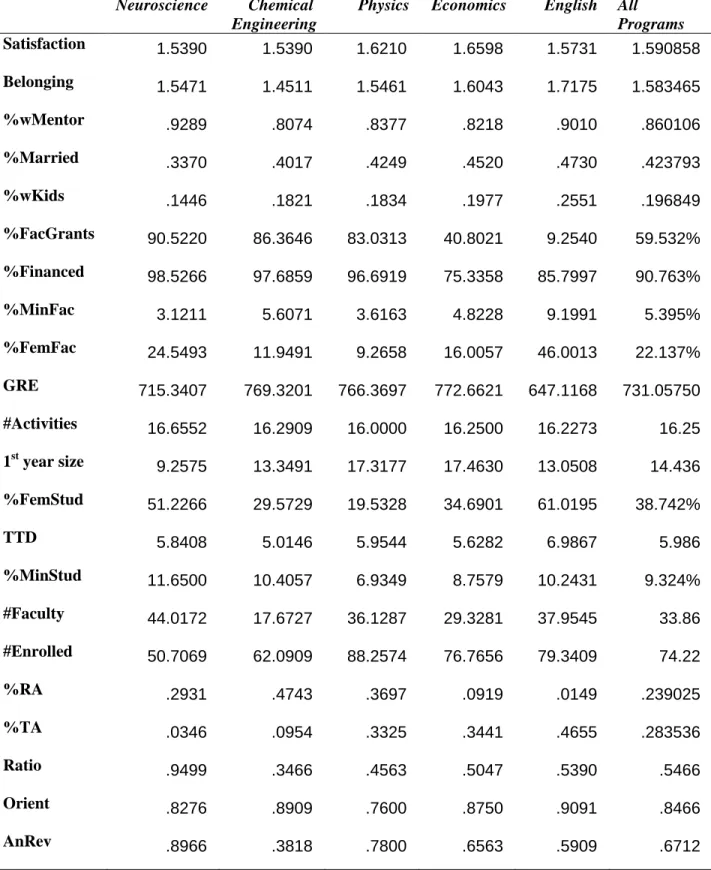
Table 8: Variable Means for Each Field ...61
Table 9: Multiple Regression Results for Neuroscience ...62
Table 10: Multiple Regression Results for Chemical Engineering ...63
Table 11: Multiple Regression Results for Physics ...64
Table 12: Multiple Regression Results for Economics ...65
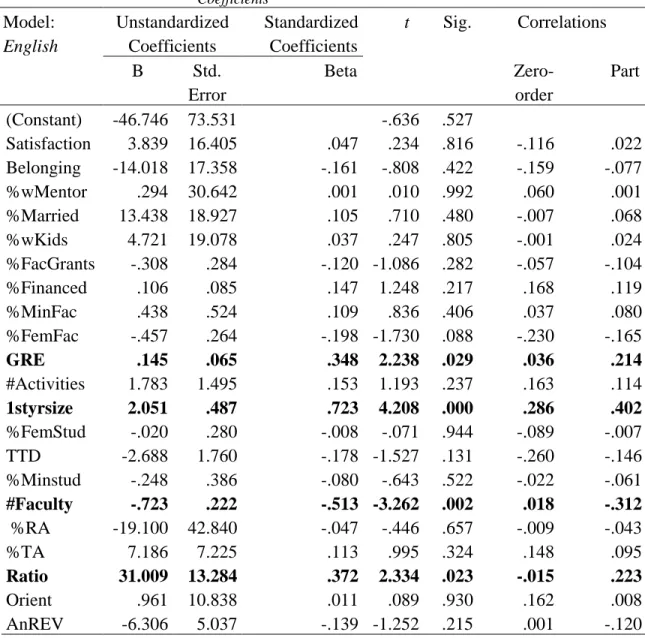
Table 13: Multiple Regression Results for English ...66
Table 14: Multiple Regression Results for All Programs in the Dataset ...67
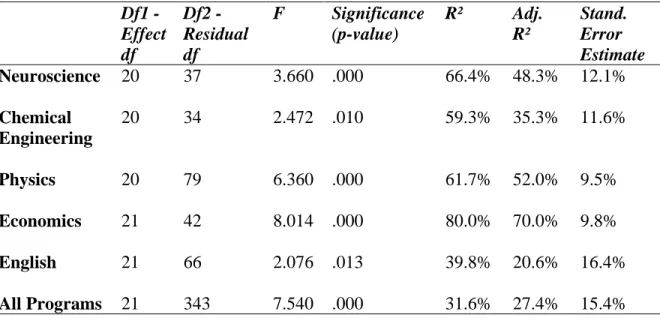
Table 15: Summary of the Multiple Regression Analysis for Each Field ...68
Table 16: Independent T-test and Chi-Square Test Results for Neuroscience ...69
Table 17: Independent T-test and Chi-Square Test Results for Chemical Engineering ...70
Table 18: Independent T-test and Chi-Square Test Results for Physics ...71
Table 20: Independent T-test and Chi-Square Test Results for English ...73 Table 21: Independent T-test and Chi-Square Test Results for All Programs ...74 Table 22: Significant Variables and Standardized Beta Weights from the
Regression Analysis in Neuroscience ...104 Table 23: Significant Variables and Standardized Beta Weights from the
Regression Analysis in Chemical Engineering ...104 Table 24: Significant Variables and Standardized Beta Weights from the
Regression Analysis in Physics ...105 Table 25: Significant Variables and Standardized Beta Weights from the
Regression Analysis in Economics ...105 Table 26: Significant Variables and Standardized Beta Weights from the
Regression Analysis in English ...106 Table 27: Significant Variables and Standardized Beta Weights from the
All Programs Regression Analysis ...106 Table 28: Variables with Significant Differences by Field plus Indications
of Whether the High-Completion Group Means were Higher or
LIST OF FIGURES
Figure 1: Tinto’s Longitudinal Model of Doctoral Persistence ...13
Figure 2: Timely Completion Rates by Field ...75
Figure 3: Significant Predictors of Completion (left circle) and Significant Differences between the High and Low-Completing Groups (right
circle) inNeuroscience ... 108 Figure 4: Significant Predictors of Completion (left circle) and Significant
Differences between the High and Low-Completing Groups (right
circle) inChemical Engineering ...108 Figure 5: Significant Predictors of Completion (left circle) and Significant
Differences between the High and Low-Completing Groups (right
circle) inPhysics ...109 Figure 6: Significant Predictors of Completion (left circle) and Significant
Differences between the High and Low-Completing Groups (right
circle) inEconomics ...109 Figure 7: Significant Predictors of Completion (left circle) and Significant
Differences between the High and Low-Completing Groups (right
circle) inEnglish ...110 Figure 8: Significant Predictors of Completion (left circle) and Significant
Differences between the High and Low-Completing Groups (right
ABSTRACT
Roughly half of all doctoral students who begin a program do not continue through graduation, and many of them face significant financial losses and emotional burdens as a result. Although this completion rate has stayed fairly constant for the past few decades, it has recently gained attention on a national level. In 2011, the National Research Council published the
Assessment of Research Doctorate Programs in the United States, and provided a wealth of data
on over 5,000 programs in 212 universities. This study used that dataset to examine the relationship between timely doctoral completion rates and 22 Program, Faculty and Student variables in the following five fields: Neuroscience, Chemical Engineering, Physics, Economics and English. The study also observed differences between programs with high completion rates and those with low completion rates in each field. The purpose of the study was to (1) determine which variables are significant in predicting doctoral completion rates, (2) discover if measurable differences exist between high and low completing programs, and (3) reveal the usefulness of collecting objective data in doctoral programs in order to assist doctoral programs as they create strategies to lower attrition rates.
The sample in the study included over 10,000 students and over 12,000 faculty members from 365 programs in the five fields. The 22 variables in the study were: Availability of a Graduate Orientation, Existence of an Annual Student Review, Number of Academic Support Activities, Average First Year Enrollment Size, Total Number of Enrolled Students, Percentage of First Year Students with Full Financial Support, Percentage of Students that are Teaching
Assistants, Percentage that are Research Assistants, Median Time to Degree, Average GRE Score, Percentage of Students that are Married, Percentage of Students with Dependents, Percentage of Students with Mentors, Average Satisfaction Rating, Average Sense of Belonging Rating, Percentage of Students that are Females, Percentage that are Minorities, Percentage of Faculty that are Females, Percentage that are Minorities, Percentage of Faculty with Grants, Total Number of Faculty, and Faculty to Student Ratio. All of the regression lines were significant at the p≤.05 level. Furthermore, for the Economics programs in the sample, 80% of the variance in timely completion rates was explained by this specific set of variables, and the same set of variables explained between 40-66% of the variance in timely completion rates for the other four fields in the study.
When looking at all the programs in the dataset, the following variables were significantly related to timely completion rates: number of academic support activities, percentage of students with full financial support, 1st year size, annual student review, student satisfaction rating, number of faculty, percentage of students with teaching assistantships, percentage of faculty with grants, and time to degree. Between the high- and low-completion groups, the following variables were significantly different in the All Programs group: Student satisfaction rating, percentage of students with children, percentage of students with full financial support, number of academic support activities, time to degree, and percentage of students with teaching assistantships. Separate findings and implications are presented for each of the five fields (Neuroscience, Chemical Engineering, Physics, Economics and English). Program leaders and other interested parties can now use these results to focus their attention on significant variables as they create strategies for improving completion rates within their respective fields.
CHAPTER ONE INTRODUCTION
Background of the Problem
Increasingly, higher education is focusing its efforts upon the necessity to retain and graduate doctoral students. Roughly fifty percent of students who begin doctoral programs do not persist to graduation, a rate that may be exceeded by students in underrepresented groups
(Lovitts, 2001). This loss of an institution’s doctoral contingency represents untold economic losses and immeasurable voids in research (Gilliam, 2006). Barbara Lovitts (2001) describes this high attrition rate (the percentage of an entering class that does not persist through graduation) in doctoral programs as higher education’s “invisible problem.” Doctoral students often withdraw quietly, hence the problem remains invisible.
According to Cusworth (2001), the graduate experience in general is a great, unaddressed academic issue within higher education. Nettles and Millett (2006) similarly voiced concern about the limited attention that scholars have given to researching issues in graduate education. Although some studies have similarly looked at relationships between specific variables and doctoral completion, the majority of them only looked at student or faculty variables within one institution, or at program variables within a limited number of institutions. This study, on the other hand, will look at program, student and faculty variables and their relationship to
examine differences between programs with high completion rates and those with low completion rates.1
Purpose of the Study
This researcher is using data from the National Research Council’s Data-Based
Assessment of Research-Doctorate Programs in the United States to examine the relationship
between timely doctoral completion rates and 22 variables, and to compare high and
low-completing doctoral programs in the following five fields: Neuroscience, Chemical Engineering, Physics, Economics and English. The purpose of this study is to (1) discover which variables are significant in predicting doctoral completion rates, (2) reveal how much of the variance in timely completion rates can be explained by measurable data; and (3) determine if there are measurable differences between high- and low-completing programs in order to assist doctoral programs as they create strategies to improve completion rates.
Rationale of the Study
It is currently up for debate whether current generations of scholars and teachers will be able to reproduce themselves. High-paying tech jobs are luring potential students away and applications to graduate school in several disciplines have begun to decline (Lovitts & Nelson, 2000). Under these circumstances, Lovitts and Nelson strongly urge that it is time to give serious attention to one of the fundamental weaknesses of doctoral education – attrition (2000).
According to them, graduate programs have been surprisingly wasteful of their human capital. The amount of time needed to fulfill all requirements for a doctoral degree is also a matter of growing concern. Recent studies have shown that the longer a student spends in graduate school, the greater the likelihood of that student not persisting to graduation (Bowen & Rudenstine,
1
This researcher is using the average completion rate in each field ± 10 percentage points to determine the cut-offs for high- and low-completing groups in each field. Exact cut-offs are listed in Table 6 (Chapter 4).
1992; Ferrer de Valero, 1996, Nerad & Cerny, 1991). Gillingham et. al (1991) points out that the contributions that could have been made in the years spent working toward degree completion are costly both to students and to society as a whole – especially for those who do not complete their degree. There is also a burdensome financial cost for institutions when their students leave a program prior to completion. The University of Notre Dame, as a prime example, found that it would save $1-million a year in stipends alone if attrition was reduced by ten percent
(Smallwood, 2004). Non-completers also pay a heavy emotional toll (Willis & Carmichael, 2011); some spend years explaining why they did not finish the degree (Sternberg, 1981), and others can struggle with serious bouts of depression (Hinchey & Kimmel, 2000; Lovitts, 2001).
Forty years of studies suggest the long-term attrition rate nationwide is roughly 50%, and that rate may have increased in recent years. Departments under pressure to downsize and economize are more and more likely to be held accountable for the costs of recruiting and training students who do not complete their degrees. An attrition rate of 50% is even less acceptable in smaller graduate programs and institutions (Lovitts & Nelson, 2000). Thus, additional research that compares high and low-completing programs, and investigates which variables contribute the most to timely completion, is both beneficial and necessary.
Research Questions
Tinto (1993) said that retention “must focus on the institution as well as on the student, and on the actions of the faculty and staff who are the representatives of the institution…” This researcher is examining which variables from these three groups – Programs, Students, and Faculty – contribute the most to timely completion rates, and is also examining which variables show significant differences between high and low completing programs in five fields. In other words, the researcher is addressing the following two research questions:
1. What is the relationship between timely doctoral completion rates2 and the following variables (availability of graduate orientations, number of student support activities, average first year enrollment size, total number of enrolled students, percent of first year students with full financial support, percent of students with teaching assistantships, percent with research assistantships, median time to degree, existence of an annual student review, average GRE score, percent of students that are married, percent of students with dependents, percent of students with mentors, average satisfaction ratings with program, average sense-of-belonging rating, percent of students that are female, percent that are minorities, percent of faculty with grants, percent of faculty that are females, percent that are minorities, total number of faculty, and faculty to student ratio) in the:
a. Neuroscience field?
b. Chemical Engineering field?
c. Physics field?
d. Economics field?
e. English field?
f. All Programs group from these 5 fields combined?
2. When comparing doctoral programs with high completion rates and those with low completion rates3, which variables show statistically significant differences in the:
a. Neuroscience field?
b. Chemical Engineering field?
2
Within 6 years for programs in Neuroscience, Chemical Engineering, Physics, Economics, or within 8 years for programs in English.
3
c. Physics field?
d. Economics field?
e. English field?
f. All Programs group from these 5 fields combined?
Theoretical Framework
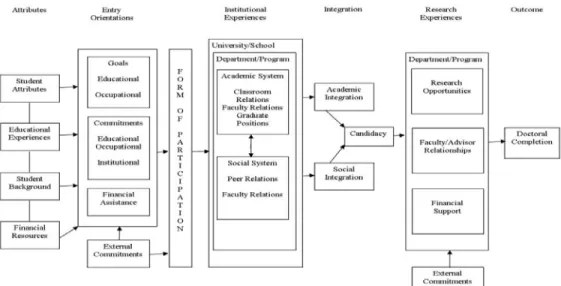
After years of contributing to the topic of undergraduate persistence, Tinto laid the foundation for a theory on doctoral student completion in his 1993 book on undergraduate attrition. Tinto went on to present a longitudinal model of doctoral persistence (see Figure 1, p. 13), but pointed out that one simple model could not fully describe the complexities of graduate persistence.
Tinto believed that doctoral completion could be affected by multiple factors including: student attributes, financial assistance, institutional and program experiences, academic and social integration into a program, and research experiences (Kluever, 1997). Tinto’s model and theory was not offered as a strict formula, but rather as a comprehensive framework
encompassing student, faculty and program factors. As such, this researcher is not examining all the components of the model but rather is seeking to address the most measurable variables that can be most influenced by a university program.
Methodology
The dependent variable (DV) in this study is the average completion rate of doctoral degrees within six years in Neuroscience, Chemical Engineering, Physics and Economics, or within eight years for programs in English.4 The dependent variable is an average rate because completion rates were computed from five cohorts (groups of students who entered from
4
97 to 2000-01) and then averaged. The independent variables in this study consist of Program, Student and Faculty Variables (see Table 1, p. 12). The researcher is employing the use of multiple regression, independent T-test and chi-square analyses to examine which factors
contribute the most to timely completion rates in selected doctoral programs and to compare high and low completing programs across multiple variables. The level of significance for all tests (including the multiple independent T-tests) is set at.05 (α = .05) to minimize Type II errors.
In multiple regression analysis, a mathematical formula is created to show the size and strength of a relationship between multiple variables and an outcome variable. For this study, data from the NRC’s Data-Based Assessment of Research-Doctorate Programs in the United
States is being analyzed to examine the relationships between Program, Student, and Faculty
Variables and timely completion rates in doctoral programs. The analysis will further determine the R2value, which shows how much of the variation in the dependent variable can be accounted for by the 22 independent variables. Independent T-tests and chi-squares will then compare high and low completing programs across all 22 variables. To determine the cutoffs for each field’s high- and low-completing groups, this researcher is using the national average of completion in each field ± 10 percentage points. Data analysis will be carried out using the SPSS program.
Limitations
The use of secondary data and non-experimental research methods did not allow the researcher to manipulate or control the dependent or independent variables. For instance, the parameter of timely completion was set by the previous researchers who produced the secondary dataset. The data collection process and the inclusion or exclusion of certain variables was outside the supervision of this researcher as well.
Next, the student survey was completed by advanced students already admitted to candidacy and no individual follow-up was completed. As a result, an aggregate score from the student questionnaires had to be used rather than individual scores. Also, the student data that was collected in the original NRC study was limited to doctoral candidates from only five fields, due to the high cost of sending surveys to students in every field. Although it would have been ideal for every student to have been surveyed, the group that received the questionnaires represented 113 institutions (out of the original 212), and also represented every broad field except for Agricultural Sciences.
Finally, although the NRC performed numerous data and accuracy checks, details about the coordinators at each institution who responded to the questionnaires were not provided by the original study. Published critiques of this survey exist and these critiques are discussed at length in Chapter Two. Although aware of the issues related to secondary data use, this researcher believes that the ample sample size, quality and breadth of the data set outweighed the limitations.
Delimitations
This study is examining completion rates – not attrition, persistence or retention rates.
Completion studies measure only final outcomes; whereas persistence studies track students
through the various stages of attrition, and retention studies track continued registration (NSF, 1998). Thus, this research does not consider whether a non-completer left voluntarily or involuntarily from a program. Nor does it have any data pertaining to students’ or faculty members’ perceptions of why a non-completer left a program. Instead, this study is solely
Secondly, this researcher purposefully did not include all the variables that were available from the original NRC dataset. Variables that came from the Institutional Questionnaire were left off since the unit of analysis for this study is the program, and not the institution. Variables calculated from an “Allocated Faculty” number were also not included. In the original study, a formula was used to allocate a percentage of contribution to each program for faculty members who worked in multiple programs. For the purposes of this study, the researcher decided to use raw numbers only rather than include those figures based on a formula.
In terms of methodology, the researcher decided a priori to select an alpha level of .05 for both the regression and independent T-test analyses. Although several independent T-tests will be conducted, the researcher selected an alpha level of .05 in an effort to limit Type II errors – the error of not rejecting the null hypothesis when it is false. Finally, 380 programs collected information from Programs, Faculty, and Students, however only 365 programs will be used in this study because 15 programs had missing information.
Significance of the Study
Roughly half of all doctoral students nationwide do not finish their degrees. This has been the case for decades, however recently this issue has gained a national audience. As more parties become interested in the transparency and accountability of doctoral programs, studies like this one that look at objective data to examine doctoral completion rates are needed. The wealth of data that was collected from the NRC has not been paralleled in the past. Thus, the analysis in this study is able to include numerous variables simultaneously. This inclusion of program, student and faculty variables should help explain a larger percentage of variance in completion rates. It should also reveal the usefulness or lack thereof in evaluating objective data when examining doctoral completion.
The secondary dataset came from the NRC assessment, whose rankings have been called "the gold standard" by biomedical engineer John M. Tarbell and physicist Peter Woit, and in news releases by Cornell University and the University of California. The Center for Public Anthropology also praised the National Research Council's 2010 rankings as "an impressive achievement" for its move away from reputational rankings and toward data-based rankings.” The multiple regression analyses, based on this reputable data, will present which factors are significantly related to timely completion rates. Program leaders and other interested parties can use these findings to determine which factors to focus on as they seek out ways to increase completion rates. In addition, the t-test and chi-square analyses will present a comparison between high and low completion groups, and reveal whether those differences are uniform across disciplines or unique to each field. Program administrators can then further use those findings to focus their efforts on variables that show significant differences between the two groups in their specific field.
As mentioned earlier, other studies have previously looked at relationships between specific variables and completion, however nearly all of the studies cited the limitation of small sample size. This study, on the other hand, has the advantage of a rather large sample size. Furthermore, previous studies generally used the student as the unit of analysis, whereas this study is using the program. Instead of looking at factors related to a specific student’s
completion or non-completion, this study is examining how factors relate to a program’s overall completion rate, and thus puts the onus for change on the program.
Definition of Terms
The following definition of terms offers the reader a context for understanding the terminology in this study:
All Programs Group – All 365 programs in the dataset from the following five fields: Neuroscience, Chemical Engineering, Physics, Economics and English.
Attrition – “The proportion of the entering cohort into a doctoral degree program that does not complete the graduate program undertaken” (NSF, 1998).
Dissertation Committee – A committee made up of graduate faculty that provides expertise and guidance throughout the dissertation process.
Cohort – A specific entering group of doctoral students.
NRC study – the National Research Council’s Data-Based Assessment of Research-Doctorate
Programs in the United States (2011).
Persistence – A student continuing progress toward doctoral degree completion. Retention – the rate at which students continue in a program.
Socialization – the process of integrating into one’s surrounding culture.
Timely Completion Rate – the number of students who graduated within six years in
Neuroscience, Chemical Engineering, Physics and Economics, or who graduated within eight years in English, divided by the total number of students who initially enrolled in a specified program.
Organization of the Study
Chapter One contains an introduction to the study, the purpose and significance of the study, the research questions, limitations and delimitations, definition of terms, and an overview of the methodology. Chapter Two will provide a review of the literature. Chapter Three will describe the methodology used in the study, the instrument, the research design, and the procedures used to obtain the research data. Chapter Four will present an analysis of the data,
and Chapter Five will contain a summary of the findings, conclusions, implications and future recommendations.
Tables and Figures
Table 1: List of Independent Variables Program Characteristics Student Characteristics within a Program Faculty Characteristics within a Program Availability of a graduate orientation Number of student support activities Average 1st year enrollment size Total number of students enrolled in the program Percent of first year students with full financial support Percent with teaching assistantships Percent with research assistantships Median time to degree Existence of an annual student review Average GRE score Percent of students that are married Percent of students with dependents Percent that have mentors Average satisfaction rating with overall quality of program Average sense-of-belonging rating Percentage of students that are females Percentage of students that are non-Asian minorities Percentage of faculty with grants Percentage of faculty that are females Percentage of faculty that are non-Asian minorities Total number of faculty Faculty to student ratio
CHAPTER TWO
REVIEW OF THE LITERATURE
Introduction
This chapter begins with a brief history of the doctoral degree and an overview of doctoral completion / attrition. It then reviews past studies on program, student or faculty
variables and their relationships with doctoral student completion rates. Since there are numerous variables related to completion, the researcher used Tinto’s Model of Doctoral Persistence (see Figure 1) to frame and structure this review. Studies in this section have been organized
according to the following themes: program orientations and social activities, academic and student support, student characteristics, student finances, faculty research and faculty diversity. This chapter also includes an overview of the original NRC study, and then closes with recent national initiatives and current recommendations for lowering doctoral attrition rates.
Brief History of the Doctoral Degree
In Medieval Europe, study was categorized into four fields: the basic faculty of arts, and the three higher faculties of medicine, law, and theology. Initially the titles of master and doctor were used interchangeably, but by the late Middle Ages the terms Master of Arts and Doctor of Medicine, Doctor of Laws and Doctor of Theology had become widely accepted (DeRidder-Symoens, 2003; Pederson, 1997). Through the educational reforms in Germany in the early 19th century, the arts faculty began to require contributions to research for the award of their final degree – the Doctor of Philosophy (Ph.D.). Originally, the curriculum of the arts faculty was
based upon the trivium and the quadrivium, but by the 19th century it had come to include all the subjects now typically referred to as sciences and humanities (Ruegg, 2004).
In 1861, Yale University adopted these German reforms and began granting the Ph.D. to students who had completed a specified course of graduate study in the humanities and sciences and who had successfully defended a dissertation containing original research. Edward Bouchet was the first African American to earn a doctorate degree from an American University in 1876. Then in 1877, Helen Magill White was the first woman to earn the Ph.D. in the United States. In 1900, the degree spread from the United States to Canada, and later in 1917, to the United Kingdom (Simpson, 1983).
Overview of Doctoral Completion and Attrition
According to Clark (1995), American doctoral programs are the premier training ground for the world’s future scientists and scholars. Yet there is little research available on doctoral completion or attrition. Research on the attrition rates of undergraduate students, on the other hand, is much more substantial. Cooke et al. (1995) suggests that universities find it less strategically important to follow up on doctoral students who do not complete due to the lesser volume of students involved. Furthermore, students who drop out are often difficult to locate, and the ones who are found provide information from recollections, which may change over time.
In 1999, Bair and Haworth provided an overview of 118 doctoral persistence and attrition studies completed between 1970 and 1998. They found that (1) attrition and persistence rates vary widely depending on field of study, and even more widely depending on program of study; (2) departmental culture affects doctoral student persistence; (3) difficulties with the dissertation relate to attrition; (4) academic achievement indicators, with the exception of graduate record
examination scores, are not effective predictors of degree completion; (5) employment and financial factors are poor indicators of persistence; and (6) retention rates vary widely among institutions (Bair & Haworth, 1999). Bair and Haworth provided an impressive overview of previous research on this topic, however the majority of the studies looked only at one program or one university and several cited the major limitation of small sample size. Using secondary data, this researcher is able to analyze data from 365 programs at 113 institutions.
Program Factors Related to Completion
It can be tempting to consider attrition solely at the individual level. Either the student did not have the “right stuff” intellectually or emotionally, or some external event (family, illness) intervened. While this allows for individual variation and nuance, it removes responsibility for attrition from the institution or the department (Golde, 1996; Nerad & Miller, 1996). Golde mentioned that another reason for this individualistic focus is that many studies have focused on student persistence, rather than looking at student attrition; “The persistence perspective puts the onus for achievement on the student, and obscures institutional or structural barriers to success” (Golde, 1994). However, Cooke et al. (1995) argued that a student’s detachment or isolation from a program – and not necessarily his individual characteristics – is what makes him more likely to drop out. While it can be argued that students determine their degree of involvement throughout their educational journey, programs are responsible for providing activities and establishing an encouraging environment for students to participate. This section looks at the impact of orientations and social activities, as well as the impact of academic and student support, on the academic success of doctoral students.
Orientations and Social Activities
Observers of the graduate community are acknowledging that "many graduate students when first entering their respective programs are just as confused and anxious as they were as new undergraduates" (Rosenblatt & Christensen, 1993). Boyle and Boice (1998) suggest that orientations are one of the most useful tools in helping students acclimate to the new
environment of graduate education. They go on to explain that since it is the department culture (and not necessarily the university culture) to which graduate students need to adjust, it would be beneficial to supplement a campus-wide orientation with a departmental one. Ideally,
orientations acquaint students to the norms and requirements of that particular department, plus they introduce incoming graduate students to key members of the department – including faculty, staff and advanced graduate students (Boyle & Boice, 1998).
Studies indicate that orientation programs tend to increase persistence and retention (e.g. Phillips, Daubman & Wilmoth, 1986; Washburn, 2002) and to reduce incoming student anxiety (Vlisides & Eddy, 1993). Such anxiety and stress is fairly common among new graduate students (Baird, 1990; Golde, 2000), and research shows that a welcoming environment is crucial in alleviating this stress and creating a smoother transition for the graduate student (Poock & Love, 2001; Rosenblatt & Christensen, 1993). It logically follows that the lack of departmental
orientation and advising has been reported as negatively affecting student completion rates (Bowen & Rudenstine, 1992, Nerad & Cerny, 1993).
In addition to orientations, graduate organizations can also assist students in acclimating to graduate school. These organizations serve several functions including: (a) advocating on behalf of graduate students, (b) identifying issues that are important to graduate students, and (c) ensuring that concerns of graduate students are addressed (Coultier et al., 2004). According to
Coultier et al. (2004), professional development workshops and social interaction with peers are two of the most expressed needs of graduate students. Tinto (1988) believes it is this social and intellectual integration that is key to a student’s academic success and persistence.
Academic and Student Support
The term academic support typically describes academic assistance such as research conferences, writing workshops, and library / computer seminars. Pinkston (1987) found that institutions with academic support programs were associated with higher retention rates than institutions without those programs. Presumably, by the time a student enters doctoral study, he has already had ample research and writing experience. However, this is not always the case. For international students in particular – which make up as much as 50% of the student body in engineering fields – writing support can mean the difference between the successful completion of a degree or the decision to leave early.
In a study on the persistence of African-American doctoral students, King and Cherypator (1996) found that the majority of the students who persisted made use of the educational tools that were available at their doctoral institutions (including computer labs, research assistance and library instruction). Barker et al. (1997) similarly found that students who were 25 and older gave high priority rankings to academic advising and library /computer services. Lovitts (2001) suggests that for graduate students in general, student- faculty
relationships and student involvement in academic life play an even bigger role in student persistence than social peer interaction.
Student Factors Related to Completion
Many educators and institutions want to “blame” attrition on students or on student capacity. Gilliam suggests that this is faulty thinking since there are typically no academic
differences between completers and non-completers as evidenced by GRE scores and
undergraduate GPA (2006). The idea that the admissions department is responsible for the 50% attrition rate also seems unlikely as the criteria for acceptance is often set at a high bar.
Furthermore, most demographic variables (including age, race and sex) do not conclusively distinguish those who persist from those who do not (Bair & Haworth, 1999).
Although a student’s background can strongly influence the initial choice of an undergraduate institution as well as the decision to eventually enroll in graduate school
(Ethington, 1986), the decision to stay normally depends on a much more complex set of factors (Ferrer de Valero, 2001). Ferrer deValero goes on to explain that individual characteristics, financial support and type, motivation and ability may all contribute to a student’s decision to persist. Dolph (1983) suggests moving away from investigations of students’ demographic variables altogether and moving toward more intrinsic research. Although motivational variables are not included in the current research dataset, this researcher will look at the impact of
students’ relationship ratings, their sense of belonging, as well as their financial support as suggested by Ferrer de Valero.
Student Characteristics
Past research has evaluated numerous student characteristics; this section will begin with demographic and psychological measures, and then conclude with research findings specifically related to the variables in the current study. Gittings (2010) looked at student and program variables at two institutions in Kentucky, and found that enrollment status of the student (part-time or full-(part-time) and the increase of age of the respondent have a positive influence on doctoral degree completion. A strong commitment to completion and personal persistence were also found to be critical to success (Golde, 2006). Deci and Ryan (1992) looked at extrinsic and
intrinsic motivation and discovered that a student’s sense of “competence and
self-determination” could affect his/her motivation to persist. Similarly in King and Chepyator-Thompson’s (1996) study on the persistence of African-American students, intrinsic motivation was most often cited by respondents who completed their degrees. One respondent wrote, “Those who graduated looked within themselves to find the strength, desire and focus they needed to reach their goals and these inner qualities guided them successfully through their doctoral experience” (King & Chepyator, 1996). According to Cooke et al. (1995), intent to remain, affective commitment, and need for achievement were all significant predictors of attrition.
Studies that have examined the relationship between GRE scores and doctoral degree completion contradict each other (Bair & Haworth, 1999), and undergraduate GPA was found to be related to doctoral student persistence in only a few studies (Cook & Swanson, 1978; Pristo, 1977). In addition, several other academic indicators have been studied, such as type and quality of undergraduate institution (Boozer, 1972) and junior/senior GPA (Lunneborg & Lunneborg, 1973). According to Bair and Haworth (1999), the majority of research evidence suggests that students’ academic characteristics in general are not reliable predictors of persistence through graduation for doctoral students.
In past research, race and sex were often found to have an effect on degree completion; white students typically have lower attrition rates than minority students (Naylor & Sanford, 1982, Zwick, 1991), and men have lower attrition rates than women (Bowen & Rudenstine, 1992, Girves & Wemmerus, 1988). In the STEM fields, Lott, Gardner and Powers (2009) found that the odds of attrition are greater for females, Asians, and for those in the hard-applied science majors. In 2005 alone, 45% of all doctorates conferred were given to those in the science and
engineering fields (Hoffer et al., 2006). Of those degrees, however, a disproportionate number (66%) were awarded to non-U.S. citizens, once again raising concerns about the future of STEM research in the United States (Council on Postsecondary Education, 2007).
Lovitts and Nelson (2000) pointed out that although women have higher attrition rates than men, they typically have higher undergraduate GPAs so the higher attrition rate is probably not an ability issue. In Cohen’s study (2011), nurses pursuing a Ph.D. often found it difficult to balance their studies, work and care of their families. Female students in particular reported feeling overwhelmed with multiple life responsibilities and management of numerous priorities (Lee, 2006). An older study found that women were at a disadvantage in finding role models and mentors, which could help explain the lower graduation rates as well (Berg & Ferber, 1983), and Felder (2010) mentioned that African-Americans similarly have a difficult time finding the right advisor. For students who do connect with a suitable mentor, the process of navigating through degree requirements can become much smoother. Based on their 2006 survey, Nettles and Millett indicated that a substantive mentoring relationship with a faculty member was positively related to the completion of a PhD or EdD. They further reported that 70% of doctoral students who persisted to graduation had a close supporting mentoring relationship (2006). West, Gokalp et. al (2011) similarly found that having a positive working relationship with the dissertation chair was vital to students’ success.
Student Finances
Two of the most commonly cited barriers to completion in a doctoral program are financial problems and pressures (Jones, 1987; Leadabrand, 1985). Ehrenberg and Mavros (1995) found that students who received fellowships or research assistantships had higher completion rates than those with teaching assistantships or who were totally self-supporting.
Although teaching and research assistants both receive financial support, research assistants generally have higher completion rates arguably because of the valuable experience they gain as researchers, which aids them during the dissertation process. Girves and Wemmerus suggested that students with teaching and research assistantships are more likely to complete their
doctorates because they are more likely to seek involvement in their programs and have the added benefit of engagement from faculty members (1998).
For most students, earning money while working on a dissertation is a major concern. For self-supporters, being employed often detracts from time that could be spent on the dissertation. One respondent in Gillingham, Seneca and Taussig’s (1991) study wrote, “Paid employment had more immediate demands so the dissertation was put off indefinitely.” Benkin (1984) further found that students’ financial status affected how quickly they completed their dissertations, and hence how quickly they graduated. Ferrer de Valero (2001) agreed that a lack of financial support lowers students’ possibility to successfully graduate in a shorter amount of time. However, unlike Ehrenberg, he found that completion rates were higher for students with teaching assistantships than for those with fellowships – at least in the humanities and social science fields (Ferrer de Valero, 2001).
Faculty Factors Related to Completion
The majority of studies that look at faculty’s impact on attrition levels focus on the relational aspects between faculty / major advisor and student (Bargar & Chamberlain, 1983; Heinrich, 1995; Ferrer de Valero, 2001). This researcher will instead look at the impact of faculty’s personal rather than relational factors, such as research experience and diversity.
Faculty Research
An orientation toward scholarship at an institution is characterized by faculty who are accessible to students, who are actively engaged in scholarly activities themselves and who clearly convey expectations and encouragement for students to engage in those activities (Weidman & Stein, 2003). While it seems obvious that students with a stronger research background would have an easier time completing their dissertations, it is less obvious how faculty’s involvement with research affects degree completion.
Nerad and Cerny (1993) found that graduate students who were encouraged to “dive into research” at the beginning of their programs often had shorter time to degrees. Fairweather (2005) noted that although faculty are often rewarded more for research than for teaching, there has been an increase in time spent by faculty on both research activities and teaching over the last two decades – as well as a resulting decrease in time spent on advising or counseling
(Milem, 2001). Some studies found that this increase in research production hinders faculty from assisting doctoral students in their endeavors, while other studies have found that faculty’s active engagement in research encouraged students to do the same. Hollingsworth and Fassinger
(2002), for example, found that research mentoring experiences make a notable contribution to students’ research productivity, and Krebs, Smither, and Hurley (1991) noted the positive relationship between a student’s perception of his research training environment and his subsequent research productivity.
Faculty Diversity
Literature on the recruitment of diverse faculty centers on minority populations and mostly uses the traditional definition of diversity (Sims, 2004). Sims (2004) goes on to explain that a diverse faculty usually includes members of the traditional racial and ethnic minority
groups (African-Americans, Asians, Hispanics/Latinos, Native Americans and Pacific Islanders). When looking at the low recruitment of minority faculty, studies cite multiple reasons such as small pools of qualified faculty candidates, absent mentoring and support programs on college campuses, feelings of isolation, and racist campus environments (Quezada & Louque, 2004; Dunn, 2005). Carriulo (2003) dismissed the “small pools of qualified candidates” notion by pointing out that the number of chemistry Ph.D.s awarded to African-Americans has actually doubled since 1990. He further stated that there is “a pipeline of qualified minority doctoral graduates from which universities can recruit, but these qualified individuals are recruited by their industries, historically black colleges and universities, and other employers.”
Other scholars believe the search or selection processes used at colleges are to blame. Smith et al.’s study (2004) suggested that “intentional hiring strategies will be required to promote success in the hiring of most underrepresented faculty outside of ethnic studies departments… however… because faculty success is dependent on department support and mentoring, continued research is needed to look at the success of faculty appointed with such interventions”. Other research focused on how the organizational structure and climate of a campus contributes to the attrition rate of minority faculty (Price et al., 2005). Quezada & Louque (2004) suggested that “schools and departments with high rates of attrition among faculty of color need to… recognize that something within their culture is causing faculty of color to leave.”
In relation to completion, Felder (2010) found that increased levels of students and faculty diversity positively affect socialization, especially that of minority doctoral students. In one qualitative study, an African-American student reported that he was told “tales of failure” more often that tales of success, and felt that African-American mentors might be more inclined
to collaborate on research related to minority issues (Felder, 2010). Fortunately, some programs have begun to address the under-representation of African American and Hispanic faculty. The McKnight Fellowship Program in Florida, for example, awards tuition plus an annual stipend to selected African American and Hispanic applicants in the hopes of increasing minority
enrollment in Ph.D. programs, and thus increasing the future pool of minority faculty candidates. Other programs – like AGEP and DIMAC – similarly aim to increase the number of
underrepresented minorities obtaining graduate degrees, and better prepare them for faculty positions.
The Original NRC Study
This study analyzes program, student and faculty data that was provided by the National Research Council in 2011. The original study, A Data-Based Assessment of Research-Doctorate
Programs in the United States, collected an unprecedented amount of data relating to research
productivity, student support / outcomes and program diversity from over 5000 programs at over 200 U.S. institutions. This impressive data set covered multiple variables, and was made
available electronically to allow for the updating of important information on a continual basis. It was the intent of the NRC study to measure traits of doctoral programs in order to allow
comparisons among programs within a field of study and to provide a basis for self-improvement within the disciplines (Ostriker et. al., 2011).
Earlier NRC reports that were published in 1982 and 1995 provided doctoral program rankings based on faculty opinions of program quality. In these previous studies, the ratings and rankings were derived from surveys in which faculty members were asked to assess the scholarly quality and effectiveness in education of individual doctoral programs in their own fields
one reputation-based measure was an inadequate means of describing and assessing the full range of US doctoral programs. In response to that reaction, the most recent NRC study used objective data rather than a reputational measure to estimate overall quality of doctoral programs. The extensive reliance on data in the latest NRC study required the collection of an enormous amount of information that had not been routinely or systematically collected by doctoral programs in the past. Graduate schools, program administrators, institutional researchers, and individual doctoral faculty all spent countless hours gathering and clarifying the information on which the NRC assessment was based. As a result, this focus on data collection has improved practices for recording quantitative information in doctoral programs and for allowing qualitative assessments of doctoral programs to be based on that information. Although the assessment went on to present two possible ways of ranking doctoral programs, the committee considered the rankings to be illustrative, and declared that “the most important benefits of this study will flow from examination and analysis of the data that were collected”, rather than from the rankings themselves (Ostriker et. al.,2011).
The program was chosen as the primary unit for analysis because programs admit students, offer degrees, and are the “obvious target of student interest” (Ostriker et. al., 2011). The program questionnaire (see Appendix A), which requested information on the size, scope, and other components of each program, was electronically sent to each institution’s research office. It also included questions on financial aid and training practices. Additional information was collected about time to degree and completion rates, and whether the program followed student progress completion. The faculty questionnaire (see Appendix B), which was sent to all faculty identified as doctoral faculty by their respective institutions, collected data on work history, funding, publications, and demographic characteristics. The faculty questionnaire also
asked respondents to rate the relative importance of program and faculty productivity, and to rate the relative importance of components within those two larger categories (Ostriker et. al., 2011). Faculty members were asked to do these ratings so that the illustrative rankings would be based on measures that were ranked most important by faculty. The student questionnaire (see
Appendix C) gathered information about student educational background and demographic characteristics, as well as research experiences, scholarly productivity, and satisfaction with multiple aspects of the program. Questionnaire and response rates from the NRC Assessment are provided in Table 2 (p.36).
When the report was finally published in 2011, readers quickly pointed out that the data was already dated (five years old), and that the methodologies used to derive the two illustrative rankings were flawed. Many readers expected the study to be similar to NRC’s previous study from 1995, which provided a clear ranking of programs within each discipline. However, in the opening chapter of the NRC 2011 publication, the committee immediately stated that “the reader who seeks a single, authoritative declaration of the ‘best programs’ in given fields will not find it in this report.” Instead, this NRC report sought out to present the various quantitative aspects of each program and then let the reader decide which variables were important to them. The committee provided two illustrative rankings, but pointed out that several approaches could be used to evaluate and rate programs based on the data. This lack of a definitive ranking proved to be a disappointment to many readers who were eagerly waiting to compare results from the 1995 study. Neither contention (dated data nor multiple methodologies) is a hindrance in the present researcher’s study; this researcher is examining the relationships between specific variables and timely completion rates and is only interested in the data collected for the report – not the rankings nor the ranking methodologies.
Other issues that were noted with the NRC Assessment fall into the following categories: Omissions, Interdisciplinary issues/faculty allocations, Classification errors/ranking-related problems, and Clerical mistakes/possible input errors. Table 3 (p. 36) contains a description of each of these issues and an explanation of how the current research is either unaffected or minimally affected by each issue.
The NRC Dataset
In the NRC study – as well as the current study – Ph.D. programs were the unit of analysis. The NRC study defined a program as a unit of graduate study that performed at least three of the following four activities:
1. Enrolled students in doctoral study 2. Designated its own faculty
3. Developed its own curriculum
4. Recommended students for doctoral degrees
In addition to meeting these criteria, a program must also have produced at least five doctorates between 2001-2002 and 2005-2006 to have been included in the study. Seventy-two percent of the doctoral programs in the dataset came from public universities. Data collection was
administered by the project’s survey contractor, Mathematica Policy Research (MPR), and to preserve confidentiality, replies were sent directly to MPR.
The student dataset came from the Admitted-to-Candidacy Doctoral Student
Questionnaires that were completed online by doctoral candidates in five fields. The five fields were Neuroscience, Chemical Engineering, Physics, Economics, and English. These fields were selected because of their large size and because they represented all but one of the broad fields.
Although all programs vary in their own established set of regulations, programs in these fields typically have the following requirements in addition to their set of core and elective courses:
Neuroscience:
Students are generally engaged in research during every quarter.
The core curriculum often includes laboratory rotations, which allows students to explore
possible laboratories for thesis work.
Students are strongly encouraged to attend seminars or weekly one-hour colloquiums.
There is typically a minimum teaching requirement of one quarter.
Students generally begin as research apprentices and then pursue their own investigations
(culminating in a dissertation or thesis). Chemical Engineering:
Students can enter with a bachelor’s or master’s degree (as most institutions do not offer a terminal master’s degree).
Research is heavily emphasized from the beginning of the program.
Students are generally required to complete a minimum of two teaching assistantships.
Students must pass a written and/or oral qualifying exam and defend a research proposal.
Some programs require a written dissertation and/or a dissertation defense, while others
require a presentation at a technical conference. Physics:
Students can enter with a bachelor’s or master’s degree; an M.S. degree is usually an
intermediary step in the program.
Research is the central focus of the degree and is often conducted in collaboration with a
Admission to candidacy is usually based on a research proposal and defense (rather than
a comprehensive examination).
Students generally complete a thesis based on original research and present the results in
a final defense. Economics:
General written examinations in microeconomics and macroeconomics are typically administered at the end of the first year of study.
Students must also successfully pass two field exams within the next year of study.
Generally, a paper requirement must be completed by the third year of study and presented in a seminar.
A written dissertation is generally required, but many programs do not require an oral defense.
English:
There is usually a foreign language requirement (either mastery in one foreign language
or proficiency in two).
After a comprehensive exam in the third year, students generally begin exploring a
dissertation topic under the guidance of an advisor.
Students are normally expected to complete a book-length thesis of original work. Some
programs allow “creative dissertations” in the form of a novel, a novella or a collection of poetry.
There were originally 12,138 responses to the student questionnaires. Programs that returned ten or fewer student questionnaires were removed from the dataset so the remaining response count
was 10,819. Table 4 (p. 37) shows the Response Rates from the Student Questionnaires listed by field.
For the faculty dataset, the committee of the NRC study chose to define faculty as those who had directed doctoral research dissertations within the last five years. “Core” faculty members were those whose primary appointment was in the doctoral program; “New” faculty members were those with tenure track appointments who were appointed in 2003-2006. A distinction was further made and labeled “Allocated Faculty” to prevent over-counting the productivity of faculty who were involved with multiple programs. For this study, the researcher has chosen not to use any data based on “Allocated Faculty” as that figure was based on a formula rather than raw numbers. Lastly, data regarding publications in the scholarly literature were obtained by the Thomson-Reuter list of publications.
Recent National Initiatives
Recently, the problem of doctoral attrition has reached a national audience. In 2007, the Council of Graduate Schools published the first of five monographs titled, “Ph.D. Completion and Attrition”, which provided an analysis of baseline demographic data, findings from exit surveys, and policies and practices to promote student success. The third monograph used self-reported data from Ph.D. completers at 18 participating institutions to examine respondents’ experiences and opinions regarding the following factors and their role in Ph.D. completion: selection/admission processes, availability and quality of mentoring and advising, extent and adequacy of financial support, program environment, curricular processes and procedures, and research experiences. The study reported that the top three main factors that contributed to respondents’ ability to complete were financial support, mentoring/advising, and non-financial family support (Council of Graduate Schools, 2009).
Other recent national initiatives concerned with doctoral education include the
Responsive Ph.D. Project (which seeks to bridge the mismatch between doctoral training and the careers that follow), the Carnegie Initiative on the Doctorate (which was similarly committed to restructuring programs to better fit graduates), and AGEP programs (which aim to increase the number of underrepresented minorities obtaining graduate degrees and better prepare them for faculty positions). The NSF’s Doctoral Initiative on Minority Attrition and Completion
(DIMAC) is another on-going study which will examine patterns of attrition and completion among underrepresented minorities in the STEM fields. These national initiatives have provided a solid foundation for continuing conversation about the actions required to ensure advancements in doctoral education, and commendably, many institutions are now committed to “reform” efforts in response to the issues uncovered by these reports (Council of Graduate Schools, 2004).
Recommendations for Improving Completion Rates
Universities have also begun making recommendations for improving this national problem of doctoral attrition. A study by the Graduate Center for Research, Writing, and Proposal Development at Western Michigan University (WMU), for example, produced the following recommendations that were disseminated within that university in a top-down fashion (Di Pierro, 2007):
1. Continue to measure outputs in all departments and note trends in time to degree that may protract the process;
2. Develop culturally diverse advising models;
3. Encourage development of the dissertation topic early in the student’s doctoral education; 4. Make the dissertation seminar a collaborative enterprise that culminates in a final product