A
University
of
Sussex
DPhil
thesis
Available
online
via
Sussex
Research
Online:
http://sro.sussex.ac.uk/
This
thesis
is
protected
by
copyright
which
belongs
to
the
author.
This
thesis
cannot
be
reproduced
or
quoted
extensively
from
without
first
obtaining
permission
in
writing
from
the
Author
The
content
must
not
be
changed
in
any
way
or
sold
commercially
in
any
format
or
medium
without
the
formal
permission
of
the
Author
When
referring
to
this
work,
full
bibliographic
details
including
the
author,
title,
awarding
institution
and
date
of
the
thesis
must
be
given
I
The Consistent Estimation of Future Cash Flow and Future Earnings:
An Accounting Prediction Model with Double Entry Constraint
A THESIS
Submitted by
Ehsan Khansalar For the award of the Degree of
DOCTOR OF PHILOSOPHY
SCHOOL OF BUSINESS, MANAGEMENT AND ECONOMICS
MANTEL BUILDING, UNIVERSITY OF SUSSEX, BRIGHTON, BN1 9RF
II
ACKNOWLEDGEMENTS
This thesis would not have been possible without the kind support, the trenchant critiques, the probing questions, and the remarkable patience of my thesis advisor - Prof. Stuart McLeay. I am heartily thankful to him.
He has taught me, both consciously and unconsciously, how good empirical accounting work is done. I appreciate all his contributions of time, ideas, and funding to make my Ph.D. experience productive and stimulating. The joy and enthusiasm he has for his research was contagious and motivational for me, even during tough times in the Ph.D. pursuit. I am also thankful for the excellent example he has provided as a successful accountant, auditor and professor.
I gratefully acknowledge the funding sources that made my Ph.D. work possible. I was funded by the Azad University in Iran- Shiraz Branch. My work was also supported by School of Business, Management and Economics in the University of Sussex, and the Discipline of Accounting in the University of Sydney. My time there was made enjoyable in large part due to the friends that became a part of my life. I am grateful for time spent with my colleagues from Iran who are experienced lecturers and auditors and accountants, Dr. Javad Izadi and Dr. Mahmoud Lari .
In the end, I would like to thank my family for all their love and encouragement. For, my parents who raised me with a love of science and supported me in all my pursuits - Thank you.
Ehsan Khansalar August 2011
III
I hereby declare that this submission is my own work and that, to the best of my knowledge and belief, it contains no material previously published or written by another person nor material which has been accepted for the award of any other degree or diploma of the university or other institute of higher learning, except where due acknowledgment has been made in the text.
Signature: Name:
IV
The Consistent Estimation of Future Cash Flow and Future Earnings: A Predictive Model with Accounting Double Entry Constraint
Abstract
In empirical financial accounting research, there continues to be a debate as to what the best predictors of future earnings and future cash flows might be. Past accruals, earnings and cash flows are the most common predictors, but there is no consensus over their relative contributions, and little attention to the underlying accounting identities that link the components of these three prominent variables. The aim of this thesis is to investigate this controversy further, and to apply an innovative method which yields consistent estimations of future earnings and cash flows, with higher precision and greater efficiency than is the case in published results to date. The estimation imposes constraints based on financial statement articulation, using a system of structural regressions and a framework of simultaneous linear equations, which allows for the most basic property of accounting - double entry book-keeping - to be incorporated as a set of constraints within the model. In predicting future cash flows, the results imply that the constrained model which observes the double entry condition is superior to the models that are not constrained in this way, producing (a) rational signs consistent with expectations, not only in the entire sample but also in each industry, (b) evidence that double entry holds, based on the Wald test that the estimated marginal responses sum to zero, and (c) confirmation of model improvement by way of a higher likelihood and greater precision attached to predictor variables. Furthermore, by then using an appropriately specified model that observes the double entry constraint in order to predict earnings, the thesis reports statistically significant results, across all industries, that cash flows are superior to accruals in explaining future earnings, indicating also that accruals with a lower level of reliability tend to be more relevant in this respect.
V
CHAPTER 1- INTRODUCTION ... 1
CHAPTER 2- FINANCIAL STATEMENT ARTICULATION AND THE PREDICTION OF CASH FLOWS AND EARNINGS ... 11
2-1 Financial statement articulation ... 12
2-2 The prediction of future cash flows and earnings ... 40
2-2-1 The prediction of future cash flows ... 41
2-2-2 The prediction of future earnings ... 50
2-3 Reliability of accruals in the prediction of future earnings ... 55
CHAPTER 3 - DATA STRUCTURE AND METHODOLOGY ... 66
3-1 Signs for variables under financial statement articulation ... 67
3-1-1 Signs for balance sheet variables ... 68
3-1-2 Signs for income statement variables ... 71
3-1-3 Signs for cash flow statement variables ... 74
3-1-4 A summary of imposed signs ... 76
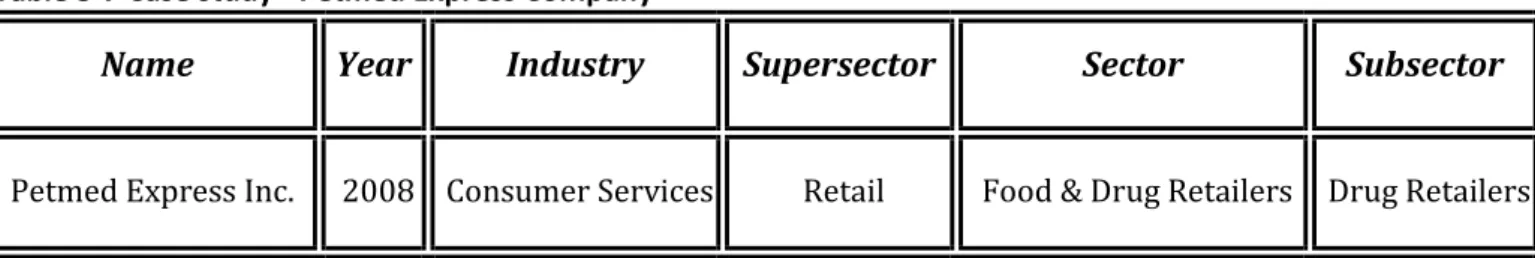
3-1-5 An example: Petmed Express Company ... 78
3-2 The double entry constraint in cash flow prediction ... 82
3-2-1 Articulation ... 82
3-2-2 Articulated cash flow statement variables: mean values ... 92
VI
3-3-1 Operating income ... 132
3-3-2 Non-operating income ... 133
3-3-3 Imposing constraints on the prediction of future earnings ... 135
3-4 The structural statistical model ... 137
3-4-1 The generalised framework: Seemingly Unrelated Regression ... 138
3-4-2 Predetermined information ... 142
3-4-3 Estimation matrix for future cash flows ... 143
3-4-4 Estimation matrix for future earnings ... 146
CHAPTER 4 - DATA AND SAMPLE SELECTION ... 148
4-1 Sample selection ... 149
4-1-1 Sample selection: validating the articulation ... 150
4-1-2 Sample selection: identifying extreme values ... 153
4-1-3 Sample selection: determining influential observations ... 159
4-2 Industry distribution ... 161
4-3 Descriptive statistics ... 164
CHAPTER 5 - RESULTS ... 172
VII
5-1-3 Predictive ability and estimation errors ... 201
5-1-4 Comparing likelihood ratios ... 205
5-1-5 Breusch-Pagan Lagrange multiplier test of residual correlation ... 208
5-1-6 Explanatory power of accruals and earnings ... 209
5-2 Prediction of future earnings ... 211
5-2-1 Industry analysis ... 221
5-3 Reliability of accruals ... 224
Chapter 6 - CONCLUSION ... 228
VIII
ACP Accrued payroll CSI Cash and short-term investments Cu
rren t a ss ets Balance she et Ch ang e
APA Accounts payable ARE Accounts receivable
ARE Accounts receivable INV Total inventory
CED Capital expenditure (net of asset
disposals) PRE Prepaid expenses
CGS Cost of goods sold OCA Other current assets
CSI Cash and short-term investments TCA Total current assets
DDA Depreciation, depletion and amortization PPE Property plant and equipment Long
-term
a
ss
ets
DIN Deferred income LTR Long-term receivables
DIR Debt issues (net of debt repayments) IUS Investments in unconsolidated
subsidiaries
DOP Discontinued operations OIN Other investments
DPA Dividend payable OLA Other long-term assets
DTU Deferred tax in untaxed reserves TLA Total long-term assets
DTX Deferred tax TA Total assets TCA+TLA
EBIT Earnings before interest & taxes APA Accounts payable Cu
rren
t li
abil
iti
es
ECH Extraordinary charge STD Short-term debt
ECR Extraordinary credit ACP Accrued payroll
EGL Extraordinary items and gain(loss) on sale of assets
ITP Income tax payable
EIE Equity interest earnings DPA Dividend payable
FCF Financial cash flows OCL Other current liabilities
GRI Gross income TCL Total current liabilities
ICF Investing cash flows LTD Long-term debt Long
-term
liabil
ities
ICP Interest capitalized PRC Provision for risks and charges
IED Interest expense on debt DIN Deferred income
IIN Interest income DTX Deferred tax
INV Total inventory DTU Deferred tax in untaxed reserves
ITP Income tax payable OLL Other long-term liabilities
ITX Income taxes TLL Total long-term liabilities
IUS Investments in unconsolidated
subsidiaries TL Total liabilities
LTD Long-term debt SEQ Shareholders’ equity
Equi
ties
LTR Long-term receivables PST Preferred stock
MIE Minority interest in earnings NER Non-equity reserves
MIN Minority interest in net assets MIN Minority interest in net assets
NCD New capital (net of dividends) TEQ Total equity
NER on-equity reserves TLE Total liabilities and equity TCL+
IX ite m s ( OP I) Inc om e s tate m ent
OCA Other current assets DDA Depreciation, depletion and
amortization
OCF Operating cash flows GRI Gross income
OCL Other current liabilities SAE Selling and administrative
expenses
OIA Other income (expense) - after tax OOE Other operating expense
OIE Other income (expense) – net TOE Total operating expenses
OIN Other investments OPI Operating income
OLA Other long-term assets ECR Extraordinary credit
N on -operat in g ite m s ( N OI )
OLL Other long-term liabilities ECH Extraordinary charge
OOC Other operating cash flow IIN Interest income
OOE Other operating expense PEI Pre-tax equity interest earnings
OPI Operating income OIE Other income (expense) – net
ECF Exceptional cash flow EBIT Earnings before interest & taxes
PAY Supplier payments IED Interest expense on debt
PEI Pre-tax equity interest earnings ICP Interest capitalized
PPE Property plant and equipment PTI Pre-tax income
PRC Provision for risks and charges ITX Income taxes
PRE Prepaid expenses MIE Minority interest in earnings
PST Preferred stock EIE Equity interest earnings
PTI Pre-tax income OIA Other income (expense) - after tax
REC Customer receipts DOP Discontinued operations
SAE Selling and administrative expenses NIE Net income before extraordinary
items
SAL Sales EGL Extraordinary items and gain(loss)
on sale of assets
SEQ Shareholders’ equity NI Net income (before preferred
dividends) OPI + NOI
STD Short-term debt REC Customer receipts
Operating Ca sh flo w state m ent
TA Total assets PAY Supplier payments
TCA Total current assets OOC Other operating cash flow
TCL Total current liabilities ECF Exceptional cash flow
TEQ Total equity TXP Tax payments and provision
settlements
TL Total liabilities OCF Operating cash flows
TLA Total long-term assets CED Capital expenditure (net of asset
disposals) Inv es ti ng
TLE Total liabilities and equity ICF Investing cash flows
TLL Total long-term liabilities DIR Debt issues (net of debt
repayments) Financi
ng
TOE Total operating expenses NCD New capital (net of dividends)
X
Table 1-1 Balance sheet changes for the average company ... 8
Table 1-2 Income statement for the average company ... 9
Table 1-3 Cash flow statement for the average company ... 10
Table 2-1 Articulation among the financial statements – Mann (1984) ... 13
Table 2-2 Articulation among the financial statements - appropriately signed ... 15
Table 2-3 CFA suggestions to improve financial statement quality ... 34
Table2-4 Accruals reliability ... 65
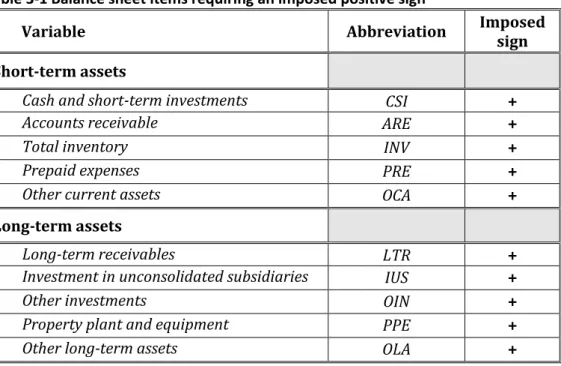
Table 3-1 Balance sheet items requiring an imposed positive sign... 69
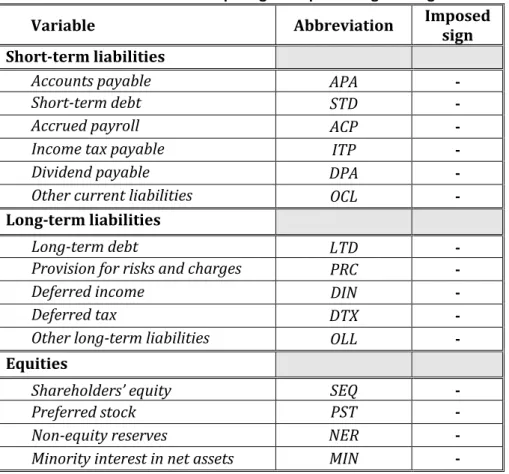
Table 3-2 Balance sheet items requiring an imposed negative sign ... 70
Table 3-3 Income statement items requiring an imposed negative sign ... 72
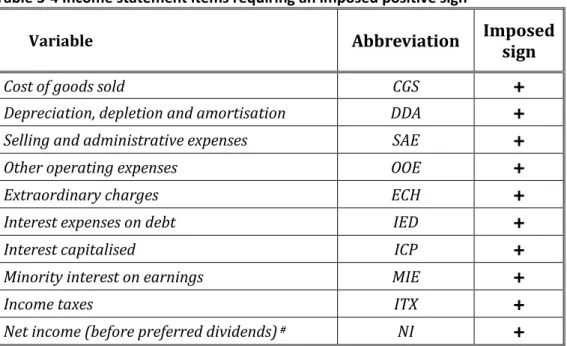
Table 3-4 Income statement items requiring an imposed positive sign ... 73
Table 3-5 Cash flow statement item signs ... 75
Table 3-6 A summary of sign allocation ... 77
Table 3-7 Case study - Petmed Express Company ... 78
Table 3-8 Balance sheet for Petmed Express Company ... 80
Table 3-9 Income statement for Petmed Express Company ... 81
Table 3-10 Articulation of financial statement variables in the prediction of future cash flows ... 93
Table 3-11 Articulation of financial statement variables in the prediction of future earnings ... 121
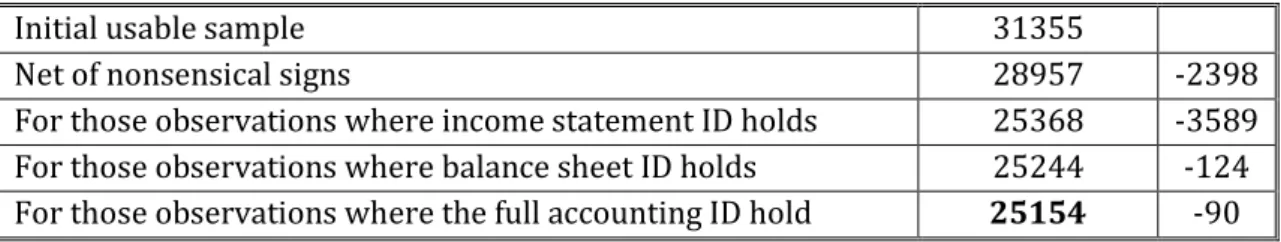
Table 4-1 Construction of the estimation sample ... 153
Table 4-2 Rational signs for the usable sample ... 153
XI
Table 4-6 Sample selection – prediction of future earnings ... 158
Table 4-7 Variables with influential non-zero values ... 159
Table 4-8 Final sample selection: prediction of future cash flows ... 160
Table 4-9 Final Sample selection: prediction of future earnings ... 161
Table 4-10 Industry Classification ... 162
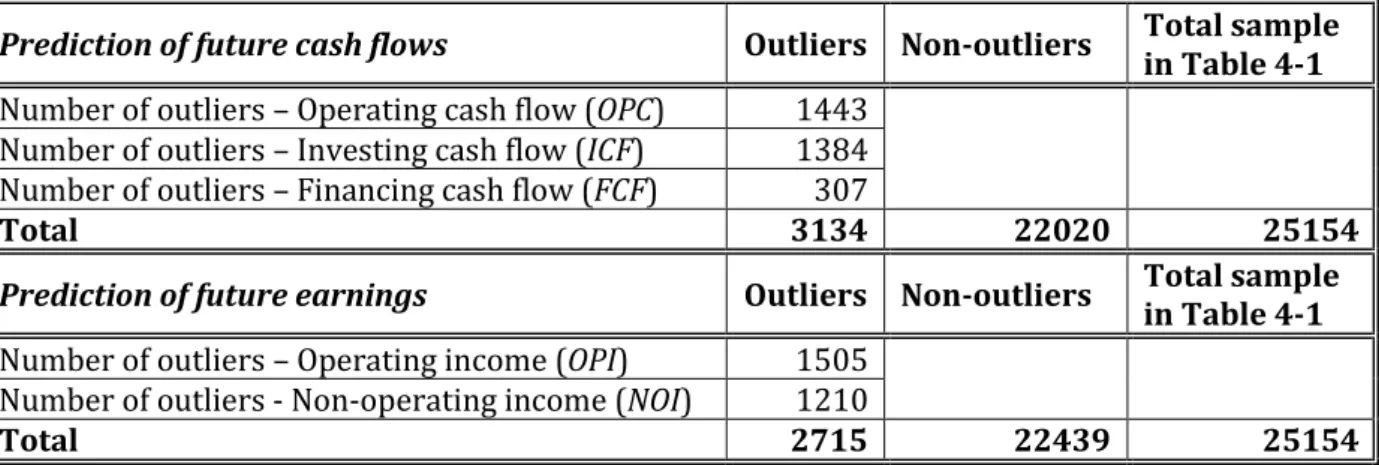
Table 4-11 Industry distribution - prediction of future cash flows ... 163
Table 4-12 Industry distribution - prediction of future earnings... 164
Table 4-13 Descriptive statistics - prediction of future cash flows ... 167
Table 4-14 Descriptive statistics – prediction of future earnings ... 169
Table 5-1 Regression results for OLS Model (1) – operating cash flow... 180
Table 5-2 Multicollinearity test – operating cash flow ... 182
Table 5-3 Regression results for OLS Model (1) – investing cash flow ... 183
Table 5-4 Multicollinearity test - investing cash flow ... 183
Table 5-5 Regression results for OLS Model (1) – financing cash flow ... 184
Table 5-6 Multicollinearity test – financing cash flow ... 185
Table 5-7 Regression results for SUR Model (2)... 187
Table 5-8 Regression results for decSUR Model (3) ... 191
Table 5-9 A comparison between models (1), (2) and (3) ... 193
Table 5-10 Regression results by industry for the SUR Mmodel (2) ... 196
Table 5-11 Regression results by industry for the decSUR model (3) ... 198
Table 5-12 Summation of coefficients for the OLS model (1) ... 200
Table 5-13 Log-likelihood, AIC and BIC ... 206
XII
XIII
Figure 2-2 Double Entry Information (Left) and Single Entry Information (Right) 23 Figure 2-3 Double entry equilibrium ... 28 Figure 5-1 Variable standard errors for each model ... 203 Figure 5-2 Variable t-statistics for each model (OLS, SUR and decSUR) ... 203
1
2
CHAPTER 1- Introduction
The ‘articulation’ of financial statements is an inherent outcome of the double entry system, because every transaction that is recorded in an account will always be mirrored in one or more other accounts, as debit and credit entries. Thus, when double entry is applied consistently to all transactions, and the financial statements are fully articulated, it will be theoretically possible to calculate an item such as operating cash flow not only directly by deducting the cash outflows reported in the cash flow statement from the cash inflows, but also by differencing the revenues and expenses reported in the income statement and adjusting this for changes in the relevant line-items in the balance sheet.
The most basic acknowledgement of the articulation of financial statements in the context of cash flow prediction research is already implicit in studies such as Barth et al. (2001) and Arthur et al. (2010), who suppose that the current cash flow from operations that is reported in the cash flow statement is equal to the difference between the earnings reported in the income statement and the accruals reflected in balance sheet changes. Along similar lines, Basu (1999), Jordan and Waldron (2001) and Fischer et al. (2008), who present other versions of disaggregated cash flow, all imply articulation as they also draw on accounting line-items that are reported in the different financial statements.
With regard to predictive ability, it should be noted that each of the above studies finds the same result with respect to future operating cash flow - the disaggregated models which imply articulation are superior to the more
3
parsimonious aggregated models in terms of their explanatory power. The aim of the present study is to further develop research design in this area, using an advanced level of financial statement articulation based on all line-items in the income statement, the cash flow statement and the opening and closing balance sheets, and by making explicit the most basic property of double entry book-keeping in the disaggregation of financial statements items in order to predict components of future cash flow and components of future earnings. A more comprehensive definition and categorization of accruals is used in this thesis, as the complete set of financial statement items is employed both in the prediction of future cash flows and the prediction of future earnings, and in evaluating in the latter case the reliability of accruals in such prediction. It is expected a priori that the models presented, which by design draw on all variables disclosed in the accounts together with their double entry identity, will be superior (in terms of the explanatory power of the predictor variables) to prior models that do not consider the double entry equilibrium condition under articulation.
More specifically, the first part of this thesis considers the prediction of three components of cash flow(operating, investing and financing cash flows) based on the accounting identities governing each of the three components involved. The predictor variables in the cash flow forecasts are the revenue and cost items in the income statement, the balance sheet changes that make up the total accrual, and the changes in the components of shareholders’ equity. In this respect, three different statistical models are employed: (a) multiple OLS regressions, (b) seemingly unrelated regressions, or SUR, and (c) constrained SUR. With the first model, the least squares regression, it is assumed that each of the linear equations
4
describing the above-mentioned cash flow components (operating, investing and financing) is unrelated to the other two. In the second model, these three linear cash flow equations are re-expressed as a set of simultaneous equations, related only through their correlated residuals. In the third model, the accounting relation among the predictor variables is imposed as a set of constraints, based on the double entry system.
In summary, the aim of the first part of the study is thus to consider whether imposing the double entry constraint on the simultaneous linear equations provides a superior model with which to estimate future cash flows. To this end, in addition to assessing whether the standard errorson predictor variables are lower in the case of a more powerful model (and, consequently, whether the t-statistics are higher), the following criteria are also evaluated:
whether the model results in reasonable signs for coefficients, e.g. that there is a positive sign for current receivables in the prediction of one year ahead operating cash flow, given that an increase in customer receivables in the present year would be consistent with an increase in cash from customers in the following year;
whether financial statement items that incorporate both cash and accrual information make a higher contribution to prediction (i.e. they are more significant and larger) than those which are either just cash amounts or accrual amounts, e.g. as the sales figure contains both cash and accrual information, sales may be expected to contribute more to cash flow prediction than receivables, which is based just on accrual information.
5
As a second step, if a model based on double entry constrained SUR can be identified as a superior cash flow prediction model in line with the above, then it is argued here that its demonstrated accounting validity should support the use of such a model in the prediction of future earnings. In this respect, therefore, the aim of the second part of this thesis is to compare the explanatory power of cash flows, accruals and changes in equities in the prediction of future income components, which in this case are simply the future operating income and the future non-operating income.
The motivation for the second part of the thesis is to attempt to unravel the confusion relating to the relative power of accrual versus cash flow predictors, where the emphasis appears either to be on the relative strength of accrual information (e.g.Chan et al. (2004)) or on the greater predictive power of cash flow information (Arthur et al. (2010) and Sloan (1996)). The results reported in this thesis suggest that, using two simultaneous equations based on the accounting identities for operating and non-operating income, together with double entry constraints on the predictor variables, cash flow items prove to be significantly more powerful in predicting future earnings than accruals and changes in equities. Finally, a qualitative assessment is carried out of low and high reliability accruals in order to assess their predictive ability with respect to future earnings. Prior work by Lev and Sougiannis (1996) and Richardson et al. (2005) suggests that accruals which are less reliable in terms of the greater managerial discretion that they afford are expected to be more relevant and similarly that accruals which are more reliable, and thus offering less managerial discretion, will be less relevant.
6
However, contrary to the work of Richardson et al. (2005), the results presented here show that, by using the modelling framework that is built up in the first and second parts of this thesis, lower (higher) reliability accruals make a stronger (weaker) contribution to explaining future income, a finding which offers further insights into the trade-off between the reliability and relevance of accruals.
These issues can be summarized in the following three research questions that guide this thesis:
1. Does imposing the double entry constraint on accounting variables improve the usefulness of the model by comparison with other models that are unconstrained?
And, with respect to one of the key unresolved issues in accounting research:
2. Do cash flow variables estimate future income better than accruals?
And, from a qualitative viewpoint:
3. Are accruals with a high propensity to manipulation (low reliability accruals) associated with a higher degree of explanatory power and predictive ability in the prediction of future earnings by comparison with more reliable accruals?
With this in mind, and before moving to the second chapter, it is worth emphasising that the approach taken in this thesis attempts to draw together into the prediction model all accounting variables that are reported as financial statement line items, specifically in the opening and closing balance sheets, the income statement and, by a process of deduction, the reconciling cash flow
7
statement. The comprehensive financial package is presented for the average company - i.e. averaged over 21,698 firm-year observations relating to US companies - in Tables 1-1, 1-2 and 1-3.
It should be noted that accounting data downloaded for this purpose are always reported without sign. This implies a positive sign for assets as well as for liabilities, for instance, with a negative sign being given in the source database when a balance falls for some reason below zero, whether it is an asset line item that is reported as a net liability or a liability line item that is reported as a net asset. Therefore, in order to operationalise the double entry system among the financial statement variables, appropriate signs have to be imposed on the variables based on whether they arise from debit or credit entries in accounting journals. In the above case, for example, it might be natural for assets (debit balances) to be presented as positives, and for liabilities (credit balances) to be presented as negatives. Therefore an increase in debit items (increasing assets) takes the positive sign, and an increase in credit items (increasing liabilities or equities) takes the negative. Similarly, a decrease in debit items (decreasing assets) takes the negative sign, and a decrease in credit items (decreasing liabilities or equities) takes the positive. The result of imposing the signs on the complete set of accounting variables in this way is that the summation of all accounting variables in each financial statement is equal to zero, and it follows that the summation of the full set of accounting variables is equal to zero. In the following chapters, this issue will be explained in greater detail, and the following tables provide some initial intuition regarding the structural approach that is adopted for this research study.
8
Table 1-1 Balance sheet changes for the average company
This table shows the arithmetic average of the change in each balance sheet line item across 21,698 firm-year observations, for all US firms covered by the WorldScope database. The table includes all balance sheet line items reported by Worldscope, with two items in the standard WorldScope balance sheet (Deferred tax in untaxed reserves and Non-equity reserves) not being applicable in the USA, and therefore shown as zero below. The variable abbreviations used in this thesis are given in the third column. The sum of changes in all balance sheet is shown to be exactly zero at the foot of this table.
B ala nc e s he et Curr en t a ss ets
ΔCSI Δ Cash and short-term
investments 6,305,885.96
ΔARE Δ Accounts receivable 6,705,832.30
ΔINV Δ Total inventory 4,688,963.84
ΔPRE Δ Prepaid expenses 250,598.04
ΔOCA Δ Other current assets 1,666,743.98
ΔTCA Δ Total current assets 19,618,024.12
Lon g-te rm as se ts ΔLTR Δ Long-term receivables 737,382.53
ΔIUS Δ Investment in unconsolidated
subsidiaries 623,114.72
ΔOIN Δ Other investments 812,611.89
ΔPPE Δ Property plant and equipment 7,235,843.45
ΔOLA Δ Other long-term assets 9,523,992.69
ΔTLA Δ Total long term assets 18,932,945.28
ΔTA Δ Total assets 38,550,969.40 Curr en t lia bil itie s
ΔAPA Δ Accounts payable -3,691,604.05
ΔSTD Δ Short-term debt -2,841,324.27
ΔACP Δ Accrued payroll -1,214,710.19
ΔITP Δ Income tax payable -8,043.11
ΔDPA Δ Dividend payable -60,446.76
ΔOCL Δ Other current liabilities -4,439,444.67
ΔTCL Δ Total current liabilities -12,255,573.05
Lon g-te rm lia bil itie s ΔLTD Δ Long-term debt -7,240,398.80
ΔPRC Δ Provision for risks and charges -1,859,375.58
ΔDIN Δ Deferred income -778,768.71
ΔDTX Δ Deferred tax 514,122.94
ΔDTU Δ Deferred tax in untaxed reserves 0.00
ΔOLL Δ Other long-term liabilities -1,962,689.07
ΔTLL Δ Total long-term liabilities -11,327,109.22
Δ TL Δ Total liabilities -23,582,682.27
Eq
uitie
s
ΔSEQ Δ Shareholders’ equity -9,685,539.31
ΔPST Δ Preferred stock -4,928,679.83
ΔNER Δ Non-equity reserves 0.00
ΔMIN Δ Minority interest in net assets -354,067.99
ΔTEQ Δ Total equity -14,968,287.13
ΔTLE Δ Total liabilities and equity -38,550,969.40
9
Table 1-2 Income statement for the average company
This table shows the arithmetic average of each income statement line item across 21,698 firm-year observations, for all US firms covered by the WorldScope database. The table includes all income statement line items reported by Worldscope, with five lines in the standard WorldScope income statement (Allocation from (to) reserves, Pre-tax equity interest earnings, Interest capitalized, Other after-tax income (expense) and Extraordinary items & gain (loss) on sale of assets) not being applicable in the USA, and therefore shown as zero below. The variable abbreviations used in this thesis are given in the third column. The sum of the income statement variables including Net income is shown to be exactly zero at the foot of this table.
Income sta te me nt Op er atin g in come SAL Sales -440,982,275.27
CGS Cost of goods sold 283,079,122.56
DDA Depreciation, depletion and
amortization 16,203,502.65
GRI Gross income -141,699,650.06
SAE Selling and administrative expenses# 94,054,625.03
OOE Other operating expense# 5,052,213.55
TOE Total operating expenses# 99,106,838.58
OPI Operating income -42,592,811.48
N on -ope ra tin g in come
ECR Extraordinary credits -532,418.19
ECH Extraordinary charges 7,289,417.84
IIN Interest income -2,112,771.27
RES Allocation from (to) reserves 0.00
PEI Pre-tax equity interest earnings 0.00
OIE Other (income) expense – net -1,150,500.56
EBIT Earnings before interest & taxes -39,099,083.66
IED Interest expense on debt 4,987,181.04
ICP Interest capitalized 0.00
PTI Pre-tax income -34,111,902.62
ITX Income taxes 13,040,134.49
MIE Minority interest in earnings 327,962.93
EIE Equity interest earnings -797,967.59
OIA Other income (expense)-after tax 0.00
DOP Discontinued operations 62,296.40
NIE Net income before extraordinary items -21,479,476.39
EGL Extraordinary items & gain (loss) on
sale of assets 0.00
NI Net income (before preferred
dividends) 21,479,476.40
10 Table 1-3 Cash flow statement for the average company
This table shows the arithmetic average of each of the cash flow statement variables used in this thesis, across the 21,698 firm-year observations for US firms that are the source for Tables 1-1 and 1-2 above. The variables included below are computed by deduction from the related income statement items and balance sheet changes, as described in greater detail in the thesis, and therefore do not take account of the amounts attributable to factors such as structural change (e.g. mergers, discontinued operations, etc.) that are normally offset in reported cash flow statements. The variable abbreviations used in this thesis are given in the third column. The sum of the cash flow statement variables (and hence the sum of the cash flows: Operating cash flow OCF, Investing cash flow ICF and Financing cash flow FCF) is shown to be exactly zero at the foot of this table.
Ca sh fl ow sta te me nt Op er atin g
REC Customer receipts -434,276,442.97
PAY Supplier payments 376,916,397.19
OOC Other operating cash flow 17,954,844.84
TXP Tax payments and provision
settlements 11,686,838.74
ECF Exceptional cash flow 12,432,131.52
OCF Operating cash flow -15,286,230.68
Inve
stin
g
CED Capital expenditure (net of asset
disposals) 9,408,952.59
ICF Investing cash flow 9,408,952.59
Fin
an
cin
g
DIR Debt issues (net of debt
repayments) -901,427.34
NCD New capital (net of dividends) 6,778,705.44
FCF Financing cash flow 5,877,278.10
11
CHAPTER 2- FINANCIAL STATEMENT
ARTICULATION AND THE PREDICTION OF
12
CHAPTER 2: Financial statement articulation and the prediction of
cash flows and earnings
This chapter sets out the background to the present thesis, and considers the following: (i) the concept of financial statement articulation, and its development in prior studies; (ii) the nature of accounting-based models that are used in the prediction of future cash flows and future earnings, and the role of articulated accruals in these prediction models; and (iii) recent work on the reliability of accruals and its consequences for accounting-based predictions when financial statement articulation is taken into account.
2-1 Financial statement articulation
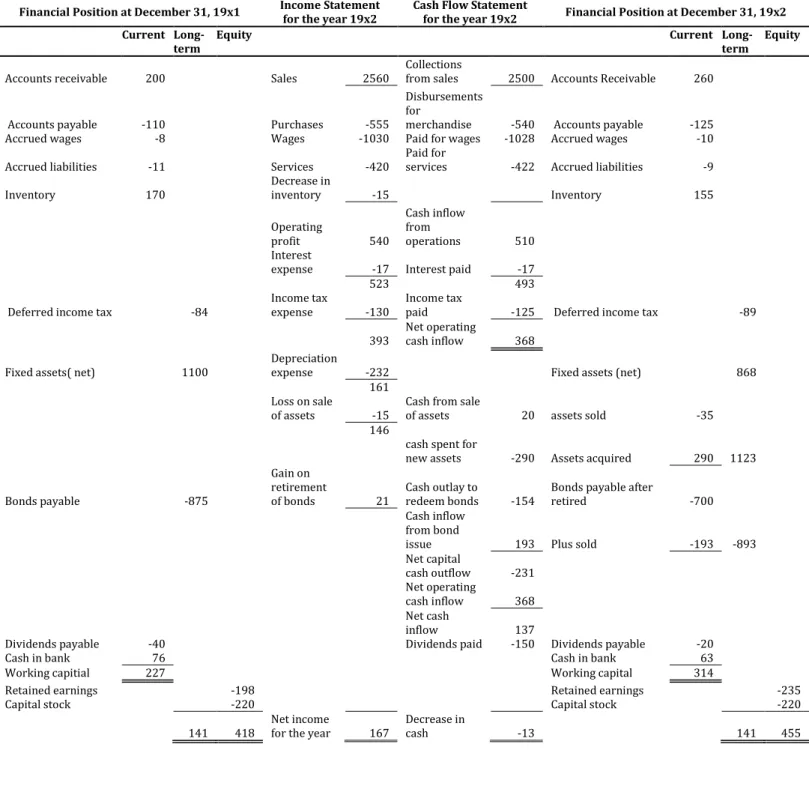
The notion of ‘articulation’ in financial statements as employed in this thesis is explained clearly in the work of Mann (1984). In that study, which is normative, a worksheet is presented that demonstrates the articulating identities governing the basic financial statements, mainly with a view to bringing about a better understanding of the linkages between the beginning and ending balance sheets, the income statement and the cash flow statement. Indeed, the specific concern of Mann’s study is to facilitate our appreciation of the effects of transactions on the financial statement identities of an entity, and this is done by way of a simple case study.
13
The worksheet prepared by Mann (1984) relates to an example company ABC, and is presented below in Table 2-1 This provides a useful starting point for
Table 2-1 Articulation among the financial statements – Mann (1984)
ABC Co. Financial Statement Data
Financial Position at December 31, 19x1 Income Statement for the year 19x2 Cash Flow Statement for the year 19x2 Financial Position at December 31, 19x2
Current
Long-term Equity Current Long-term Equity
Accounts receivable 200 Sales 2560 Collections from sales 2500 Accounts Receivable 260
Accounts payable -110 Purchases -555
Disbursements for
merchandise -540 Accounts payable -125 Accrued wages -8 Wages -1030 Paid for wages -1028 Accrued wages -10 Accrued liabilities -11 Services -420 Paid for services -422 Accrued liabilities -9 Inventory 170 Decrease in inventory -15 Inventory 155
Operating profit 540 Cash inflow from operations 510 Interest
expense -17 Interest paid -17
523 493
Deferred income tax -84 Income tax expense -130 Income tax paid -125 Deferred income tax -89 393 Net operating cash inflow 368
Fixed assets( net) 1100 Depreciation expense -232 Fixed assets (net) 868 161
Loss on sale
of assets -15 Cash from sale of assets 20 assets sold -35 146
cash spent for
new assets -290 Assets acquired 290 1123 Bonds payable -875
Gain on retirement
of bonds 21 Cash outlay to redeem bonds -154 Bonds payable after retired -700 Cash inflow
from bond
issue 193 Plus sold -193 -893 Net capital cash outflow -231 Net operating cash inflow 368 Net cash inflow 137
Dividends payable -40 Dividends paid -150 Dividends payable -20
Cash in bank 76 Cash in bank 63
Working capitial 227 Working capital 314
Retained earnings -198
Retained earnings -235
Capital stock -220 Capital stock -220
14
this thesis, as it shows the rudimentary structural framework that will be developed in later chapters in order to impose articulation among the basic financial statements on the type of data that is available in large scale accounting datasets. In fact, it will be seen that this thesis develops such a structural framework on a larger scale than the outline presented in Mann (1984), incorporating every available accounting line item in one of the commercial financial datasets that is regularly employed in academic research (i.e. WorldScope), using observations for all of the US corporations that are covered by that database.
Each accounting line item in Table 2.1 is presented as a clean surplus articulation, whereby the change in the relevant balance sheet lines plus the related income statement entry reconciles to the cash flow statement entry. Nevertheless, it is evident that the signs (+ or -) on these variables are implicit and the informed reader will only become aware of these through an accounting understanding. A further point to consider is that, for each financial statement in this matrix-based worksheet, the sum of all variables is equal to zero, but this again is implicit in the presentation and requires an accounting understanding in order to fully appreciate that, appropriately signed, the sum of the entire matrix is itself zero.
In Table 2.2, which is based on Table 2.1 (with the opening and closing balance sheets rearranged to show the change during the year, and with subtotals deleted), Mann’s illustrative example is reworked in order to demonstrate how such a matrix may be appropriately signed in a way that is consistent with the
15
underlying accounting identities. For instance, an increase in an item in the balance sheet such as Accounts receivable is presented here with a positive sign (+), and Sales in the income statement with negative sign (-), and the implied cash receipt from customers equal to the sum of these two being given a negative sign (-). By the same logic, an increase in Accounts payable is presented here with a negative sign (-) and Purchases in the income statement with positive sign (+), again with the sum of these two equalling the implied cash payment to suppliers, which thus takes the positive sign (+). Following Christodoulou and McLeay (2010), this thesis refers to the imposition of sign in this way (i.e. so that the overall accounting identity is a ‘clearing identity’ that sums to zero) as the ‘double entry condition’, as it is the fact that every transaction has a debit and a credit entry that leads to the zero sum.
Table 2-2 Articulation among the financial statements - appropriately signed
Balance Sheet change + Income Statement = Cash Flow Statement Assets (+) Liabilities (-) Expenses (+) Revenues (-) Profit (+) Loss (-)
Balance Sheet Income Statement Cash Flow Statement
Variables Opening Closing Change
Accounts receivable 200 260 60 Sales -2560 = Collections from sales -2500 Accounts payable -110 -125 -15 Purchases 555 = Disbursements 540 Inventory 170 155 -15 Decrease in inventory 15
Accrued wages -8 -10 -2 Wages 1030 = Paid for wages 1028
Accrued liabilities -11 -9 2 Services 420 = Paid for services 422 Deferred income tax -84 -89 -5 Income tax expense 130 = Income tax paid 125 Fixed assets(net) 1100 1123 23 Depreciation expense 232 = Cash from sale of assets -20 Loss on sale of assets 15 Cash spent for new assets 290 Bonds payable -875 -893 -18 Gain on retirement of bonds -21 = Cash outlay to redeem bonds 154 Interest expense 17 Cash inflow from bond issue -193
Interest paid 17
Dividends payable -40 -20 20 Net income (loss) for the year -167 = Dividends paid 150 Retained earnings -198 -235 -37
Capital stock -220 -220 0
Cash in bank 76 63 -13 Decrease in cash 13
16
Although Mann’s case study illustration in The Accounting Review is primarily a teaching note, it nevertheless reflects some of the key ideas in accounting to be found in the influential theoretical works of the time, such as Charnes, Cooper and Ijiri (1963), and which have continued to be debated in subsequent discussion papers, e.g. Arya, Fellingham, Glover, Schroeder and Strang (2000) and Demski, Fitzgerald, Ijiri and Lin (2006).
Indeed an early attempt to explore financial statement articulation was through a linear programming application, in the Charnes et al. (1963) paper cited above. A set of constraints is employed in that study in order to show the articulation of accounting variables using the duality specification of debit and credit. The figure below demonstrates the view of these authors regarding the way in which transactions are recorded in two (or more) accounts and how this underlies their articulation application:
17
Figure 2-1 Association between financial variables
Source -Charnes et al. (1963)
The lines connecting the above variables indicate the accounting entries, where the two-letter suffix to each double entry ‘x’ represents the account debited (first letter of the suffix) and then the account credited (second letter). For instance, the line between Cash (C) and Raw Material (R) is specified as , which signifies purchasing materials with cash, thus increasing Raw material (R) and decreasing Cash (C). The other double entries in this figure are given below:
18
– Purchasing other goods with cash: debit Goods (G), credit Cash (C)
– Selling the company’s products for cash: debit Cash (C), credit Sales (S)
– Using raw materials increases the cost of goods sold: debit Sales (S), credit Raw material (R)
- Using other goods also increases the cost of goods sold: debit Sales (S),
credit Goods (G)
– Withdrawals by owner – debit Net worth (E), credit Cash (C)
– Adding the year’s net profit to equity – debit sales (S), credit Net worth (E)
Structurally the above can also be expressed using a number of constraint equations in the form of zero sum ‘clearing identities’, as follows
It can be seen, in this extract from their work, how Charnes et al. (1963) employ the structural articulation framework to describe a small set of conventional accounting variables, specifying their constraint equations on the basis of the double entry condition. Later in this thesis, it will be shown how these
19
‘clearing identities’ set to zero may be developed to describe each financial statement, and indeed the entire set of financial statements.
The above study only briefly examines some of the possible relations between mathematics and double entry. In another paper, Ellerman (1985) extends further the mathematics of the conventional accounting equation with respect to the duality principle of the double entry system. He notes that double entry bookkeeping is based on the construction of integers (positive and negative) as equivalence classes of ordered pairs of natural numbers. The ordered pairs of this construction correspond to the T-accounts of double entry bookkeeping. The left-hand entry in the ordered pair corresponds to the debit side of the T-account, and the right-hand entry to the credit side. Following Ellerman’s specifications, the notation [x//y] will be used for a debit entry of x and a credit entry of y, as follows
Since the label ‘T-account’ will be used later in a specific accounting context, the general ordered pairs [x//y] will be called T-terms; also, a T-term equal to the zero T-term [0//0] will be called a zero-term.
For example, [x//x] is a zero-term even when x is nonzero. That is, for any nonnegative numbers w and y,
20
if and only if
In more general terms, given any equation where all numbers are nonnegative such as , which represents n transactions, we encode each left-hand-side item as a debitT-term, such as [w//O], and we encode each right-hand-side item as a credit T-term, such as [O//y]. Then the original equation holds if and only if the sum of the encoded T-terms is a zero-term, i.e.
if and only if
is a zero-term.
This translation or encoding of equations into zero-terms works even if the original equation contains negative numbers since any equation can be transformed to one in which all of the terms are positive by transferring the negative numbers to the other side.
21
Another relevant aspect of double entry bookkeeping is that transactions must be recorded in a way that maintains the integrity of the governing accounting identities that describe the financial statements, such as, for example, the balance sheet equation
That is, transactions must be recorded as valid algebraic operations which maintain this identity. As mentioned before, such an identity can be rearranged into a zero-term as:
A further issue, which concerns the way in which accounting numbers are appropriately signed, is explored in Arya et al. (2000). The main aim of their study is to embed the double entry accounting structure in a matrix representing all of the firm’s transactions. In a first step, a linear algebraic representation of the accounting process is constructed in order to specify a double entry matrix that transforms the large number of transactions into a small number of account balances. An example may be given supposing that a firm undertakes the following seven transactions:
22
A. Purchase inventory for cash B. Plant acquisition for cash C. Cash expenses
D. Cash sales
E. Cost of goods sold
F. Depreciation (product cost) G. Depreciation (period cost)
The core of the linear representation of this double entry system is a transformation matrix with m rows and n columns, where m is the number of accounts and n is the number of transactions. Similar accounting transactions aggregate so that m<n. Two non-zero entries are made in each column, which denote the accounts that are ‘connected’ by the transaction journal entry, using the following sign convention: debits to an account are denoted by +1, and credits are denoted by −1. For the above example, we have
For example, the cash sales entry in column D is shown above with a negative sign for sales (-1), as it is credited, and a positive sign for cash (+1), as it is debited. Later in this thesis, consistent with Arya et al (2000), all of the debit items are denoted by +1 and all of the credit items are denoted by -1, whether their aggregations remain in the balance sheet or are taken to the income statement.
23
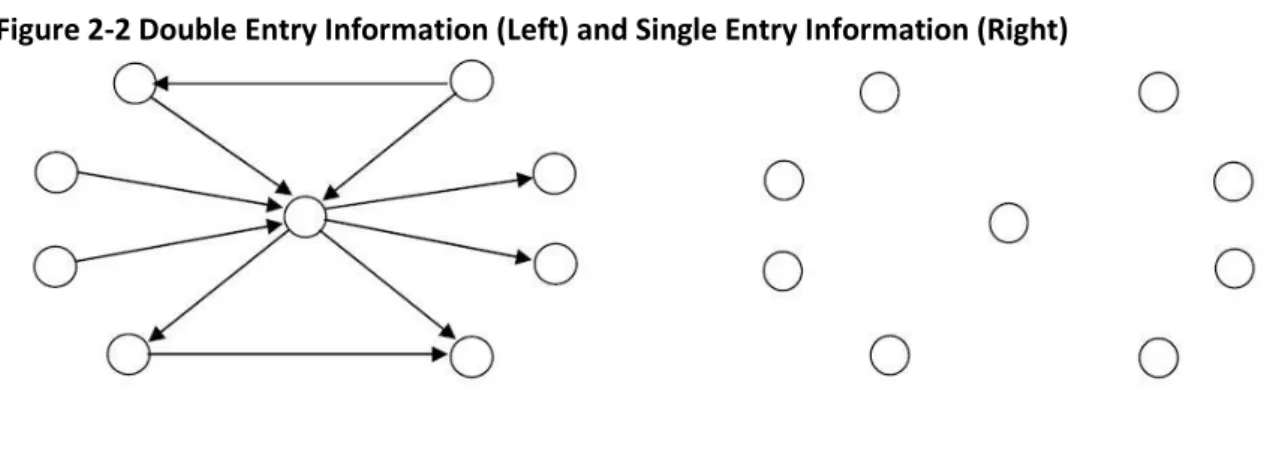
Another issue concerning the articulation of financial statements has been raised by Demski et al. (2006) . Their study reinforces the importance of the double entry condition and, hence, the duality of accounting variables by comparing ‘double entry’ information with ‘single-entry’ information. They suggest that the difference lies in the ‘connectivity’ of information. For example, imagine that a firm finds an extra $10,000 of cash in the safe. As the authors comment in an aside, for anyone else this is good news, but not for accountants! Accountants cannot record the event until they find a reason why the cash increases. Indeed, ‘single entry’ merely records what happened but not why, and this is the importance of the ‘double entry’ system. In the latter case, the record of what happened in the firm (Dr/Cr) always has to be the reflection of why these things happened (Cr / Dr).
Figure 2-2 Double Entry Information (Left) and Single Entry Information (Right)
Source - Demski et al. (2006)
Connectivity is based on the accountant’s judgment regarding causality. As shown in the left hand graph of Figure 2-2, if the circle in the centre represents cash, and an arrow into the circle represents an increase in cash and an arrow from
24
the circle represents a decrease in cash, the cash circle at the centre is always connected for any transaction to one of the four circles with arrows pointing inwards. This is not the case for the single entry diagram on the right.
In the second part of their study, Demski et al. (2006) introduce two important rules about the articulation of financial statements:
Rule 1: Beginning balances + Increases = Decreases + Ending balances
Rule 2: A change in an account cannot occur without causing a corresponding change in another account, thereby allowing the inference to jump from one account to another in the network of accounts
They point out in this context that any missing accounting number can be found by deduction using Rule 1 if three of the four numbers are already known. Note that the inference here need not stop at the first account. Having found the missing fourth number, this may make it possible for the inferential process to continue with another account, and a domino-like effect will result from combining Rules 1 and 2. For example, if say an inventory account has only two known numbers, a beginning balance and an ending balance, then as soon as an entry for the transfer out to cost of goods is recorded (i.e. a decrease), the fourth number, which in this case would be the purchases of inventory (an increase), can be deduced using Rule 1. When the purchase is entered on the debit side of the inventory account, the same amount must be entered on the credit side of accounts payable, thereby creating a chain reaction. Again, this principle, expounded in the context of double entry transaction accounting, is taken up later in this thesis with
25
respect to the periodic aggregates when we consider the full articulation of each financial statement.
In addition to the above issues concerning articulation, a relevant question is asked by Bahnson et al. (1996) as to whether or not financial statements actually articulate in practice. They believe that many balance sheets and cash flow statements are not articulated, in the sense that the change in current assets and liabilities in the opening and closing balance sheets seems often to be reported in cash flow statements at substantially different amounts. The findings, based on nearly 10,000 financial statements, reveal many unexplained differences between the calculated operating cash flow based on the articulation of balance sheets and income statements and the amounts actually disclosed in cash flow statements. They find that about 25 percent of the data points show small differences between the reported cash flow and the articulated cash flow, within the range from -3% to +3% of the reported cash flow. The more material differences are symmetrically distributed above or below the reported cash flow, with about 17 per cent recording a difference whose absolute value exceeds reported cash flow by 100% or more. The rest of the data points, about 58 percent of observations, lie between ±3% and ± 100% difference between reported and articulated cash flow. Their examination of company reports in these cases reveals that the companies generally fail to provide sufficient information in the annual report to fully explain the causes of all the non-articulated differences. Nevertheless, the research shows that, in some situations, reasons for significant non-articulated differences can be identified. For example, one annual report describes the management's decision to reclassify certain plant and equipment as a current asset in anticipation of disposal
26
in the next year. Other examples include disclosure of the management's decision to reclassify a part of the company's inventory as a long-term asset because it is being used to demonstrate the company's products, or the unusual issuance of equity shares to settle a significant portion of accounts payable. In this thesis, the large scale empirical work does not permit examination of reports in such detail, and the articulations that are imposed on the data in constructing the models described later will necessarily be measured with error in this respect, as illustrated here. However, an important insight in Bahnson et al. (1996) is that such articulation differences are distributed symmetrically, and hence are unbiased.
The final study in this area that informs the approach to financial statement articulation in this thesis is the work of Christodoulou and McLeay (2010). The key proposition of this paper lies in the treatment of financial statements as a matrix of codetermined information bounded by the double entry constraint. This again raises the issue of appropriate signing of accounting variables. In the study by Christodoulou and McLeay (2010), items that add to the accrual are deemed to take a positive sign and those that reduce the accrual a negative sign. Therefore, purchases and other expenses are positive under this system, and cash payments to suppliers are negative. In bookkeeping terms, the source entries in this case are debits [+] to the purchases account and credits [–] to the cash account respectively. It follows that sales revenues take a negative sign whilst cash receipts from customers are positive. For those accounts that are not totals of similar transactions, but instead offset debit and credit items, a net balance is reported. For example, debt issued is positive and debt repaid negative, and therefore the
27
net financial flow is positive if debt issues exceed debt repayments and negative if more debt is retired than raised. Similarly, when new contributions of equity capital exceed distributions, the net dividend takes a positive sign, and vice versa when there is a net return to the shareholders. Any addition to equity capital by way of profit also takes a positive sign, whilst a loss is negative.
This signing of accounting variables must be made explicit in any accounting identity, such as the cash flow equation that describes the cash flow statement, and the earnings equation that describes the income statement. Each of these two accounting identities is represented by seven variables in Christodoulou and McLeay (2010). As mentioned, the sign either is known or, as in the case of net balances, there is no fixed sign. The accounting identities are expressed as clearing identities that sum to zero in a similar way to Charnes et al. (1963), leading to the following representation where the implicit sign can be seen below each equation in the accounting logic that follows the Cr and Dr entries that make up each accounting variable:
28
Figure 2-3 Double entry equilibrium
Source- Christodoulou and McLeay (2010)
Accruals may be defined on the basis of the operating components of the above accounting identities. That is to say, accruals will include the increase in trade creditor accounts when purchases PUR exceed supplier payments PAY and the increase in other operating liabilities when provision recognitions net of cancellations PRO exceed provision settlements net of reimbursements SET, less any increase in the trade debtor accounts when the sales revenues SAL exceed the receipts from customers REC, together with the depreciation charge DEP. Christodoulou and McLeay (2010) refer to the aggregation of these variables as the ‘operating function of accruals’, OPAC:
29
Operating function of accruals
The remaining components of the cash flow and earnings identities include the changes to the equity holders’ position in the form of earnings EAR and net dividends NDV, the changes to the debt holders’ position arising from net financing flows NFF and interest charges INT, and changes to the fiscal position attributable to tax charges TXC and tax payments TXP. Together with net capital expenditure NCE, Christodoulou and McLeay (2010) refer to this identity that brings together all of the earnings and cash flow variables that are not contributing to the operating function of accruals as the ‘financing and investment function of accruals’, FIAC:
Financing-investment function of accruals
It follows therefore, for articulated financial statements, where the cash flow and earnings identities must sum to zero, that double entry bookkeeping ensures that the operating accruals OPAC is identical to the financing-investment accruals FIAC, but with opposite sign, i.e. the equilibrium condition must hold. Using a similarly cohesive structural framework, the present thesis builds on this approach by rearranging the accounting identity functions in order to predict future cash flows and future earnings, rather than to obtain estimates of accruals.
In fact, a principal difference between this thesis and the work of Christodoulou and McLeay (2010) concerns the variables that are estimated. In the
30
work of Christodoulou and McLeay (2010), a structural model is applied to the estimation of the equilibrium level of ‘accruals’ that is achieved through the imposition of the double entry constraint over estimation. Their study uses the reconciliation of financial statements to demonstrate how accruals are codetermined by two basic intra-firm functions, namely the operating function and the investment financing-function, which are defined by the cash flow identity and the earnings identity. The equilibrium level can be represented through the equation below:
However the first part of this thesis considers the prediction of three components of cash flow(operating, investing and financing cash flows) based on the accounting identities governing each of the three components involved. The predictor variables in the cash flow forecast are the revenue and cost items in the income statement, the balance sheet changes that make up the total accrual, and the changes in the components of shareholders’ equity. The equilibrium level can be presented as below:
Moreover, in addition to above difference, by using the above constraint, the aim of the second part of this thesis is to compare the explanatory power of cash flows, accruals and changes in equities in the prediction of future income
components, which in this case are simply the future operating income and the future non-operating income. It should be noted that this issue has not been investigated in the work of Christodoulou and McLeay (2010).
31
As another less important difference, the number of the variables that has been used in the work of Christodoulou and McLeay (2010) is 14 variables for both operating and financing accruals. They worked mainly with aggregated variables; for instance, they have one variable representing Current assets (CA). However, in this thesis, consistent with the works of Basu (1999), Jordan and Waldron (2001) and Fischer et al. (2008), which all find the same result with respect to disaggregated models (suggesting therefore that articulation through disaggregation is superior to the use of more parsimonious aggregated models in terms of explanatory power), the models will be presented at the most disaggregated level possible; for instance, Current assets (CA) is divided here into five components, namely Cash and short-term investments (CSI), Accounts receivable (ARE), Total inventory (INV), Prepaid expenses (PRE), and Other current assets (OCA).
It follows that the present study aims to further develop research design in this area, using a more advanced level of financial statement articulation than Christodoulou and McLeay (2010), based on all line-items in the income statement, the cash flow statement and the opening and closing balance sheets available in the data source that is used (Worldscope). By implication, a more comprehensive definition and categorization of accruals is used in this thesis, as the complete set of financial statement items is employed both in the prediction of future cash flows and the prediction of future earnings, and, in the latter case, in evaluating the reliability of accruals in such prediction. Indeed, the third part of this thesis approaches this last issue from a qualitative viewpoint, attempting to answer the question as to whether accruals with a high propensity to manipulation (low
32
reliability accruals) are associated with a higher degree of explanatory power and predictive ability in the forecasting of future earnings by comparison with more reliable accruals. It should be noted that this issue also has not been evaluated in Christodoulou and McLeay (2010).
A final difference between this thesis and the work of Christodoulou and McLeay (2010) is the issue of appropriately signing the variables. As mentioned in their paper, items that add to the accrual are deemed to take a positive sign and those that reduce the accrual a negative sign and consequently assets are shown with the negative sign and liabilities are shown with the positive sign. However, in this study, an increase in an item in the balance sheet such as Accounts receivable (ARE) is presented here with a positive sign (+), and Sales (SAL) in the income statement with negative sign (-), and the implied Cash receipt from customers (REC) equal to the sum of these two being given a negative sign (-). By the same logic, an increase in Accounts payable (APA) is presented here with a negative sign (-) and Purchases (PUR) in the income statement with positive sign (+), again with the sum of these two equalling the implied Cash payment to suppliers (PAY), which thus takes positive sign (+). Therefore in this thesis, for variables in both balance sheet and income statement, any debit variable or increase in debit variable will take the positive sign (+) and consequently any credit variable or increase in credit variable will take a negative sign (-). Thus, the sign of the variables in the cash flow statement depends on the relative magnitude of the debit and credit variables in the other two statements (balance sheet and income statement) from which the cash flow statement variables are derived. This issue will be explained in greater detail in Tables 3-6 and 4-1.
33
Policy issues and implications for research design
The issue of financial statement articulation, which is central to this thesis, has been addressed as a policy issue by the main body representing financial analysts, the CFA, in pursuing their view that the current conceptual framework of accounting needs to be refined CFA (2005). An update to the conceptual framework is already under way on an international scale, in the form of a joint project by the Financial Accounting Standards Board (FASB) and the International Accounting Standards Board (IASB). In the view of the financial analysts, one of the most controversial issues concerns the inconsistent pattern of aggregation and netting of items in financial statements, along with their obscured, even opaque, articulation, which analysts consider as a barrier to efficient analysis in forming what is described as nothing more than “a best guess” (CFA, 2005, p5) . The same discussion document offers twelve suggestions in order to improve the quality of financial statements, which are summarised below in Table 2-3.