econ
stor
www.econstor.eu
Der Open-Access-Publikationsserver der ZBW – Leibniz-Informationszentrum Wirtschaft The Open Access Publication Server of the ZBW – Leibniz Information Centre for EconomicsNutzungsbedingungen:
Die ZBW räumt Ihnen als Nutzerin/Nutzer das unentgeltliche, räumlich unbeschränkte und zeitlich auf die Dauer des Schutzrechts beschränkte einfache Recht ein, das ausgewählte Werk im Rahmen der unter
→ http://www.econstor.eu/dspace/Nutzungsbedingungen nachzulesenden vollständigen Nutzungsbedingungen zu vervielfältigen, mit denen die Nutzerin/der Nutzer sich durch die erste Nutzung einverstanden erklärt.
Terms of use:
The ZBW grants you, the user, the non-exclusive right to use the selected work free of charge, territorially unrestricted and within the time limit of the term of the property rights according to the terms specified at
→ http://www.econstor.eu/dspace/Nutzungsbedingungen By the first use of the selected work the user agrees and declares to comply with these terms of use.
zbw
Leibniz-Informationszentrum WirtschaftMarin, Dalia
Working Paper
The opening up of eastern Europe at 20 - jobs, skills,
and "reverse maquiladoras" in Austria and Germany
Bruegel Working Paper, No. 2010/02
Provided in Cooperation with:
Bruegel, Brussels
Suggested Citation: Marin, Dalia (2010) : The opening up of eastern Europe at 20 - jobs, skills, and "reverse maquiladoras" in Austria and Germany, Bruegel Working Paper, No. 2010/02
This Version is available at: http://hdl.handle.net/10419/77990
THE OPENING UP OF
EASTERN EUROPE AT
20 – JOBS, SKILLS,
AND ‘REVERSE
MAQUILADORAS’ IN
AUSTRIA AND GERMANY
DALIA MARIN*
Highlights
• There were fears in the European Union that eastern enlargement would lead to major job losses and transfers. More recently, these fears have extended to high-skilled and IT jobs. This paper examines using unique firm-level data if these fears are justified for Austria and Germany.
• We find that eastern enlargement has led to job losses of less than 0.5 percent of total employment in Germany and of 1.5 percent in Austria. Low-cost jobs in affiliates in eastern Europe help Austrian and German firms stay competitive in an increasingly competitive environment. However, we also find that multinational firms in Austria and Germany are outsourcing skill-intensive activities to
eastern Europe, taking advantage of cheap and abundant skilled labour there. This is a response to a human capital scarcity in Austria and Germany, which became particularly severe in the 1990s.
• We find a reverse pattern of ‘maquiladoras’ (a phenomenon seen in the United States and Mexico) between Austria and Germany and their eastern neighbours. Skilled workers in Austria and Germany are losing out from outsourcing. In both countries, outsourcing contributes 35 percent and 41 percent, respectively, to changes in relative wages for skilled workers in Austria and Germany. To address the skill exodus to eastern Europe, we suggest liberalising the movement of high-skilled workers.
* Bruegel and the University of Munich.
B
R
UE
G
EL W
O
RKIN
G P
A
P
ER
2010/02
The opening up of eastern Europe at 20 - jobs, skills,
and ‘reverse maquiladoras’ in Austria and Germany
By Dalia Marin
University of Munich and Senior Fellow at Bruegel
1. Introduction
Many people in the European Union fear that eastern enlargement has led to major job losses in 'old' member states, particularly in Austria and Germany, as the two most im-portant neighbours of the countries that joined the EU in 2004 and 2007. More recently, in Germany, these fears about job losses to the accession countries have extended to high-skilled labour and IT jobs. German firms are seen to outsource the skill-intensive stages of production to eastern Europe leading to an exodus of firms and high-skilled jobs to eastern Europe. Are these fears justified?
To address these questions, this paper makes use of new survey data of 660 German and Austrian firms with 2,200 investment projects in eastern Europe during the period 1990-2001. The new survey data represent 100 percent of Austrian and 80 percent of German direct investment in eastern Europe.
This paper discusses three issues. First, I examine if eastern Europe has become a new member in the new international division of labour that has characterised the world economy in the last two decades. Is eastern Europe becoming an important location for firms’ international organisation of production (section 4)? Then I examine if an exodus of jobs to eastern Europe has in fact taken place. Has eastern enlargement encouraged the relocation of firms to eastern Europe substituting cheap east European workers for costly German or Austrian workers (section5)? Third, I look at if it is indeed the case that high-skilled jobs are moving to the east as is repeatedly argued in the press in Ger-many (section 6). Is a reverse pattern of ‘maquiladoras’ emerging after eastern enlarge-ment (section7)?. Lastly, I discuss some of the proposals to address the problem of firms’ outsourcing high-skilled labour. In particular, I show that subsidising research and development activity in Germany or Austria to prevent the exodus of high-skilled jobs to eastern Europe will exacerbate the problem. I then suggest immediate liberalisa-tion of the movement of skilled workers from eastern Europe to address the human capital crisis in Germany and Austria.
2. Trade and investment integration with eastern Europe
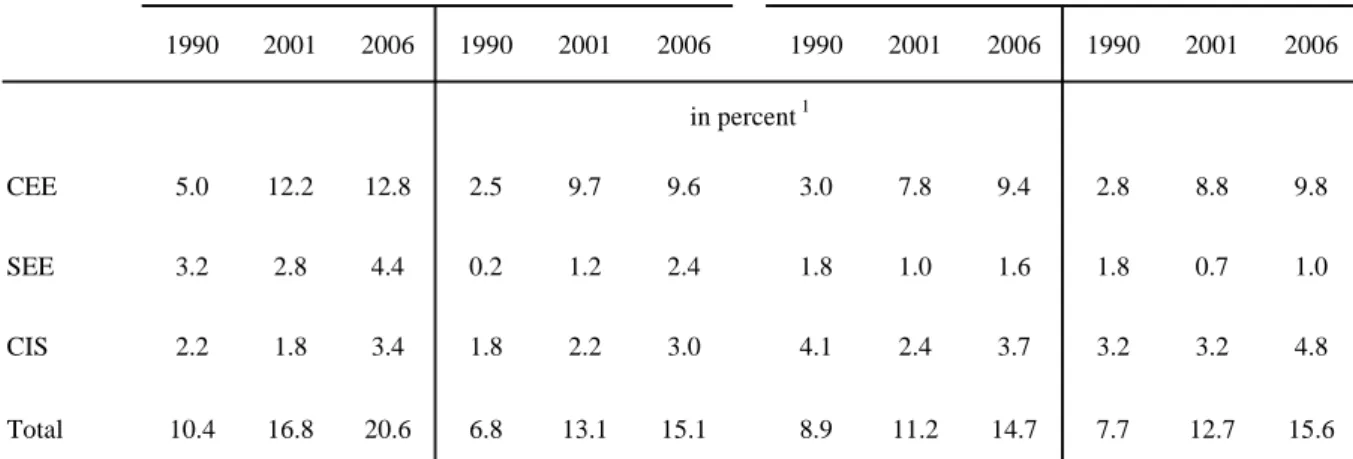
Since the fall of Communism, trade integration with eastern Europe has taken place at a fast pace in both Austria and Germany. In 2006, 14.7 percent of Germany’s and 20.6
percent of Austria’s exports went to eastern Europe and the CIS (Commonwealth of Independent States), and 15 percent of both countries' imports came from this region.
1990 2001 2006 1990 2001 2006 1990 2001 2006 1990 2001 2006 in percent 1 CEE 5.0 12.2 12.8 2.5 9.7 9.6 3.0 7.8 9.4 2.8 8.8 9.8 SEE 3.2 2.8 4.4 0.2 1.2 2.4 1.8 1.0 1.6 1.8 0.7 1.0 CIS 2.2 1.8 3.4 1.8 2.2 3.0 4.1 2.4 3.7 3.2 3.2 4.8 Total 10.4 16.8 20.6 6.8 13.1 15.1 8.9 11.2 14.7 7.7 12.7 15.6
Source: Statistik Austria, Statistisches Bundesamt
1
of total Austrian and German exports or imports, respectively
Export Share
Note: CEE includes Baltic States, Czech Republic, Hungary, Poland, Solvak Republic, and Slovenia; SEE includes Albania, Bosnia-Herzegovia, Bulgaria, Croatia, Macedonia, Romania, and Serbia; and CIS includes Armenia, Azerbaijan, Belarus, Georgia, Kazakhstan, Kyrgyzstan, Moldova, Russia, Taijkistan, Turkmenistan, Ukraine, and Uzbekistan.
Table 1. Trade Integration with Eastern Europe Austria
Import Share
Germany
Import Share Export Share
average average average average average average 1992-1994 2000-2002 2005-2007 2008 1992-1994 1999-2001 2005-2007 2008
FDI to EE in percent of total FDI 34.1 87.7 58.3 50.3 5.4 2.4 13.0 10.2
CEE 94.8 81.0 11.5 30.1 90.7 83.6 43.3 43.6 Czech Republic 29.0 16.7 12.1 10.3 32.8 18.1 8.4 15.0 Hungary 52.9 23.1 10.4 14.9 36.9 12.5 9.7 8.9 Poland 1.7 7.6 -18.6 3.0 16.7 27.9 21.0 12.5 Slovak Republic 5.2 24.3 4.7 -0.3 3.4 22.9 3.9 2.3 Slovenia 5.8 9.1 2.9 2.2 0.3 0.9 1.1 -0.1 Baltic States 0.1 0.2 - - 0.7 1.2 -0.8 4.9 SEE 4.1 12.2 69.7 32.7 3.1 16.0 15.5 12.6 Bulgaria 0.6 1.1 10.5 10.9 3.2 1.2 1.7 4.9 Croatia 2.9 8.0 15.1 7.8 1.0 12.0 1.7 1.1 Romania 0.5 3.2 36.6 9.4 0.5 3.1 9.7 4.9 CIS 0.5 6.2 18.8 37.2 4.0 7.4 41.3 43.8 Russia 0.5 5.3 12.5 14.7 2.7 7.0 26.6 32.8 Ukraine 0.0 0.8 6.2 22.5 1.3 0.4 14.5 10.6 Source: Austrian National Bank, German National Bank, and UNCTAD (2000).
1
in percent of total outgoing foreign direct investment (FDI) flows to Eastern Europe
Germany
Table 2. Investment Integration with Eastern Europe
Outgoing FDI1 Outgoing FDI1
Austria
During the 1990s, investment integration with eastern Europe was much more pro-nounced than trade integration, in particular for Austria. Between 2000-2002 eastern Europe accounted for 88 percent of total outgoing investment in Austria, while the share of eastern Europe in Germany’s foreign investment was two percent only. Thus, with the opening up of eastern Europe, Austria has concentrated almost all its outgoing in-vestment on this region, while on a global scale eastern Europe is of little importance as a host region for Germany (see Table 2). Nevertheless, Germany and Austria are the most important investors in this region. Both countries account for around 50 percent of total incoming foreign investment in Croatia and Slovenia and for around 40 percent of total incoming investment in the Czech Republic, Hungary and Slovakia (see Marin, Lorentowicz, Raubold, 2002). More recently, however, both countries expanded their investment activity in Russia and south eastern Europe (SEE) at the expense of central and eastern Europe (CEE). As a result, eastern Europe has become more important as a location for Germany (its share increased from 2.4 percent in 1999-2001 to 13 percent in 2005-2007) while less important for Austria (its share declined from 88 percent in 2000-2002 to 58 percent in 2005-2007).
3. The data
The firm-level survey of German and Austrian investors in eastern Europe was ducted for the years 1997-2001 in Germany and 1999-2001 in Austria. The sample con-sists of 2,200 investment projects by 660 Austrian and German firms from 1990-2001. In terms of value, the 1,200 German investment projects represent 80 percent of total German investment in eastern Europe, while the 1,000 Austrian investment projects represent 100 percent of total Austrian investment in eastern Europe. The data covers the period from 1990-2001, but the actual numbers are from the years 1997-2000 in Germany and 1999-2000 in Austria.
Under Communism, no foreign direct investment in eastern Europe took place due to a political ownership constraint. Thus, when we started the survey of German and Aus-trian firms with investments in eastern Europe, we were in the unique situation of being able to collect detailed information on each foreign investment project in eastern Europe and at the same time to aim for a full population sample. The result is a data set that al-lows us to say something representative about how foreign direct investment and out-sourcing to eastern Europe affects the Austrian and German economies. At the same time, the data allows us to say something representative about how incoming foreign investment is affecting eastern Europe because Austria and Germany are such important investors in this region.
The survey questionnaire was in three parts: information on parent firms in Austria and Germany, information on the actual investment project, and information on eastern Eu-ropean affiliates and their environments. A parent firm may undertake more than one investment in eastern Europe. In the sample, Austrian investors had undertaken four to five investments and German investors two to three investments in eastern Europe on average. Due to the length of the questionnaire (we collected information on about 500 variables) we personally visited the parent firms in Austria and Germany or conducted the interview by phone. Very few questionnaires were sent out by mail and filled out
anonymously. The sample is unique in several respects. First, it includes detailed infor-mation on parent firms in Austria and Germany, such as balance sheet data, the internal organisation of the multinational enterprise, its global network, the incentive system used for its workers, and power relationships between parents and affiliates. Second, it contains information about how and where the investment is financed. Third, it includes information on affiliates in eastern Europe, such as ownership structure, type of owner-ship, financial structure, competitive environment, and parent and affiliate trade rela-tions. The sample consists of quantitative as well as qualitative information.
4. A new participant in the global division of labour?
Is eastern enlargement offering eastern Europe the prospect of becoming a new partici-pant in the new international division of labour? If yes, what kind of firm activity is transferred to eastern Europe? In the last two decades the world economy has gone through a dramatic change. A new international division of labour is emerging in the world economy. The global firm produces one input in one location which is then sent for refinement to a second location. The refined input is further refined at a third loca-tion. Thus, firms geographically separate different production stages across the world to
exploit differences in production costs1. Take the example of the German firm Siemens.
Like other global corporations, Siemens has organised its activities in a global value chain with its R&D and engineering activities located in Europe and the United States, procurement and logistics located in south east Asia, its assembly activity located in
eastern Europe, and its marketing activities organised at local level or via the Internet2.
Is this organisational pattern, a general trend among firms in Austria and Germany and is eastern Europe becoming an important location for these firms in their global organi-sation of production?
In other words, why do German and Austrian firms invest in eastern Europe ? Do they want to replicate their production facilities in the countries of eastern Europe or do they want to exploit differences in factor costs between Germany and Austria on the one hand and eastern Europe on the other? The former is a horizontal foreign direct invest-ment (FDI) and is primarily motivated to gain access to the host country market. The
latter is a vertical FDI and is motivated by wage differentials3. One reason why we
might be interested to distinguish between these two forms of multinational activity is to identify their potential effects on wage inequality and employment levels in Austria and Germany.
1
The new features of globalisation are described in the 'Globalisation Report to the European
Com-mission', see Bourguignon et al (2002).
2
See Financial Times Deutschland , 12 December 2003, and Sorg, Armin (2001) Erwartungen und
Erfahrungen eines Großunternehmens: Das Beispiel der Siemens AG, Ökonomische Konsequenzen
einer EU-Osterweiterung, Friedrich Ebert Stiftung, Digitale Bibliothek, Bonn.
3
For the theory of vertical FDI, see Helpman (1984), Helpman and Krugman (1985); for theories of horizontal FDI, see Brainard (1993, 1997), Markusen and Venables (2000).
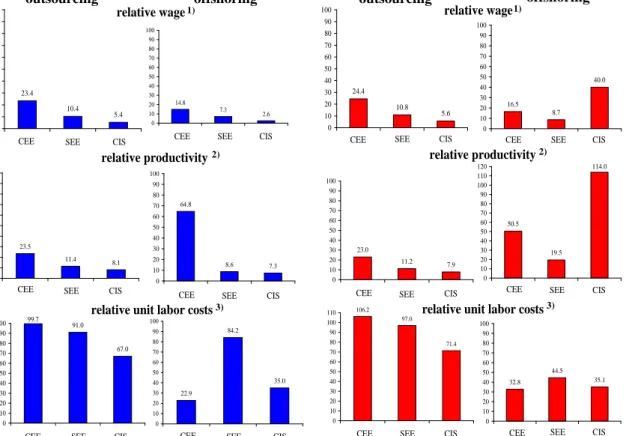
Figure 1. Comparative advantage of eastern Europe 0 10 20 30 40 50 60 70 80 90 100
CAND1 CAND2 CIS
0 10 20 30 40 50 60 70 80 90 100
CAND1 CAND2 CIS
relative wage Germany 23.4 10.4 5.4 0 10 20 30 40 50 60 70 80 90 100
CAND1 CAND2 CIS
23.5 11.4 8.1 0 10 20 30 40 50 60 70 80 90 100
CAND1 CAND2 CIS
99.7 91.0 67.0 0 10 20 30 40 50 60 70 80 90 100
CAND1 CAND2 CIS
24.4 10.8 5.6 0 10 20 30 40 50 60 70 80 90 100
CAND1 CAND2 CIS
23.0 11.2 7.9 0 10 20 30 40 50 60 70 80 90 100
CAND1 CAND2 CIS
106.2 97.0 71.4 0 10 20 30 40 50 60 70 80 90 100 110
CAND1 CAND2 CIS 64.8 8.6 7.3 0 10 20 30 40 50 60 70 80 90 100
CAND1 CAND2 CIS
relative productivity
relative unit labor costs
country firm
country firm
relative wage relative wage
16.5 8.7 40.0 0 10 20 30 40 50 60 70 80 90 100
CAND1 CAND2 CIS
14.8 7.3 2.6 0 10 20 30 40 50 60 70 80 90 100
CAND1 CAND2 CIS
50.5 19.5 114.0 0 10 20 30 40 50 60 70 80 90 100 110 120
CAND1 CAND2 CIS
32.8 44.5 35.1 0 10 20 30 40 50 60 70 80 90 100
CAND1 CAND2 CIS
relative unit labor costs
22.9 84.2 35.0 0 10 20 30 40 50 60 70 80 90 100
CAND1 CAND2 CIS
CEE SEE CIS
relative productivity
CEE
CEE
CEE CEE CEE
CEE CEE
CEE
CEE CEE CEE
SEE SEE SEE
SEE SEE
SEE SEE
SEE SEE SEE SEE
CIS CIS CIS
CIS CIS CIS CIS CIS CIS CIS CIS Germany Austria
offshoring outsourcing offshoring
outsourcing
Source: The Vienna Institute for International Economic Studies (wiiw); Statistisches Bundesamt; Statistik Austria; Chair of International Economics, University of Munich, firm survey of 2200 investment projects in Eastern Europe by 660 firms
1) outsourcing: average wage (wage bill per employee) in Eastern Europe relative to Germany and Austria, respectively, in 2001
offshoring: average wage (wage bill per employee) of affiliates in Eastern Europe relative to parent firms in Germany and Austria, respectively; for Austria in 1999-2000 and for Germany in 1997-2000
2)outsourcing: GDP per employment in Eastern Europe relative to Germany and Austria, respectively, in 2001.
offshoring: sales per employee of affiliates in Eastern Europe relative to parent firms in Germany and Austria, respectively; for Austria in 1999-2000 and for Germany in 1997-2000
3)outsourcing: wage bill divided by GDP in Eastern Europe relative to Germany and Austria, respectively, in 2001
offshoring: wage bill divided by sales of affiliates in Eastern Europe relative to parent firms in Germany and Austria, respectively; for Austria in 1999-2000 and for Germany in 1997-1999-2000
CEE includes Estonia, Latvia, Lithuania, Poland, Slovakia, Slovenia, Czech Republic, Hungary; SEE includes Albania, Bosnia-Herzegovina, Bulgaria, Croatia, Republic of Macedonia, Romania; CIS includes Armenia, Azerbaijan, Georgia, Kazakhstan, Kyrgyzstan, Moldavia, Russia, Tadzhikistan, Turkmenistan, Ukraine, Uzbekistan, Belarus
1) 1)
2) 2)
3) 3)
When multinational firms wish to exploit differences in factor costs in eastern Europe how much in terms of labour costs can they save when establishing an affiliate in east-ern Europe? In Figure 1, we compare relative wages, relative productivity, and relative unit labour costs between Austria and Germany on the one hand and central eastern Eu-rope (CEE), southern eastern EuEu-rope (SEE), and the countries of the former Soviet Un-ion (CIS) on the other. We focus first on Germany. It appears from the left panel of Fig-ure 1 that wages in CEE are about 23 percent of those in Germany, while productivity in these countries has reached about 23 percent of Germany’s productivity level. As a re-sult, labour unit costs in CEE countries are the same as in Germany. Thus, when
man firms buy input goods in one of the CEE countries they do not save on costs for the input good compared to when the input is produced in Germany.
Can these costs be reduced when multinational firms open an affiliate in one of the CEE countries and produce the input themselves? Figure 1 reveals that German affiliates in CEE pay 16.5 percent of their German parent wages but are increasing their productivi-ty to 60 percent of the parents’ productiviproductivi-ty level. Therefore, they can reduce the labour costs by 72.4 percent relative to their parent firms’ cost in Germany.
In the SEE countries (Romania, Bulgaria, Croatia) both wages and productivity are low so that unit labour costs in the SEE countries are 91 percent of Germany’s unit labour costs. Furthermore, these costs are not reduced by as much as in the CEE countries when German firms produce locally in the SEE countries (labour cost are reduced by 50 percent), since producing locally does not help to increase productivity as much as in the CEE countries.
The picture looks different in the CIS countries. Relative wages in Russia and Ukraine are five percent of Germany’s, while these countries have eight percent of Germany’s productivity, so that their unit labour costs are 67 percent of Germany’s. However, when German firms produce locally in affiliates in the CIS they can save 73 percent of their labour costs due to lower wages of German affiliates in Russia and Ukraine. The right panel of Figure 1 gives similar numbers for Austria.
But how important are each of these motivations – market seeking versus cost-advantage seeking – for foreign direct investments in eastern Europe? Are German and Austrian firms primarily moving their activities to eastern Europe to exploit differences in factor prices or do they want to be close to the eastern European market by producing locally?
One way to answer this question is to look at the pattern of intra-firm trade. In Table 3, I use the pattern of intra-firm trade as a criterion to determine whether German and Aus-trian foreign investments in eastern Europe are market seeking or cost advantage seek-ing. I define foreign investment in eastern Europe as a multinational outsourcing activi-ty driven to exploit differences in factor prices when parent firms in Austria and Ger-many export input goods to their affiliates in eastern Europe as well as import these goods back from their affiliates in eastern Europe after refinement. Thus, in an out-sourcing activity, affiliates in eastern Europe do not produce exclusively for the local market. This way, multinational outsourcing involves an intra-firm export from the par-ent firm in Germany or Austria to their affiliates in eastern Europe as well as an
intra-firm import from their affiliates in eastern Europe to Germany or Austria4.
4
In the literature different definitions of outsourcing have been used. Hummels et al (2001) use
input-output tables at the industry level to calculate an index of vertical specialisation. Vertical
specialisa-tion is defined as the share of imported inputs which is re-exported. Hanson et al (2001) use the
no-tion of export platforms to calculate the share of exports in percent of affiliates’ output of US multi-nationals. The criterion for outsourcing used here is somewhat more strict than those in the literature.
It is more strict than Hummels et al’s measure of vertical specialisation, since I include intra-firm
in-puts only, while Hummels et al include inputs also between independent firms. It is also more strict
than Hanson et al’s concept of export platforms, since I require an import as well as an export
I focus first on Germany. From the right panel of Table 3 we see that on average 45 per-cent of all German investment to eastern Europe fulfills these criteria and is motivated by lower wages in eastern Europe. The importance of outsourcing investment becomes, however, much greater for individual eastern European countries. Outsourcing domi-nates among German investment in the Czech Republic, Bulgaria, Slovakia, and Roma-nia (share of around 70 percent). It plays little role in SloveRoma-nia and Poland. When a tigh-ter critigh-terion for outsourcing is used, requiring that parent firms import at least 20 per-cent of their eastern European affiliates’ output rather than import at all, German multi-nationals' outsourcing is reduced to 10 percent in the Czech Republic, to seven percent in Russia and to two percent in Ukraine. All the other numbers remain the same.
Among Austrian multinationals, the outsourcing activities to eastern Europe are much less significant. Only 17 percent of total Austrian investment to eastern Europe is moti-vated by lower wages in eastern Europe. But again the share varies considerably across individual countries in eastern Europe. Sixty-eight percent of Austria’s investment in Russia and 42 percent of its investment in Poland is motivated by factor prices. These numbers do not change when a stricter criteriion for outsourcing is applied requiring parent firms to import at least 20 percent of their eastern European affiliates’ output.
tween parent and affiliates and I include exports of affiliates to parent firms only, while Hanson et al
include all exports of affiliates whatever their destination in their measure of export platforms. 7
Baltic States 3 3.11 7 28.43 Czech Republic 36 11.73 77 75.95 Hungary 27 10.19 42 27.18 Poland 20 41.54 38 14.50 Slovak Republic 19 9.94 16 68.71 Slovenia 13 15.49 5 12.44 Bulgaria 4 2.99 9 71.94 Romania 14 24.20 19 63.68 other SEE 21 8.46 5 14.29 Russia 7 67.90 31 26.59 Ukraine 8 16.14 4 17.11 other CIS 3 3.72 24 49.36 2)
of all foreign direct investments in respective Eastern European country.
1)
parent firms export intermediate goods as well as import intermediate or final goods from their affiliates in Eastern Europe; A tighter criterion for outsourcing requiring that parent firms import at least 20 percent of their Eastern European affiliates' output (rather than import at all) reduces the German multinationals' outsourcing numbers for the Czech Republic to 10 percent, for Russia to 7 percent, and for Ukraine to 2 percent. All other numbers remain the same.
Source: Chair of International Economics, University of Munich, firm survey of 2200 investment projects in Eastern Europe by 660 firms
29.15
all transition countries 175 17.27 277 45.44
CIS 18 42.11 59
46.68
55.68
SEE 39 12.06 33
CEE 118 17.12 185
Table 3. Multinationals' Outsourcing Activity to Eastern Europe
1)Austrian Multinationals German Multinationals
cases in percent 2) cases in percent 2)
In summary, the pattern of vertical specialisation that has emerged between Germany and eastern Europe on the one hand and Austria and eastern Europe on the other, sug-gests that some of the eastern European countries such as Hungary, Poland, Slovakia,
Romania and Russia, have clearly become new participants in the international division of labour.
5. An exodus of jobs?
In the previous section we documented that German and Austrian firms can substantial-ly reduce their labour costs (between 37-73 percent) by outsourcing to eastern Europe. We also showed that in Germany 45 percent, and in Austria 17 percent, of investments in eastern Europe are motivated by lower wages in eastern Europe, with firms outsourc-ing labour-intensive production stages to eastern Europe. Does this imply that these out-sourcing activities have caused major job losses in Germany and Austria, respectively? We first look at what firms themselves say they are doing and then turn to an econome-tric analysis.
5.1What the firms say …
In this section we make a back-of-the-envelope calculation of multinational job reloca-tions to eastern Europe based on what multinational corporareloca-tions say they are doing. In the firm survey, we asked firms to classify what motivated their investments in eastern Europe and whether or not the investment is a relocation of production to eastern Eu-rope or the creation of additional capacity in eastern EuEu-rope beyond the capacity in Austria and Germany, respectively. The motivations considered are access to the eastern European market, market size, lower production costs, availability of well-trained skilled labour, and avoidance of transport costs and of exchange-rate risk. In addition firms gave us information on how many jobs each of their investments created in east-ern Europe. A positive response to lower production costs and to offshore production in the survey together with the filled-in information on jobs in eastern Europe, is then used to compute the job losses associated with offshore production in Austria and Germany, respectively.
Austria Germany Austria Germany
Relocation Induced Jobs
due to:
offshore production -10,494 -115,698 low production costs -38,022 -117,074
intra-firm imports -57,833 -207,220 affiliate to parent productivity 0.61 0.56 0.77 0.43
Job Destruction -29,595 -130,352 -44,531 -89,105
Trade induced Jobs
due to:
induced exports to EE 7,157 36,606 2,951 53,607 induced imports from EE -4,901 -34,555 -5,433 -107,904
Job Creation 4,279 2,051 -2,482 -54,297
Net Job Destruction -25,316 -128,301 -47,013 -143,402
in percent of parent employment -1.72 -1.07 -3.19 -1.19 in percent of total employment -0.82 -0.38 -1.51 -0.42
Austria Germany
Total Affiliates Employment (survey) 201,795 463,550
Total Parent Employment 1,473,176 12,044,598
Total Employment 3,106,000 34,133,000
Source: Chair of International Economics, University of Munich, firm survey of 2200 investment projects in Eastern Europe by 660 firms Notes:
offshore production: number of jobs created in Eastern European affiliates, when firms classified the investment as a relocation activity from Germany and Austria, respectively.
low production costs: number of jobs created in Eastern European affiliates, when investors ranked low production costs as decesive or important motivation for the investment.
affiliate to parent productivity: ratio of value added per employee in Eastern European affiliates to value added per employee in parent firms.
induced exports: number of jobs created in Austria and Germany, respectively, due to inputs delivered by parent firms to affiliates in EE. The value of inputs is divided by parent firms value added per worker to obtain the number of jobs created in Austria and Germany, respectively.
induced imports: number of jobs lost in Austria and Germany, respectively, due to intermediate and final goods sent by affiliates in Eastern Europe to parent firms. The value added of EE affiliates is divided by parent firms value added per worker to obtain the number of jobs lost in Austria and Germany, respectively. intra-firm imports: number of jobs created in Eastern European affiliates, when parent firms in Germany and Austria import inputs from their affiliates in Eastern Europe.
subjective measure objective measure
number of jobs
Table 4. Multinationals' Job Relocations to Eastern Europe
The calculation of job losses based on this ‘subjective measure’ is given in Table 4. German multinationals have created 463,550 jobs and Austrian multinationals 201,795 jobs in eastern Europe. According to our calculation, these newly created jobs in eastern Europe have led to a direct loss of 128,301 jobs in Germany and 25,316 jobs in Austria due to multinationals relocating to eastern Europe. These figures are obtained by com-puting the jobs created by German firms in eastern Europe when investors have given low costs or outsourcing as the prime motivation for the investment. From this motiva-tion, German firms have created 232,772 jobs in eastern Europe, which accounts for 50 percent of total German affiliates’ employment in eastern Europe. Note, however, that German affiliates in eastern Europe have on average 56 percent of the productivity level of their parent firms only. Therefore, one job created in eastern Europe is equivalent to a 0.56 job lost in Germany implying relocation-induced job destruction of 130,352 jobs in Germany.
But the opening of a subsidiary in eastern Europe creates new trading opportunities. German parent firms typically deliver inputs for further refinement to their affiliates in eastern Europe. These intra-firm exports to eastern Europe have createds 36,606 jobs in Germany. The number is obtained by computing the number of jobs created in Germany due to inputs delivered by parent firms to affiliates in eastern Europe. To compute the number of jobs created in Germany, we divide the value of inputs sent to affiliates in eastern Europe by the parents’ value added per worker. Thus, 36,606 workers in Ger-many were used to produce the value of inputs sent to eastern European affiliates. Eastern European affiliates, in turn, deliver refined inputs or final goods back to parent companies. These intra-firm imports from eastern Europe resulted in 34,555 jobs lost in Germany. Again, this number is obtained by computing the number of jobs lost in Ger-many due to eastern European affiliates’ delivery of goods to parent firms in GerGer-many. The value added of eastern European affiliates is divided by parent firms’ value added per worker. Thus, 34,555 workers are not used in German production, because the value added is produced by eastern European affiliates. The described intra-firm exports and imports lead to net trainduced job creation of 2,051 jobs. This adds up to a net de-struction of 128,301 jobs in Germany.
An analogous computation results in a net destruction of 25,316 jobs in Austria. It is interesting to note that Austrian firms create 48,516 jobs in eastern Europe because of a cost saving motivation, which accounts for 24 percent of total Austrian affiliates' em-ployment in eastern Europe. This is half as much as in Germany, where 50 percent of
affiliates’ jobs in eastern Europe are created because of cost considerations5. Taking the
productivity differential between parent and affiliates and intra-firm trade into account, the job creation in eastern Europe translates into a loss of 25,316 jobs in Austria.
Furthermore, Table 4 gives an analogous calculation of job losses based on an ‘objec-tive measure’ rather than on the relocation mo‘objec-tive given by firms. In the ‘objec‘objec-tive measure’ for an outsourcing investment we require that parent firms in Austria and Germany import input goods from their affiliates in eastern Europe. Here we find that 207,220 jobs have been created in eastern Europe by German firms, which results in destruction of 89,105 jobs, which leads to a net destruction of 143,402 jobs in Germany because the trade induced job losses are much larger by this measure of outsourcing. The calculation based on the ‘objective measure’ gives job losses of 47,013 in Austria. The computation in Table 4 is a rough calculation and has to be taken for what it is. Thus, the computed job numbers have to be interpreted with caution. In particular, the calculation has the following shortcomings. The calculation assumes that one job lost at the level of the firm translates into one job lost to the economy as a whole. Thus, the computation ignores any general equilibrium effects. Typically, when workers lose their jobs at one particular firm, they are reemployed by other firms with an accompanying
5
This is consistent with the findings of the previous section that outsourcing activities dominate among German investment, but not among Austrian investment in eastern Europe. One reason for this difference between Germany and Austria is the different pattern of specialisation of German and Austrian investment in Eastern Europe. Germany is predominantly engaged in machinery and trans-port with 90 percent of outsourcing investment, while Austria is predominantly involved in banking with 30 percent of outsourcing investment.
adjustment in wages. Ignoring such general equilibrium effects may be justified when wages are not allowed to adjust due to labour market rigidities. Figure 2 of section 7 shows that relative wages remained more or less fixed in Austria and Germany during the 1990s, suggesting that these general equilibrium effects could not fully work them-selves through the system. Thus, applying the one-to-one assumption does not seem to be completely unrealistic for Austria and Germany. In any case, the computation leads to larger job losses in Germany and Austria, respectively, than would have taken place otherwise with flexible wages when general equilibrium effects are taken into account, and thus can be seen to represent an upper bound of the true job losses due to outsourc-ing.
The computed losses of 128,301 (143,402) jobs in Germany and of 25,316 (47,013) jobs in Austria account for about 0.4 percent and 0.8 percent of total employment in Germa-ny and Austria, respectively, with the subjective measure of outsourcing, and of 0.4 and 1.5 percent in Germany and Austria with the objective measure of outsourcing. These are indeed small numbers.
Why are these job losses surprisingly so low? To get to an answer we turn now to an econometric analysis of the labour demand of multinationals.
5.2An econometric analysis
In this section, I examine by estimating labour demand functions of German and Aus-trian parent firms if and how multinationals’ labour demand across locations is related. Does a multinational firm in Austria or Germany reduce labour demand in the Austrian or German labour market when wages in its affiliates in eastern Europe decline? In this case, cheaper labour in eastern Europe substitutes for expensive labour in Austria and Germany.
Consider a firm producing in a number of countries. The firm that can decompose pro-duction across borders maximises global profits. Global profits are the sum of revenues across locations of production minus production costs. The firm chooses a vertical de-composition of production to optimise over relative wages leading to complementarity in labour demands between locations. Thus, the location of production stages depends on relative wages if trade barriers are not prohibitive. Assembly is produced in the low-wage location if there is intra-firm trade. In a simple two-country case, the parent’s
la-bour demand Li can be expressed as
(1) Li =αi +βiwi +βjwj +γiYi +γ jYj
The multinational’s reduced form labour demand for a given affiliate location j is the
weighted sum of labour costs w and demand conditions Yacross locations.6 The focus
of our empirical analysis is to estimate the cross-elasticity of labour demandβj. If
pro-duction is vertically decomposed then the parent’s labour demand will be decreasing in
6
For the model, see Riker and Brainard (1997). 12
the wage in its location,βi <0, decreasing in the wage of its affiliate location βj <0,
increasing in local demandγj >0, and increasing in foreign demand γj >0. On the
other hand, if production is not vertically decomposed, thenβj ≥0. Withβj <0,
multi-nationals are linked internationally at the firm level through trade in intermediate and final goods. As a result of those trade links affiliate jobs are complements rather than substitutes for parent firm jobs.
We estimate a log-linear version of the parent’s labour demand equation (1) using ordi-nary least squares based on our firm survey data of 2,200 investment projects in eastern Europe by 660 firms in Austria and Germany. The data are at the firm-level and are a cross section for the years 1997-2000 in Germany and for the years 1999-2000 in Aus-tria, covering the production activity of German and Austrian affiliates in all countries of eastern Europe including the former Soviet Union. Equation 1 includes industry dummies to account for firm heterogeneity as well as time dummies for the years 1997-2000 in Germany and for the years 1999-1997-2000 in Austria to control for time fixed
ef-fects7. Due to data problems we will not distinguish between workers by skill level,
be-cause we do not observe wages for skills at the firm level. Wages w are average
euro-denominated compensations per employee and Y are sales of parent firms in Austria
and Germany and their affiliates in eastern Europe. The independent variable parent
employment Li is number of workers of parent firms in Austria and Germany,
respec-tively.
We estimate the model of multinational labour demand separately for affiliates in CEE,
SEE and the CIS allowing the slope terms β and γ to vary across these regions.
7
We are not too worried about the potential problem of endogeneity of the independent variables firm wages and firm output, since the time dimension of the data set is limited. The data cover the period 1990 to 2001, but the actual figures are for the years 1997 to 2000 for Germany and 1999 to 2000 for Austria. A possible problem of endogeneity may arise when wages in eastern Europe affiliates in-crease and wages of parent firms decline due to firms relocation of production towards eastern Eu-rope.
CEE SEE CIS CEE SEE CIS
dependent variable: log parent employment
log parent output 0.88* 0.95* 1.11* 0.96* 0.97* 1.09*
(31.08) (14.72) (11.12) (35.33) (7.48) (26.03)
log parent wage -0.86* -0.86* -2.20* -0.48* -0.76* -0.38
(7.80) (2.72) (4.91) (7.21) (2.23) (1.42)
log affiliate output -0.04 -0.04 -0.12 -0.07* -0.13 0.00
(1.46) (0.70) (1.45) (2.17) (0.97) (0.07)
log affiliate wage -0.16* -0.04 0.08 -0.16* 0.14 -0.12
(2.77) (0.43) (0.67) (3.34) (0.73) (1.83)
constant 1.51 -1.47 10.47* -4.33* -2.37 -9.21*
(1.14) (0.42) (2.31) (4.90) (0.52) (3.53)
corr. R2 0.786 0.829 0.921 0.844 0.825 0.949
number of oberservations 401 90 35 311 38 62
t-values are reported in parentheses. * significant at the 5% percent level
Table 5. Parent Labour Demand Equation
Austria Germany
Note: Estimates are for a cross section of parent firms and their affiliates in Central Eastern Europe (CEE), Southern Eastern Europe (SEE) and the former Soviet Union (CIS) of the years 1997-2000 in Germany and 1999-2000 in Austria. Estimation is based on equation (1) and are OLS estimates including industry fixed effects and time dummies for the years 1997-2000 for Germany and 1999-2000 for Austria.
The results of estimating equation (1) are reported in Table 5. Table 5 gives Austrian and German parent companies’ labour demand, respectively for the CEE countries, the candidate countries of the second round SEE, and the CIS countries . The estimated employment demand functions show that a 10 percent decline in affiliate wages in CEE countries leads to a 1.6 percent increase rather than decline in the parent company’s employment demand in both Austria and Germany, respectively. These estimates sug-gest that the outsourcing activity of German and Austrian firms to eastern European
countries has actually helped to create jobs in Austria and Germany, respectively. Out-sourcing some of the firm’s activities to their CEE affiliates has helped Austrian and German firms to save 65-80 percent of their labour costs (see Figure 1), helping these firms to stay competitive in an increasingly competitive environment. Rather than com-peting with each other as alternative suppliers of the same final goods, affiliates in the CEE countries complement each other by supplying different components of the same final good.
The picture looks different for the SEE countries. In the SEE countries, affiliates’ wages appear not to play any role for the parent firms’ labour demand in Austria and Germany, respectively. At first, this seems surprising, given the relative low wages in these coun-tries. A look at Figure 1 offers, however, an answer. German and Austrian affiliates in these countries are not able to increase their productivity levels much beyond that of the country as a whole when producing locally. Therefore, outsourcing to the SEE countries does not offer the prospect of lowering German and Austrian firms’ overall production costs as much as in the CEE countries. As an outsourcing location, the SEE countries appear to be less attractive.
The picture looks different again for the CIS countries. Austria’s and Germany’s multi-nationals appear to follow a diverse strategy in these markets. German multimulti-nationals use the CIS countries to lower their overall production costs. A decline in CIS affiliate wages increases the German parent’s labour demand. The relationship is significant at the 10 percent level. Austrian multinationals, however, appear to substitute cheap labour in the CIS for expensive labour in Austria. However, the relationship is not significant at conventional levels.
In sum, job losses because of Austrian and German investment in eastern Europe appear low for two reasons. First, in Austria, horizontal investment driven by market-seeking considerations dominates among investment in eastern Europe. Second, among vertical investment driven by differences in factor prices, affiliate jobs in eastern Europe appear not to compete with jobs in Austria and Germany. Austrian and German firms increase their production and employment demand in Austria and Germany when workers in their affiliates in the CEE countries become less costly. Lower costs of eastern Euro-pean affiliates help firms to lower overall productions costs and to stay competitive. This appears to be the reason why job losses because of Austrian and German
invest-ment in eastern Europe are so strikingly low8.
8
Riker and Brainard (1997), Brainard and Riker (1997) get very similar results for US multinational firms’ investment strategy in face of NAFTA; see also Braconnier and Eckholm (2000) for Swedish multinationals in eastern Europe.
6. A human capital crisis?
In recent months a new concern has been raised by economic experts in Germany. Ger-man firms are now outsourcing their head office activities to eastern Europe. GerGer-many is now losing the ‘good jobs’, the high-skilled, R&D and IT jobs, not just low-skilled jobs. Siemens, for example, announced in an interview with the Financial Times Deut-schland that it plans to outsource one-third of its R&D activity to subsidiaries located in low-wage countries such as China, India and Russia. It also plans to centralise and outsource some of its head office activities, such as accounting and personnel manage-ment, to Siemens subsidiaries in the Czech Republic. Siemens praised the high quality of skilled workers in eastern Europe. Armin Sorg, the Siemens chief economist, argued at a conference on the ‘Economic consequences of eastern Enlargement’, hosted by the Friedrich Ebert Stiftung, that east Europe is a particularly attractive location for Sie-mens compared to China and India, because of its proximity to Germany and because of
the same culture and timezone9. Similarly, Bank Austria has started to outsource
ma-thematical software development and other head office functions to Russia. Are these corporate inversions of firm activities taking place only at Siemens and Bank Austria or
are they a general trend among Austrian and German multinational firms?10
9
See Financial Times Deutschland , 12 December 2003, and Sorg, Armin (2001) Erwartungen und
Erfahrungen eines Großunternehmens: Das Beispiel der Siemens AG, Ökonomische Konsequenzen
einer EU-Osterweiterung, Friedrich Ebert Stiftung, Digitale Bibliothek, Bonn.
10
The trend of corporate inversions has been observed in the US as well where US firms outsource IT
jobs and other headquarter activity to India and partly China, see The Economist, January 2004.
(1 ) (2 ) (1 ) (2 ) (1 ) (2 ) (1 ) (2 ) CEE 49. 94 2.9 3 11. 10 0.8 5 C E E 16. 26 1.2 0 12. 65 0.4 7 Ba lt ic s ta te s 22. 22 1. 4 4 5.2 4 0. 4 8 Ba lt ic s tat es 10. 45 1.0 7 3. 7 8 0.1 7 C ze ch R epu bl ic 86. 08 5.5 1 17. 88 1.6 6 C ze ch R epu bl ic 14. 71 2.0 1 12. 14 0.3 7 Hun g ar y 13. 43 0. 7 1 9. 8 5 0.6 5 H u ng ary 16. 78 1.0 5 20. 40 0. 9 7 Pola nd 26. 45 1.4 5 6.4 8 0. 4 8 Pola nd 17. 73 2.4 2 5.4 5 0. 1 8 Sl ov ak R epublic 39. 83 2.5 4 3.9 7 0. 4 0 Sl ov ak R epublic 18. 92 0.9 7 12. 43 0.4 7 Sl ove n ia 8.3 3 1. 1 0 17. 07 1.0 6 Sl ov eni a 10. 23 0.3 7 11. 41 0. 4 7 SEE 19. 66 2.0 5 10. 10 0. 6 5 SEE 13. 79 0.7 8 15. 39 0.5 2 Bul g ar ia 12. 50 11. 78 8.5 3 0. 7 6 Bulg ar ia 18. 55 26. 35 6.6 8 0. 2 7 C roa tia 40. 00 2. 5 9 28. 50 1.7 8 C roa tia 24. 39 1.6 0 29. 72 0. 8 7 Rom ani a 12. 77 1. 3 1 6. 9 1 0.3 3 Rom ani a 9. 5 5 3.7 2 10. 86 0. 4 2 CIS 62. 39 2. 8 9 25. 02 1.8 6 C IS 27. 02 8.2 2 10. 40 0. 2 5 Ru ssi a 62. 58 2.8 6 27. 82 2. 8 8 Rus si a 34. 84 3.6 9 45. 77 1.0 1 Uk ra in e --5 .1 7 1. 3 6 U k ra ine 20. 36 19. 35 3. 9 2 0.1 4 To tal 50. 23 2. 8 6 15. 28 1.1 2 To ta l 16. 19 1.1 0 12. 78 0. 4 5 G erm an pa ren t fir m s 17. 57 13. 59 A u st ri a n p a ren t firm s 14. 72 28. 33 Ge rm an y Tabl e 6. Hi g h S k il l J o bs i n Affi li at es i n E ast ern E u ro p e U n iv ers it y a n d C o ll eg e G rad u a te s R &D P ers on n el 3) N u m b er of em p lo y ees en ga ged i n R & D or en g in eeri n g i n p erc ent of a ff ili a tes ’ emp lo y m en t. Th e R & D p ers on nel ra ti os h a ve b een c om p ut ed b y ad d ing u p all emp lo yees en ga ged in R & D or en gin eeri n g in a ffi li at es i n a p art icu la r E a st er n Eu ro pe an c o un tr y d iv id ed b y to ta l a ff il ia te s’ em p lo y m en t in t h at p ar ti cul ar E ast er n E u ro pe an co u n tr y . 4) A ff ili at es’ R & D p er sonn el rat io r ela tive t o p aren ts ’ R & D p erso n n el rat io. T h e p a re n t R & D p ers onn el r ati os ha v e b een c o mp u te d b y a dd in g u p a ll emp lo y ees en ga ged in R & D or en gin eerin g i n G erm an pa re n t firm s di vi d ed b y t o ta l p aren t emp loy m en t in G erm a n y . T h e af fi lia te t o pa rent R & D r at ios in c o lum n ( 2 ) a re co mpu te d r ela ti ve t o th e p aren t R & D p er so n n el ra ti os of th os e G erm a n p are n t fi rms on ly t h at ha ve i n v es ted in th e pa rt icu la r Ea st ern Eu ro p ean c oun tr y . Un iv e rs ity a n d Col le g e G ra du a te s A ffi li at es' H ig h Sk il l P er so nne l Rat io 1) Af fi li a te t o P a re n t Sk ill R at io 2) Af fi li a te s' R & D Pe rs onn el R a ti o 3) Af fi li at e t o P ar en t R& D P er so n n el Ra ti o 4) A ffi li at es' H ig h Sk ill P er so nne l Rat io 1) A ffi li a te t o Pa re n t S k ill R a ti o 2) A ffi li a tes ' R & D Pers on n el R at io 3) R& D P er so nne l S o ur ce : Ch ai r o f In te rna tio n a l E c o no m ics , U n iv er si ty o f Mu ni ch, f ir m s ur v ey o f 220 0 i nv es tm en t pr o je c ts in E a st er n E ur o pe b y 6 6 0f ir m s 1) Nu m b er of em p lo y ees w it h u n ivers ity a n d c ollege d egree i n p er c en t of a ffili a tes ’ em p loy m en t. T h e h ig h sk ill p ers on n el rat ios ha v e be en co m put ed b y a ddi ng up a ll u niv er si ty a n d c o ll eg e gr adu a te s in af fi li at es i n a p ar ti cul ar Eas te rn E u ro pe an c o un tr y d iv id ed by to ta l af fi li at es ’ em pl o y m ent in t h at p ar ti cul ar E ast er n E ur o p ea n co u ntr y . 2) A ffi li a tes ’ h ig h s k ill p er sonn el ra ti o r ela ti ve t o p are n ts’ h ig h s k ill p erso n n el r at io. T h e p aren t h ig h s k ill p er son n el ra ti os ha v e b ee n c o m p ute d by a d di ng up al l em p loy ee s w ith uni v er si ty a n d co ll ege de g re es in G er m an pa re nt f ir m s d iv ide d by to ta l p ar ent e m pl o y m ent in G er m any . T he a ff il ia te t o p a re nt s ki ll r ati o s in co lum n ( 2) ar e co m p ute d r el at iv e to t he pa re n t h ig h s k ill p er son n el ra ti o s o f th ose G erm an p aren t fi rm s o n ly t h at ha v e in vest ed in t h e pa rti cu la r A ffi li a te t o Pa re n t R & D Pe rs onn el Ra ti o 4) Austria (1 ) (2 ) (1 ) (2 ) (1 ) (2 ) (1 ) (2 ) CEE 49. 94 2.9 3 11. 10 0.8 5 C E E 16. 26 1.2 0 12. 65 0.4 7 Ba lt ic s ta te s 22. 22 1. 4 4 5.2 4 0. 4 8 Ba lt ic s tat es 10. 45 1.0 7 3. 7 8 0.1 7 C ze ch R epu bl ic 86. 08 5.5 1 17. 88 1.6 6 C ze ch R epu bl ic 14. 71 2.0 1 12. 14 0.3 7 Hun g ar y 13. 43 0. 7 1 9. 8 5 0.6 5 H u ng ary 16. 78 1.0 5 20. 40 0. 9 7 Pola nd 26. 45 1.4 5 6.4 8 0. 4 8 Pola nd 17. 73 2.4 2 5.4 5 0. 1 8 Sl ov ak R epublic 39. 83 2.5 4 3.9 7 0. 4 0 Sl ov ak R epublic 18. 92 0.9 7 12. 43 0.4 7 Sl ove n ia 8.3 3 1. 1 0 17. 07 1.0 6 Sl ov eni a 10. 23 0.3 7 11. 41 0. 4 7 SEE 19. 66 2.0 5 10. 10 0. 6 5 SEE 13. 79 0.7 8 15. 39 0.5 2 Bul g ar ia 12. 50 11. 78 8.5 3 0. 7 6 Bulg ar ia 18. 55 26. 35 6.6 8 0. 2 7 C roa tia 40. 00 2. 5 9 28. 50 1.7 8 C roa tia 24. 39 1.6 0 29. 72 0. 8 7 Rom ani a 12. 77 1. 3 1 6. 9 1 0.3 3 Rom ani a 9. 5 5 3.7 2 10. 86 0. 4 2 CIS 62. 39 2. 8 9 25. 02 1.8 6 C IS 27. 02 8.2 2 10. 40 0. 2 5 Ru ssi a 62. 58 2.8 6 27. 82 2. 8 8 Rus si a 34. 84 3.6 9 45. 77 1.0 1 Uk ra in e --5 .1 7 1. 3 6 U k ra ine 20. 36 19. 35 3. 9 2 0.1 4 To tal 50. 23 2. 8 6 15. 28 1.1 2 To ta l 16. 19 1.1 0 12. 78 0. 4 5 G erm an pa ren t fir m s 17. 57 13. 59 A u st ri a n p a ren t firm s 14. 72 28. 33 Ge rm an y Tabl e 6. Hi g h S k il l J o bs i n Affi li at es i n E ast ern E u ro p e U n iv ers it y a n d C o ll eg e G rad u a te s R &D P ers on n el 3) N u m b er of em p lo y ees en ga ged i n R & D or en g in eeri n g i n p erc ent of a ff ili a tes ’ emp lo y m en t. Th e R & D p ers on nel ra ti os h a ve b een c om p ut ed b y ad d ing u p all emp lo yees en ga ged in R & D or en gin eeri n g in a ffi li at es i n a p art icu la r E a st er n Eu ro pe an c o un tr y d iv id ed b y to ta l a ff il ia te s’ em p lo y m en t in t h at p ar ti cul ar E ast er n E u ro pe an co u n tr y . 4) A ff ili at es’ R & D p er sonn el rat io r ela tive t o p aren ts ’ R & D p erso n n el rat io. T h e p a re n t R & D p ers onn el r ati os ha v e b een c o mp u te d b y a dd in g u p a ll emp lo y ees en ga ged in R & D or en gin eerin g i n G erm an pa re n t firm s di vi d ed b y t o ta l p aren t emp loy m en t in G erm a n y . T h e af fi lia te t o pa rent R & D r at ios in c o lum n ( 2 ) a re co mpu te d r ela ti ve t o th e p aren t R & D p er so n n el ra ti os of th os e G erm a n p are n t fi rms on ly t h at ha ve i n v es ted in th e pa rt icu la r Ea st ern Eu ro p ean c oun tr y . Un iv e rs ity a n d Col le g e G ra du a te s A ffi li at es' H ig h Sk il l P er so nne l Rat io 1) Af fi li a te t o P a re n t Sk ill R at io 2) Af fi li a te s' R & D Pe rs onn el R a ti o 3) Af fi li at e t o P ar en t R& D P er so n n el Ra ti o 4) A ffi li at es' H ig h Sk ill P er so nne l Rat io 1) A ffi li a te t o Pa re n t S k ill R a ti o 2) A ffi li a tes ' R & D Pers on n el R at io 3) R& D P er so nne l S o ur ce : Ch ai r o f In te rna tio n a l E c o no m ics , U n iv er si ty o f Mu ni ch, f ir m s ur v ey o f 220 0 i nv es tm en t pr o je c ts in E a st er n E ur o pe b y 6 6 0f ir m s 1) Nu m b er of em p lo y ees w it h u n ivers ity a n d c ollege d egree i n p er c en t of a ffili a tes ’ em p loy m en t. T h e h ig h sk ill p ers on n el rat ios ha v e be en co m put ed b y a ddi ng up a ll u niv er si ty a n d c o ll eg e gr adu a te s in af fi li at es i n a p ar ti cul ar Eas te rn E u ro pe an c o un tr y d iv id ed by to ta l af fi li at es ’ em pl o y m ent in t h at p ar ti cul ar E ast er n E ur o p ea n co u ntr y . 2) A ffi li a tes ’ h ig h s k ill p er sonn el ra ti o r ela ti ve t o p are n ts’ h ig h s k ill p erso n n el r at io. T h e p aren t h ig h s k ill p er son n el ra ti os ha v e b ee n c o m p ute d by a d di ng up al l em p loy ee s w ith uni v er si ty a n d co ll ege de g re es in G er m an pa re nt f ir m s d iv ide d by to ta l p ar ent e m pl o y m ent in G er m any . T he a ff il ia te t o p a re nt s ki ll r ati o s in co lum n ( 2) ar e co m p ute d r el at iv e to t he pa re n t h ig h s k ill p er son n el ra ti o s o f th ose G erm an p aren t fi rm s o n ly t h at ha v e in vest ed in t h e pa rti cu la r A ffi li a te t o Pa re n t R & D Pe rs onn el Ra ti o 4) Austria 17
We can provide an answer to this question by looking at the number of skilled jobs Aus-trian and German firms are creating in their affiliates in eastern Europe. How skill-intensive is the activity undertaken by Austrian and German affiliates in eastern Europe, compared to their parent activity in Austria and Germany? Table 6 gives the relevant numbers for Germany.
I use two indicators to measure the skill intensity of German affiliates in eastern Eu-rope: the share of workers with a university or college degree, and the share of person-nel engaged in R&D or engineering activities in the manufacturing and service sector. The data suggest that the high skill ratios of affiliates (the number of university or col-lege workers in percent of total affiliate workers) are two to three times as large as that of German parent firms in all three regions: CEE, SEE, and CIS. The share of university or college graduates among affiliate workers in eastern Europe varies between 86 per-cent (Czech Republic) and eight perper-cent (Slovenia). The most skill-intensive activity is undertaken by affiliates in the Czech Republic (skill share of 86 percent), in Russia (skill share of 63 percent), and in Croatia and Slovakia (skill share of 40 percent). This compares with an average share of university or college graduates of German parent firms of 18 percent only. Thus, measured by the number of university and college gra-duates, German affiliates in Bulgaria are 12 times as skill intensive as their German par-ent firms, affiliates in the Czech Republic 5.5 times as skill-intensive, and affiliates in Russia are 2.9 times as skill intensive. Only affiliates in Hungary have a skill share be-low that of German parent firms.
A similar picture emerges when the skill intensity of German affiliates is measured by the share of workers engaged in R&D and engineering (see Table 6). The R&D person-nel ratios of affiliates in eastern Europe range between 4.0 percent (Slovakia) and 27.8 percent (Croatia and Russia). This compares with an average R&D personnel share of 13.6 percent in German parent firms. Thus, German affiliates in Russia are 2.9 times as R&D intensive as their German parent firms, affiliates in the Czech Republic and Croa-tia 1.7 times as R&D intensive, and affiliates in Ukraine 1.4 as research intensive. The remaining countries affiliates’ R&D intensity is below that of German parent firms. In Table 6, I look at Austria’s export of high-skilled jobs to eastern Europe. It appears from the table that the share of university and college graduate workers as a percentage of Austrian affiliates’ workers in eastern Europe, ranges from 9.6 percent (Romania) to 34.8 percent (Russia), compared to a skill share of 14.7 percent in Austrian parent firms. Thus, only affiliates in Slovenia have a smaller employment share of university and col-lege graduates compared to Austrian parent firms. Affiliates in Bulgaria employ 26 times as many university graduates compared to the Austrian parent company, affiliates in Ukraine 19 times, and affiliates in Russia and Romania 3.7 times. Although the R&D ratios of Austrian affiliates are extremely high and much larger than those of German affiliates in eastern Europe (they range between 3.8 percent in affiliates in the Baltic states to 45.8 percent in affiliates in Russia, given in Table 6), none of the Austrian af-filiates’ research and engineering activities in eastern Europe exceed that of their Aus-trian parent firms with the exception of those in Russia. The reason for this is the ex-tremely high R&D intensity of parent firms in Austria. The high R&D intensity of par-ent firms in Austria appears large indeed since in this respect, Austrian firms outper-form German parent firms. This is quite striking.
One possible reason for this result is economic policy. The Austrian government gives major tax incentives and subsidies to R&D activity, which might have encouraged firms move more into this activity in Austria and to locate less of this activity in eastern
Eu-rope11. One indication that the large R&D ratios of parent firms in Austria are induced
by policy is the diverse pattern of the skill personnel ratios and the R&D ratios of Aus-trian affiliates in eastern Europe. Typically, when the government subsidises R&D, the R&D sector expands and competes with other sectors for skilled workers. However, when firms have the option to outsource to eastern Europe some of the activities that use skilled workers but that do not qualify for a domestic R&D subsidy (such as high-tech activity in other sectors), they can avoid competing for talent in the local labour
market12.
Take the examples of Bulgaria, Russia and Ukraine as outsourcing locations. Austrian affiliates in Bulgaria and Ukraine employ 19-26 times as many skilled workers in pro-duction as their parent firms in Austria, but only 0-14-0.27 times as many skilled work-ers in research and engineering. A similar but less striking picture emerges in Russia. Austrian affiliates in Russia use 3.7 times as many skilled workers in production and the same amount of skilled workers in R&D activity as Austrian parent firms. German affil-iates in Russia use about the same skill intensity in production, and also in research (see Table 6). In sum, affiliate activities of Austrian multinationals in eastern Europe appear to be more skill-intensive in terms of their share of university and college workers, but less skill-intensive in terms of their R&D intensity, although the R&D ratios of Austrian affiliates in some of the eastern European countries turn out to be extremely large. These are striking and puzzling numbers. Austrian and German multinationals tend to outsource the most skill- and R&D-intensive activities to eastern Europe. Why is this happening? Economic theory guides us to look at the factor endowment of these coun-tries for an answer. If councoun-tries outsource the most skill intensive activities to other countries, then these countries must be poorly endowed with skills relative to their
trad-ing partners13. Table 7 documents Austria’s and Germany’s endowment of skills
com-pared to eastern Europe. It appears from the table that the Baltic states, Russia, Hun-gary, and Bulgaria are the most skill-rich countries as measured by the share of the la-bour force with tertiary-level education. Germany’s education level lies below the OECD average and roughly matches that of the CEE countries' average. In particular, Germany is less skill rich than the Baltic states, Russia and Hungary. In this ranking of
countries, Austria turns out to be one of the least skill-rich countries14.
11
Moreover, Austria has one of highest share of state financed R&D, see Marin (1995).
12
For Austria’s R&D and technology policy and its effects see Marin (1995).
13
For a theory of multinational investment based on factor endowment differences between countries, see Helpman (1984).
14
These numbers do not say much about the quality of education in these countries. The numbers are quantitative measures of formal education only.
1998 2007 1998 2007 OECD high income countries3), average 0.16 0.26 0.77 0.74
Austria 0.07 0.18 0.91 0.82 Germany 0.15 0.24 0.76 0.76 France 0.24 0.29 0.76 0.71 Sweden 0.13 0.30 0.72 0.69 Finland 0.12 0.35 0.78 0.65 Netherlands 0.26 0.324) 0.74 0.68 United Kingdom 0.15 0.32 0.75 0.67 Italy 0.10 0.16 0.90 0.84 Norway 0.17 0.33 0.69 0.67 Japan 0.19 0.40 0.71 0.60 CEE5), average 0.14 0.23 0.74 0.77 Baltic States 0.20 0.30 0.59 0.70 Czech Republic 0.11 0.14 0.89 0.86 Hungary 0.15 0.21 0.84 0.79 Poland 0.11 0.22 0.85 0.78 Slovakia 0.11 0.15 0.57 0.85 Slovenia 0.07 0.22 0.86 0.78 SEE6), average 0.10 0.19 0.84 0.81 Bulgaria 0.12 0.24 0.82 0.76 Romania 0.08 0.13 0.88 0.87 Croatia 0.10 0.18 0.83 0.82 Russia7) 0.18 0.53 0.49 0.47
Source: International Labor Organization
1)
tertiary education (third level, first stage, leading to a first university degree or equivalent qualification + third level, second stage, leading to a post-graduate university degree)
2)
no schooling + first level + second level, first stage + second level, second stage
3)
Austria, Germany, France, Sweden, Finland, Netherlands, United Kingdom, Italy, Norway
4)
2008
5)
Hungary, Czech Republic, Poland, Slovakia, Slovenia, Lithuania, Estonia
6)
Bulgaria, Croatia, Romania
7)
In 2007 polytechnique schools have been included into tertiary education, while not being included before.
Table 7. Skill Endowment of Selected Countries
education levels in percent of the labour force
high skill1) low skill2)
What has happened to Austria and Germany – two countries known as ‘nations of poets and thinkers’ – that they rank so low among the rich OECD countries? To understand why Austria and Germany fare so poorly in an international comparison of skill en-dowment levels, we have to turn to history on the one hand, and to the accumulation of skills in the post-war period on the other.
I have estimated in Marin (1995) that the second world war and the mass killing of Jews in the Holocaust destroyed 30 percent of Austria’s human capital stock. A less conserv-ative estimate by Stadler (1987), which includes the Jewish population that was not part of Jewish communities, and the skilled non-Jewish population that went into exile, puts
the loss of Austria’s human capital stock at 67 percent. Most efforts in Austria in the post-war period went into rebuilding physical capital stock destroyed in the war. But Austria never recovered from the destruction of its human capital stock: the
accumula-tion of skills in the post-war period has not been able to make up for it15.
In Table 8, I look at the accumulation of skills in the post-war period in Austria and Germany. Table 8 reports the annual growth rates of the human capital stock per person in the two countries for the period 1960-1997. This measure of human capital is ob-tained by aggregating five education levels using the market wage of each education level as a weight. The market wage of each education level, in turn, is estimated by a
Mincer type wage equation which relates years of schooling to the hourly wage rate16.
The table shows that human capital accumulation dramatically slowed in the 1990s in both countries. In Germany, the annual growth rate of the human capital stock per per-son declined from 0.75 percent in the 1980s to 0.18 percent in the 1990s. This is a slow-ing down of the annual growth rate of more than two-thirds. In Austria, the annual growth rate of the skilled stock more than halved between the 1980s and 1990s from 0.37 percent to 0.15 percent. Thus, in the 1990s when trade integration with the former communist countries and the revolution in information technology put pressure on the demand for skilled labour, the supply of skilled labour almost came to a halt in both countries. This has generated a dramatic scarcity of human capital in both countries.
Austria Germany
1960-1980 0.45 0.85
1980-1990 0.37 0.75
1990-1997 0.15 0.18
1960-1997 0.37 0.69
Source: Koman and Marin (2000)
annual growth rates in percent
Table 8. Human Capital Stock per Person
15
I am not aware of a similar estimate for Germany.
16
For details on the estimation procedure see Koman and Marin (2000). 21
7. A reverse pattern of ‘maquiladoras’ in Austria and Germany?
These numbers suggest that the source of the problem is the relative scarcity of human capital in Austria and Germany. Austrian and German firms move the most skill-intensive activities to eastern Europe because they cannot find the skilled workers in their labour markets.
This move toeastern Europe may explain why the wage gap between skilled and un-skilled workers remained constant during the 1990s in Germany despite the informa-tion revoluinforma-tion and trade integrainforma-tion with eastern Europe.
Figure 2 gives the ratio of skilled to unskilled wages in the 1990s in Austria and Ger-many on the one hand and in the Czech Republic, Hungary and Poland on the other. We use as a proxy for the skill-wage ratio relative wages of non-production to production workers. The data show a strong increase in the relative wage for skills in Poland and the other accession countries during the 1990s, while this ratio remained constant in Germany and declined somewhat in Austria. These data do not show a pattern of factor prices that trade economists usually expect from trade and investment integration. Take the example of Germany and Poland. Typically, when a skill-rich country such as Ger-many (relative to Poland) integrates with a skill-poor country such as Poland (see Table 7), we expect relative wages for skills to go up in Germany and to decline in Poland. The reason is that trade integration leads a country to specialise in those sectors that use the country’s abundant factor intensively. Thus, skill-rich Germany specialises in the skill-intensive sectors and labour-rich Poland specialises in labour-intensive sectors. As a result the relative demand for skills goes up in Germany and declines in Poland, lead-ing to an increase in the relative wage for skills in Germany and to a decline of those in Poland. By the same argument, in skill-poor Austria relative wages for skills are ex-pected to decline with trade integration with eastern Europe.