Part 2
The following member country profile is an excerpt from Chapter 4
of the publication Energy Supply Security 2014 and is not intended
as a stand-alone publication.
ENERGY SUPPLY SECURITY 2014
CHAPTER
4
: Emergency response systems of individual IEA countries
The ability of the International Energy Agency (IEA) to co-ordinate a swift and effective international response to an oil supply disruption stems from the strategic efforts of member countries to maintain a state of preparedness at the national level. Energy security is more than just oil, as the role of natural gas continues to increase in the energy balances of IEA countries. The most recently completed cycle of Emergency Response Reviews (ERRs) reflected this change by assessing, for the first time, the member countries’ exposure to gas disruptions and their ability to respond to such crises. This chapter provides general profiles of the oil and natural gas infrastructure and emergency response mechanisms for 29 IEA member countries.
Each country profile is set out in the following sequence: Key data
Key oil data, 1990-2018
Key natural gas data, 1990-2018
Total primary energy source (TPES) trend, 1973-2012 Infrastructure map
Country overview
OIL
Market features and key issues Domestic oil production Oil demand
Imports/exports and import dependency Oil company operations
Oil supply infrastructure Refining
Ports and pipelines Storage capacity
Decision-making structure Stocks
Stockholding structure Crude or products Location and availability Monitoring and non-compliance Stock drawdown and timeframe Financing and fees
Other measures Demand restraint Fuel switching Other
GAS
Market features and key issues Gas production and reserves Gas demand
Gas import dependency Gas company operations Gas supply infrastructure Ports and pipelines Storage
Emergency policy
INTERNATIONAL ENERGY AGENCY
The International Energy Agency (IEA), an autonomous agency, was established in November 1974. Its primary mandate was – and is – two-fold: to promote energy security amongst its member countries through collective response to physical disruptions in oil supply, and provide authoritative research and analysis on ways to ensure reliable, affordable and clean energy for its 29 member countries and beyond. The IEA carries out a comprehensive programme of energy co-operation among its member countries, each of which is obliged to hold oil stocks equivalent to 90 days of its net imports. The Agency’s aims include the following objectives:
n Secure member countries’ access to reliable and ample supplies of all forms of energy; in particular, through maintaining effective emergency response capabilities in case of oil supply disruptions.
n Promote sustainable energy policies that spur economic growth and environmental protection in a global context – particularly in terms of reducing greenhouse-gas emissions that contribute
to climate change.
n Improve transparency of international markets through collection and analysis of energy data.
n Support global collaboration on energy technology to secure future energy supplies and mitigate their environmental impact, including through improved energy
efficiency and development and deployment of low-carbon technologies.
n Find solutions to global energy challenges through engagement and dialogue with non-member countries, industry, international
organisations and other stakeholders. IEA member countries:
Australia Austria Belgium Canada Czech Republic Denmark Estonia Finland France Germany Greece Hungary Ireland Italy Japan
Korea (Republic of) Luxembourg Netherlands New Zealand Norway Poland Portugal Slovak Republic Spain Sweden Switzerland Turkey United Kingdom © OECD/IEA, 2014
International Energy Agency 9 rue de la Fédération 75739 Paris Cedex 15, France
www.iea.org
2014
Belgium
Key data
Table
4.3.1
Key oil data
1990 2000 2005 2010 2011 2012 2018*
Production (kb/d) 0.0 0.0 0.0 0.0 0.0 0.0 0.0
Demand (kb/d) 335.7 362.0 359.6 335.9 324.1 310.8 286.7
Motor gasoline 96.4 91.8 94.0 79.0 73.3 66.1
Gas/diesel oil 107.3 111.0 102.3 106.8 114.9 113.5
Residual fuel oil 49.6 55.6 57.5 55.0 43.0 39.3
Others 82.3 103.6 105.7 95.0 93.0 92.0 -Net imports (kb/d) 335.7 362.0 359.6 335.9 324.1 310.8 286.7 Import dependency (%) 100 100 100 100 100 100 100 Refining capacity (kb/d) 428.0 427.0 434.0 442.7 442.7 442.7 -Oil in TPES** (%) 30 29 27 27 28 26 -* Forecast.
** TPES data for 2012 are estimates.
Table
4.3.2
Key natural gas data
1990 2000 2005 2010 2011 2012* 2018** Production (mcm/y) 0 0 0 0 0 0 0 Demand (mcm/y) 616 805 820 1 564 1 303 1 130 1 302 Transformation 235 297 255 818 544 0 Industry 287 344 375 481 486 0 Residential 39 86 51 85 78 0 Others 55 78 139 180 195 0
-Net imports (mcm/y) 616 805 820 1 564 1 303 1 130 1 302
Import dependency (%) 100 100 100 100 100 100 100
Natural gas in TPES (%) 1 2 2 3 2 2
-* 2012 data are estimates. ** Forecast.
Note: This section on the emergency response systems of individual member countries was written by the IEA. All countries provided valuable information and comments. All opinions, errors and omissions are solely the
Figure
4.3.1
Total primary energy source (TPES) trend, 1973-2012
0 10 000 20 000 30 000 40 000 50 000 60 000 70 000 1973 1975 1977 1979 1981 1983 1985 1987 1989 1991 1993 1995 1997 1999 2001 2003 2005 2007 2009 2011 ktoe Hydro/renewables/other Nuclear Natural gas Oil Coal2014
Map
4.3.1
Oil infrastructure of Belgium
PALL CEPS RMR RRP Lux embourg Germany The Netherlands Lux embourg City Brussels Antwerp Ghent K ortrijk R onse Tournai Feluy Zeebrugge Vlissingen BELGIUM Maastricht Crude oil pipeline Oil products pipeline R efinery Km 04 08 0 Oil storage site RAPL 575 kb/d Gelsenkirchen Tanker terminal Liege This map is without prejudice to the status of or sovereignty over any territor y, to the delimitation of international frontiers and boundaries and to the name of any territor y, city or area.
Map
4.3.2
Gas infrastructure of Belgium
H-cal gas pipelines L-cal gas pipelines Transit pipelines LNG terminals Compressor stations Storage Blending stations Qatar This map is without prejudice to the status of or sovereignty over any territory , to the delimitation of international frontiers and boundaries and to the name of any territory , city or area.
2014
Country overview
Oil and natural gas provide two-thirds of Belgium’s primary energy supply. While total energy use in Belgium is expected to decline slightly in the coming decades, natural gas demand will increase as new power generation capacity to replace ageing power facilities will be mainly gas-fired by 2020.
With no domestic oil or natural gas production, Belgium is fully dependent on imports. Yet, because of its geographical location and infrastructure, Belgium plays an important role in Europe’s oil and gas supply chain. In the case of natural gas, Belgium is a major hub of gas flows in the region, with some 80 billion cubic metres (bcm) transiting the country each year, compared to domestic consumption of 18 bcm/year (2012). Oil demand in Belgium is dominated by middle distillates, which represent 44% of the oil products consumed in the country (2012).
Belgium’s primary response measure in an oil supply disruption is the use of public oil stocks. Belgium’s public stockholding agency, Agence de Pétrole– Petroleum Agentschap
(APETRA), began operations in 2007. Until its creation, Belgium relied entirely on its domestic oil industry to meet its International Energy Agency (IEA) stockholding obligation. This was done by placing a minimum stockholding obligation on oil importers based on EU regulations regarding the three main product categories. With the creation of APETRA, the obligation on industry was reduced from covering the full stockholding obligation to only 15 days for an initial 5 years, with an annual reduction of three days until 1 April 2012. In April 2012, APETRA became fully responsible for meeting Belgium’s national stockholding obligations.
The country has a robust transport network for natural gas that is well integrated with that of other countries through 18 entry points. However, it lacks significant storage capacity. The government relies upon its system operator, Fluxys, to maintain emergency plans for maintaining security of supply.
Oil
Market features and key issues
Domestic oil production
Belgium has no indigenous oil production and is thus 100% dependent on imports.
Oil demand
Demand in Belgium stood at 617.8 kb/d in 2012 and at 622.6 kb/d in 2011, the latest year for which data are available for consumption by sector. In 2011, 45% of total consumption was used in the transportation sector and 32% was consumed by industry. The residential sector, commercial, agriculture and other sectors used 17% of the total, while only 6% was used in the transformation sector for energy generation.
Figure 4.3.2
Oil demand by product, 1998-2012
0 100 200 300 400 500 600 700 800 1998 2000 2002 2004 2006 2008 2010 2012 kb/d Other products Residual fuels Other gasoil Diesel Jet and kerosene Motor gas Naphtha LPG and ethaneResidual fuel oil plays a significant role among the energy products used in Belgium (100 kb/d in 2012, but 188 kb/d in the peak years of 2007 and 2008), being overtaken by diesel only in 2009 and by naphtha in 2012. Of the vast majority of the residual fuel oils, 90%, go to international marine bunkers, fuelling international seagoing ships. The remainder is mainly used for industrial purposes and power generation; however, demand is declining because of environmental concerns and greater use of natural gas. Naphtha is also a large component of the country’s oil demand (102 kb/d in 2012) as Belgium is one of the main petrochemical hubs in Europe. The use of diesel has been steadily growing in the past years with the exception of 2011 and 2012. In the peak year of 2010, 151 kb/d of diesel was used, with a decline to 147 kb/d in 2012.
Figure 4.3.3
Oil consumption by sector, 1973-2012
0% 10% 20% 30% 40% 50% 60% 70% 80% 90% 100% 1973 1975 1977 1979 1981 1983 1985 1987 1989 1991 1993 1995 1997 1999 2001 2003 2005 2007 2009 2011 Commercial/agriculture/other Residential Industry Transport Transformation
2014
Imports/exports and import dependency
In 2012 crude oil imports came primarily from the Russian Federation (234 kb/d), Saudi Arabia (145 kb/d), Nigeria (93 kb/d) and Norway (47 kb/d). In 2002, Russia rose to be the single most important source of crude oil in Belgium (27% of total) and its importance has continued to grow ever since (37% in 2012).
While fully dependent on crude oil imports, Belgium is an overall net exporter of refined products. Belgian refinery output is traded across much of Europe; Belgian refineries supply two-thirds of Luxembourg’s product import requirements and, given their proximity to the Amsterdam/Rotterdam/Antwerp (ARA) barge market and the Rhine and product pipelines, jet kerosene, gas/diesel oil and gasoline are exported to Germany (48 kb/d), France and Switzerland. At the same time, Belgium imports significant quantities of gas/diesel oil from the Netherlands and, to a lesser extent, from Russia. A decade ago, Belgium increasingly became a net importer of fuel oil to meet growing international bunker fuel demand – an increase from 3.3 kb/d in 2002 to a peak 68 kb/d in 2008. Since then, however, the trend has reverted because of the economic crisis and in 2012 Belgium became a net exporter of fuel oil again, with net exports of 4.8 kb/d.
Oil company operations
Four companies operate in the Belgian refining industry: Total, ExxonMobil, Gunvor and Antwerp Terminal and Processing Company (ATPC, VTTi Group). Gunvor replaced Petroplus in 2012 as owner of the Independent Belgian Refinery (IBR), formerly called Belgian Refining Corporation (BRC). Altogether, 20 companies, including majors and independents, import oil, while between 700 and 800 distributors, primarily small companies delivering heating oil, operate on the Belgian market.
Figure 4.3.4
Crude oil imports by origin, 2012
Russian Federation 37% Saudi Arabia 23% Nigeria 14% Norway 7% United Kingdom 5% Other 14%
Oil supply infrastructure
Refining
Belgium’s four refineries – all located in Antwerp – have a total crude distillation capacity of over 790 kb/d (39 million tonnes per year). The most notable change in refinery activity in recent years is the increase of desulphurisation capacity, which reflects EU specifications to reduce sulphur content for gasoline and diesel, including the move in January 2009 to 10 parts per million (ppm).
The two major refineries, owned by Total (357 kb/d) and ExxonMobil (298 kb/d), are world class refineries capable of producing a relatively high yield of light and middle distillates. The third, purchased in 2012 by Gunvor from Petroplus, is the smallest and least complex of the three; however, investment in hydro-treating has given it the capacity to produce 10 ppm (parts per million) diesel from a predominantly sour crude slate. The fourth refinery, recenty acquired by the VTTi group, is an asphalt plant with a capacity of approximately 21 kb/d.
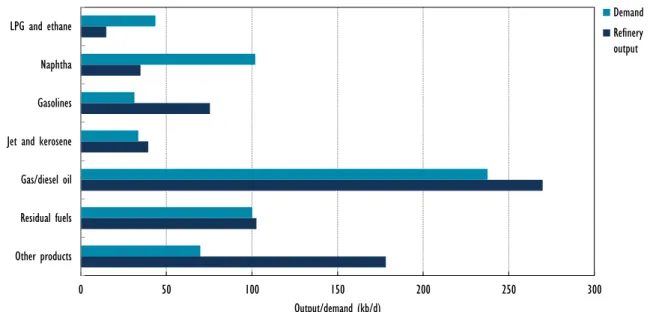
In 2012, the country’s refined product output totalled 715.2 kb/d and the capacity utilisation rate of Belgium’s refineries was 89%. The composition of production was gas/ diesel oil (38%), motor gasoline (11%), residual fuel oil (14%) and naphtha (5%). Belgian refineries are able to meet domestic demand for residual fuels, diesel, jet kerosene and gasoline. The production falls short on naphtha, liquefied petroleum gas (LPG) and ethane.
Ports and pipelines
The Port of Antwerp is Belgium’s main sea port for oil trade. According to the Antwerp Port Authority, maritime cargo trade of crude oil and products reached nearly 34.6 million metric tonnes (Mt) in 2012. The trade turnover of crude oil shows a significant and steady decrease compared to 2000 levels, when it amounted to 8.1 Mt., dropping to its lowest level since 1985. Trade in products shows the opposite trend, growing from 20.2 Mt in 2000 to 32 Mt in 2012.
The main crude oil pipeline serving Belgium is the Rotterdam-Antwerp pipeline (RAPL), which originates in Rotterdam (the Netherlands) and travels into the Antwerp area. It has a capacity of 575 kb/d.
Apart from inland waterways, a key method for transportation of oil products in Belgium is via the Central European Pipeline System (CEPS). The CEPS is a North Atlantic Treaty Organization (NATO) pipeline network in Europe comprising 6 000 km of pipeline interconnected to roughly 8.2 mb (1.3 mcm) of oil storage capacity. NATO maintains this distribution system primarily to provide fuel supply support to military bases. However, for many years, the pipeline’s surplus capacity has been leased for civilian storage, transportation and delivery of oil products. The contracts signed between NATO and the oil companies are based on market prices and supervised by the Ministry of Economic Affairs.
Storage capacity
There are over 40 oil storage facilities in Belgium, with a total combined capacity of just over 12 mcm or 75 million barrels (10.2 million tonnes of crude equivalent). This includes capacity used by industry for normal operations as well as storage capacity used by APETRA for strategic reserves. APETRA is the sole manager of Belgian strategic oil stocks since April 2012, taking over all obligations from industry.
Nearly 1.3 million cubic metres of the capacity are reserved for APETRA, with 380 thousand mcm added in 2012 and another 470 thousand mcm that became operational in 2013. This additional capacity was reached both through expansion of existing facilities and the construction of new facilities.
2014
Figure 4.3.5
Refinery output vs. demand, 2012
0 50 100 150 200 250 300
Other products Residual fuels Gas/diesel oil Jet and kerosene Gasolines Naphtha LPG and ethane Output/demand (kb/d) Demand Refinery output
Decision-making structure
Emergency response policy is the responsibility of the minister in charge of energy, in consultation with the Council of Ministers. Under the Minister for Energy, the General Directorate for Energy, within the framework of the National Oil Board, serves as the core of the national emergency strategy organisation (NESO). This team is responsible for maintaining and implementing emergency response measures in a supply disruption, for monitoring the domestic oil and gas markets and for data collection.
The National Oil Board (NOB) was created by the Royal Decree of 11 October 1984 and is charged with the supply and distribution of oil products in time of crisis. It also serves as Belgium’s NESO.
The permanent unit of the NOB is situated within the framework of the General Directorate for Energy. In a crisis, it can be expanded to include experts from the Department of Economic Affairs, other ministerial departments, the oil stockholding agency APETRA and the oil industry. All proposed measures would have to be considered by the Inter-Ministerial Economic Commission (CEI), which represents various government departments. The Minister of Energy would then submit the proposals to the Council of Ministers for final approval.
The NOB’s main tasks in case of a supply disruption are to identify vital points (e.g. refineries, pipelines, storage), propose possible crisis measures (e.g. stock, demand restraint) and to determine essential users. The NOB has three stages of operations in a crisis:
Monitoring Phase: to monitor market developments and update information required
for the implementation of crisis measures.
Active Phase: to propose measures to the Council of Ministers.
Operational Phase: Implementation of measures and communication with other
Stocks
Stockholding structure
Until 2007, Belgium relied entirely on its domestic oil industry to meet its IEA stockholding obligation.
In January 2006 Belgium passed legislation (the Law of 26 January 2006) which created the public stockholding entity APETRA and established a schedule for shifting stockholding responsibilities from industry to the public agency. APETRA’s first year of operation began on 1 April 2007. As of this date, the obligation on industry was reduced from covering the full stockholding obligation to only 15 days, gradually being reduced by three days each year until 1 April 2012, at which time APETRA became fully responsible for meeting Belgium’s national stockholding obligation.
Crude or products
APETRA may hold its share of compulsory stocks as either refined products or crude oil. The legislation limits the amount of crude oil held by APETRA to 50% of all owned stocks. If APETRA purchases crude oil towards its stock obligation, it must fix both refining yields and refining costs for that crude with a Belgium refinery that will process the crude in the event of an emergency stockdraw.
Location and availability
APETRA may fulfil its stockholding responsibilities through oil stocks it directly owns (purchased by tender) or by obtaining stockholding (ticket) contracts with industry, either domestically or abroad under bilateral agreements.
APETRA stocks may be held by both Belgian and foreign oil companies and retained within their normal operating systems. Up to a maximum of 30% can be kept abroad under bilateral agreements. Belgium has such agreements with France, Germany, Ireland, Luxembourg, the Netherlands and the United Kingdom.
Monitoring and non-compliance
APETRA must inform the Energy Directorate for Energy of the Ministry of Economic Affairs and Energy of the location and composition of their stocks. This information must be reported by the 15th day of each month, describing stocks held at the beginning of that month. The minister may authorise physical checks to ensure full compliance with all the provisions of the legislation. Penalties for infringements range from fines to imprisonment for up to one year.
All of APETRA’s operations are subject to direct control by the Ministry of Energy.
Stock drawdown and timeframe
In the event of an oil supply disruption, the Minister of Energy has the legal authority to draw down oil stocks. The minster would direct APETRA to draw down its emergency stocks.
APETRA has put in place agreements with a number of refineries, referred to as the Crude Against Product Agreement (CAPA). In times of crisis, this allows the simultaneous sale of crude oil from APETRA and the purchase of products by APETRA. Within the contract for delivery, products would be delivered within 10 days and not later than 30 days from
2014
Storage contracts stipulate that the delivery of stocks must begin within 24 hours of a request by APETRA, while the totality of the stocks must be delivered within 30 days. Ticket contracts with APETRA specify that delivery of finished product must be guaranteed within 30 days (if ticketing on crude oil) and 7 days for tickets on product.
Financing and fees
APETRA’s activities are financed through fees levied on all quantities of the relevant products delivered into domestic consumption. Every oil company that pays excise and national taxes on oil products must also pay levy fees to APETRA. The base calculation for the APETRA fees, which has been decided by the government and promulgated by royal decree, reflects several cost factors such as renting or writing off stockholding capacity, renewing the product, the external and internal control of the stocks, and the interest paid on bank loans.
APETRA finances its own purchases of crude/products through bank loans.
Other measures
Demand restraint
Belgium does not have a specific contingency plan to implement demand restraint measures in a disruption, but has at its disposal a number of dormant decrees which the Minister of Energy could activate after deliberation by the Council of Ministers. Possible measures include:
speed limits
driving restrictions (e.g. bans on Sundays, pair- or impair number plates) or complete driving ban
rationing of distribution of fuel oil rationing of the distribution of motor oil restriction of exportation of certain oil products.
There are no volumetric estimates for each of the separate demand restraint measures, but the total impact of all measures is estimated to be less than 5% of total oil consumption.
The NOB has compiled a crisis management manual that includes updated lists of the priority end-users of petroleum products. These lists serve as a reference for drawing up ministerial decrees regarding demand restraint measures that focus on specific products or consumer groups.
Fuel switching
Fuel switching in Belgium is driven primarily by market prices and is not subject to any legal obligations. The use of oil has been declining in power generation. It accounts for less than 1% of power supply and is expected to be eliminated completely in the near future. Thus, there is little potential for fuel switching in the power sector.
Other
With no domestic crude oil production, surge production is not an available response measure.
Gas
Market features and key issues
Gas production and reserves
Belgium has no indigenous gas production and therefore relies on imports to supply all its domestic requirements. Its strategic location between the sources of European gas to its north and west, and their primary markets to the south and east, makes the country pivotal for the trade of gas in Europe.
Gas demand
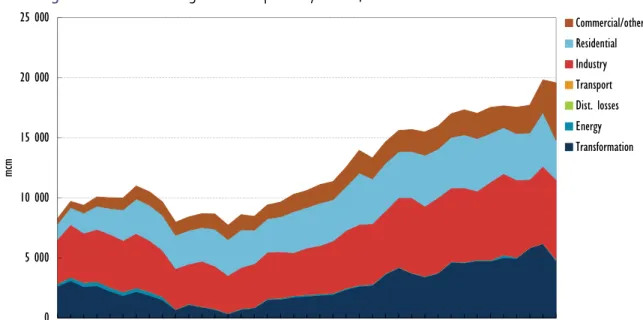
Demand for natural gas was just nearly 18 billion cubic metres (bcm) in 2012. In 2011, industry, primarily related to petrochemical activities, consumed 34% of this amount. Electricity generation made up 25% of gas consumption, and household demand accounted for another 17%.
Figure 4.3.6
Natural gas consumption by sector, 1973-2011
0 5 000 10 000 15 000 20 000 25 000 1973 1975 1977 1979 1981 1983 1985 1987 1989 1991 1993 1995 1997 1999 2001 2003 2005 2007 2009 2011 mcm Commercial/other Residential Industry Transport Dist. losses Energy Transformation
Natural gas is the second main source of fuel for the electricity generated in Belgium (18% in 2011), after nuclear (65% in the same year). Demand for gas in the use of power generation is expected to increase sharply in the coming years. This is caused by the fact that most of the new power generation to replace ageing power facilities by 2020 will be gas-fired.
Gas import dependency
Imports are fairly diversified by origin and type of supply: Norway (36% in 2012) and the Netherlands (26% in 2012), each representing about one-third of total imports, are the principle pipeline suppliers, while Qatar (12% in 2012) is the main source of liquefied natural gas (LNG) imports.
2014
Figure 4.3.7
Natural gas imports by source, 2012
Norway 36% Netherlands 26% Qatar 12% Other 26%
There are two qualities of natural gas in Belgium: H-gas (high calorific) and L-gas (low calorific). H-gas supplies most of the country’s demand, but L-gas is used by a quarter of the country’s consumers and supplies certain regions exclusively, including Antwerp, Limburg, Flemish Brabant, Walloon Brabant and Hainaut, and Brussels. L-gas is transported from the Dutch Slochteren field on a network that is physically separate from the H-gas network.
Gas company operations
In 2006 Fluxys was appointed by law as the only operator of the natural gas transmission grid and the natural gas storage facility. Fluxys LNG is the sole operator of the LNG facility at the Zeebrugge port. There are 18 suppliers active on the Belgian market (in 2012). However, in 2012, the three most prominent authorisation holders supplied nearly 80% of the market: Eni Gas & Power (41 %), GDF Suez/Electrabel (28%) and EDF Luminus (10%).
The Belgian government has no ownership in the upstream/downstream sectors but still has a golden share of the transmission system operator (Fluxys) and the major supply company (Eni Gas & Power, formerly Distrigas).
Gas supply infrastructure
Ports and pipelines
Fluxys, Belgium’s transmission system operator (TSO) has a network of more than 4 000 km of pipelines with 18 interconnection points. This is used both to transport natural gas for consumption in Belgium (17.9 bcm in 2012) and for transit of some 4 bcm of gas to other end-user markets. The Fluxys network delivers gas to power stations and large industrial end-users directly, and supplies the grids of the 18 distribution system operators which deliver gas to residential and small to medium-sized industrial users. The Zeebrugge port has an LNG regasification facility (operated by Fluxys) with a capacity of 9 bcm per year. At the same time, Zeebrugge serves as a crossroads of two major axes in European natural gas flows, as both the Zeepipe terminal (natural gas coming from Norway) and the interconnector terminal (natural gas coming from or going to the United Kingdom) are situated in the harbour zone. This allows the flow of gas on the east/west axis from Russia to the United Kingdom and the north/south axis from Norway to Southern Europe.
Zeebrugge also has a key commercial role in the natural gas trade as one of Europe’s leading international spot markets for natural gas. More than 78 members are active on the hub and approximately 65 bcm of natural gas was traded on the hub in 2012, equivalent to over 4 times the annual consumption rate for the Belgian market.
The transit of gas through Belgium is via the major two-way, high-pressure pipeline systems connecting Belgium to its neighbours. The VTN-RTR pipeline runs from west to east linking the United Kingdom with Germany. Lines also run from east to south linking the North Sea and the United Kingdom to France and from north to south, linking the Netherlands with France.
Storage
An aquifer in Loenhout (operated by Fluxys) is used to compensate for seasonal swings in purchase contracts and is the only facility exclusively destined for storage. Loenhout’s capacity is 725 mcm of H-gas, of which 20 mcm is reserved for Fluxys for balancing of the network; it has a peak output capacity of 15 mcm/day. Short-term storage is available at Zeebrugge.
There is no storage for L-gas in Belgium. The Slochteren field itself is used to compensate for the lack of L-gas storage through the use of flexible, long-term contracts with the Netherlands.
Emergency policy
The federal agency for supplying natural gas (the Agency), under the responsibility of the Minister for Energy, forms a crisis team that is responsible for the co-ordination of emergency planning and communication with various government agencies and supranational institutions. The Agency also works as a liaison body between the TSO (Fluxys), the natural gas companies, government bodies, the European Commission and other EU member states in the event of a natural gas supply disruption.
Fluxys is given the responsibility for maintaining crisis mechanisms through a royal decree on public service obligations related to natural gas (23 October 2002). This includes the requirement to have an emergency plan and backup plan, to be updated every two years. It also includes a code of conduct which contains a range of operational and administrative guidelines for users of the gas network.
Fluxys maintains an emergency plan for ensuring the integrity of its grid (maintaining line pressure and gas quality). In the case of significant loss of gas supply, the TSO looks to balance the network by shifting gas through its various entry points. In doing this, it maintains an “interruption plan” for cutting supply to end-users for short periods of time. Fluxys estimates it is able to compensate for the full loss of gas through its largest entry point for the duration of six hours, during which time the affected shippers should reallocate their supplies through alternative entry points or take other measures to compensate for the loss. In case the shippers are unable to react sufficiently during that period, Fluxys would begin cutting off supplies to specific end-users based on an interruption hierarchy that takes into account safety and alternative sources. This begins with power plants, then industry users.
The federal regulator, Commission de Régulation de l’Electricité et du Gaz (CREG), monitors the natural gas market and has powers to approve transportation and distribution tariffs and other regulated assets. Thus, any plans of Fluxys to increase capacity for dealing with supply disruptions would have to be approved by CREG in order to pass
2014
also have legal powers to monitor the distribution of natural gas and ensure compliance with regional public service obligations.
Emergency response measures
There is no strategic storage of natural gas in Belgium; all gas stocks in Belgium are held by industry for commercial purposes.
According to the EU Regulation 994/2010 (on the security of supply of natural gas), gas distributors must be able to supply protected customers for a 7-day peak period in extreme temperatures, for at least 30 days of exceptionally high demand, as well as for at least 30 days in the case of disruption of the single largest gas infrastructure. Belgium has yet to accommodate for these requirements in national legislation.
There is no demand restraint programme in place in Belgium in order to rapidly reduce gas use in the short term during a gas supply disruption.
There is no programme in place in Belgium to encourage or otherwise require users of gas to switch to other fuel sources in the event of a gas supply disruption.