Using Visualization of Convolutional Neural
Networks in Virtual Reality for Machine Learning
Newcomers
Nadine Meissler∗†, Annika Wohlan∗, Nico Hochgeschwender∗‡, and Andreas Schreiber∗ ∗Intelligent and Distributed Systems
German Aerospace Center (DLR) Cologne, Germany †Faculty of Media
University of Applied Sciences D¨usseldorf D¨usseldorf, Germany
‡Department of Computer Science University of Applied Sciences Bonn-Rhein-Sieg
Sankt Augustin, Germany
[email protected], [email protected], [email protected], [email protected]
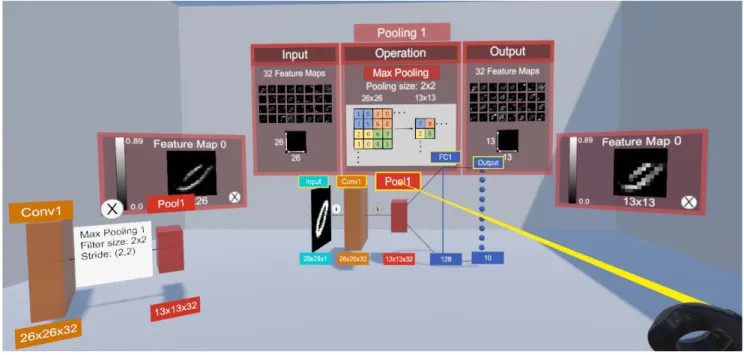
Fig. 1. Visualization of Convolutional Neural Networks (CNNs) in a virtual environment.
Abstract—Software systems and components are increasingly based on machine learning methods, such as Convolutional Neu-ral Networks (CNNs). Thus, there is a growing need for common programmers and machine learning newcomers to understand the general functioning of these algorithms. However, as neural networks are complex in nature, novel presentation means are required to enable rapid access to the functionality. For that purpose, we examine how CNNs can be visualized in Virtual Reality (VR), as a virtual environment offers the opportunity to focus users on content through effects such as immersion and presence. With a first exploratory study, we confirmed
that our visualization approach is both intuitive to use and conductive to learning. Moreover, users indicated an increased motivation to learning due to the virtual environment. Based on our findings, we propose a follow-up study that specifically compares the benefits of a virtual visualization approach to a traditional desktop visualization.
Index Terms—neural networks, visualization, virtual reality, knowledge learning
I. INTRODUCTION
Deep neural network architectures have demonstrated tremendous performance in prediction and classification tasks on a various sort of data such as images, text and speech, and video data. Thus, learning-based approaches are becoming an essential element of every day software systems ranging from recommender systems to speech recognition systems. However, given the size and complexity of non-trivial net-works, they are often considered as black-box function approx-imators. While explainability, interpretability and transparency of neural networks is a research field in itself [1] we aim to enable non-experts to obtain a basic understanding of the functionality of neural networks. To do so, we present and evaluate a visualization concept ofConvolutional Neural Networks (CNN) in Virtual Reality (VR; Figure 1). Previous visualization approaches for neural networks are either
• tailored to developers of machine learning systems (e.g., TENSORFLOW’s [2] visualization toolkit TENSOR -BOARD1),
• require detailed prior knowledge such as an understand-ing of the underlyunderstand-ing learnunderstand-ing processes or significant cognitive effort [3], or
• not targeting VR but focus on interactive 2D visualiza-tion [4].
We see the need to visualizing artificial neural networks for a specific target group, that are computer scientists who need to understand the basics of neural networks, but not necessarily the entire concepts in detail. Since there is nowadays a strong interest in integrating VR in everyday working life, we discuss the opportunities of interactive visualizations of CNNs in an virtual environment. Hence, our main goal is to get insights in how the use of virtual reality technology creates new visualization possibilities that facilitate the learning process of understanding artificial neural networks.
Our main contributions are:
• We briefly describe necessary background on perception and cognition in VR (Section III).
• We examine how CNNs can be visualized in VR, as it offers the opportunity to focus users on content through effects such as immersion and presence (Section IV). • We give some details on our software prototype
(Sec-tion V).
• We give results of a first exploratory study, which con-firms that our visualization approach is both intuitive to use and conductive to learning (Section VI).
II. RELATEDWORK
There are several techniques to visualize results of neural networks.Saliency mapsare a method of segmentation and are used to highlight certain areas in a picture. Simonyan et al. [5] use saliency maps to project the activation of neurons onto the input picture. This way they can verify that the correct object on a picture is used for the classification. The picture can
1https://www.tensorflow.org/tensorboard/
be altered to watch changes in the classification progress, as well. Methods such asGuided BackProp[6] orDeConvNet[7] project activation of neurons, too, but they are used to visualize activation patterns and to createfeature maps.
Kindermans et al. [8] point out that those projections are not convenient enough for explanations of results because this techniques would just visualize the signal-to-noise ratio of the input. Their own method, PatternNet, replaces the weights of the model for the projection which enhances the results.
PatternAttributioncan visualize the effect of the classification process for each neuron withheat maps.
Class Activation Mapping (CAM)by Zhou et al. [9] uses a heat map such as PatternNet but enhances this map with information which class was detected in a certain region and with its probability.t-SNE[10] plots are used to visualize and cluster data points. The dimensions are reduced and the points are placed in a 2D- or 3D-space based on their similarity. For neural networks, used vectors can be visualized and wrongly placed data points are visible. This provides hints for possible errors.
Kahng et al. [11] presented different design requirements for software which should visualize neural networks. Different kind of data should be supported such as text, audio, or images. The amount of data should be reducible and a software should be capable of visualizing complex model architectures. It would be important that the software is generalizable to extend the kind of models. For a user it should be possible to choose the dataset and keep track of the input through the whole neural network.
Olah et al. [12] proposed requirements and techniques which should help to better comprehend neural networks. With
feature visualizationeach neuron gets its own representation. These representations should help to understand which fea-tures a certain neuron detects. They can be ordered for each pixel by their activation values as semantic dictionaries. For each layer, semantic dictionaries can be projected onto the input image to visualize which features were detected per pixel. Comparing the projections of each layer, it is visible how the neural network transforms the input image. To include the activation values the images of the neurons can be scaled and the predictions for the classification can be included as well. The explorable activation atlas by Carter et al. [13] is based on feature inversion to visualize millions of activations from an image classification network.
Virtual Reality with head-mounted displays is used to-day in various application domains, ranging from gaming to educational context. For instance, VR applications can be used in industry to train employees, as this can prevent the breakdown of machines during learning units [14]. Moreover, there exist VR applications that can be used as a learning medium in the engineering domain [15]. It has been shown that a virtual learning environment is able to provide better learning outcomes than traditional teaching [16]. For instance, it is obvious to present vivid systems like the solar system in VR to make it more comprehensible to users [17].
such as CNNs via VR, as users perceive virtual worlds as attractive learning environments [18]. For instance, Bock et al. [19], [20] developed a 3D visualization of deep learning algorithms for experts and non-experts with an interactive user interface that allows interactive exploration on different levels of detail. However, this concept has not yet been implemented and evaluated in a virtual environment.
III. VISUALIZATION OFNEURONALNETWORKS A. Perception and Cognition in Virtual Reality
Effective visualization approaches should take into account human limitations in perception and information processing. Since even tasks such as browsing and searching on a desktop visualization require a certain cognitive activity, a simplifi-cation of the complex information of CNNs in VR must be achieved to avoid cognitive overload during the learning process. Therefore, we concentrate on the opportunities given by a virtual environment that facilitates learning. The follow-ing psychological considerations will affect our visualization concept substantially.
The outstanding feature of VR is the ability to foster higher level ofimmersion than other media. Immersive VR puts the user in an environment that resembles the real world and feels to some extent like it, with the person having a sense of self-localization [21]. Hence, immersive virtual reality enables a fundamentally different kind of communication between com-puter and human being as the user moves freely in the virtual environment, explores it through head and eye movements and is able to interact with the objects by grasping [21]. An immersive environment positively influences spatial perception and enables users to perceive spatial features more precisely than in a non-immersive environment [22]. Witmer and Singer express the assumption that immersive environments are better suited as training/learning applications than standard computer programs in this area [23]. Indeed, it has been shown that visualizing the phenomena of special relativity in a highly immersive environment lead to increased knowledge among the users [24]. Immersive VR has significant potential for simulations and e-learning purposes, as immersive VR is superior to desktop VR to stimulate, inspire and motivate users. Those emotional responses not only foster an increased use but positively influences affective and cognitive factors such as learning outcome [23].
A term that follows the term immersion ispresencethat can be defined as the subjective feeling of being in a place or an environment, although one is physically somewhere else [23]. Thus, presence in VR describes the sensation of being in the virtual world or at least of having a convincing perception of the virtual world as part of the real world. Presence affects the intrinsic motivation and enjoyment which positively correlates with satisfaction and learning outcome [25].
We are therefore focusing on immersion as a key factor to better focus and understand CNNs. The degree of immersion can be influenced by numerous factors such as interactive navigation, visualization of realistic features, and spatially engaging environments [26]. However, it is also important that
immersion is a subjective experience that does not necessarily lead to the same effects for everyone. Moreover, is has to be considered that a virtual environment is also able to distract users, resulting in higher cognitive load and poorer learning outcome [27].
B. Gestalt Principles
In addition to experiencing an immersive environment, the ability of users to recognize and correlate data is a cen-tral point. Gestalt principles are relevant for human visual perception and attention, because humans have perceptional limitations when it comes to processing large amount of information [28]. According to these principles, humans tend to perceive their environment as a whole configuration rather than individual fragments. These principles should be con-sidered when creating data visualizations to help information processing and to draw attention to the relevant information. Accordingly, the virtual space should be used efficiently by placing the most important data in the central area of the visual field and placing the details on the sides or on demand. More-over, related information should be visualized consistently and grouped systematically.
Based on these theoretical considerations, we developed and evaluated a first approach for visualizing CNNs in virtual reality as discussed in the following section.
IV. CONVOLUTIONALNEURALNETWORKVISUALIZATION
To achieve the best possible learning outcome, it is im-portant to define the target group. The application should accompany the entry into the functionality of CNNs. However, it should not serve as the only learning medium, but as an additive learning method to make the functionality of CNNs more transparent. Our aim is to achieve enough understanding in a short period of time with as little effort as possible.
A. Virtual Environment
As mentioned above, the main idea behind our visualization approach is based on the assumption that the use of virtual reality offers certain advantages that are not available on a traditional desktop screen with 2D or 3D visualization. The concept tries a reduced graphic approach by exploiting the effects of immersion. Therefore, we designed a room with four walls and a floor for the virtual environment. We deliberately did not decide for an open environment that extends indefinitely in all directions in order to improve spatial orientation and thus counteract the occurrence of motion or simulation sickness.
We used UNITY’s standard Skyboxwith sky and sun as it produces natural ambient light. A ceiling for the virtual room was omitted in order to preserve the natural light through the Skybox and to give the user the feeling of an open space despite the walls that do not restrict.
Overall, we designed the environment very bright, as in a separate test a bright environment was perceived as friendly and inviting. The virtual environment was not equipped with other objects like windows to draw the user’s attention to the
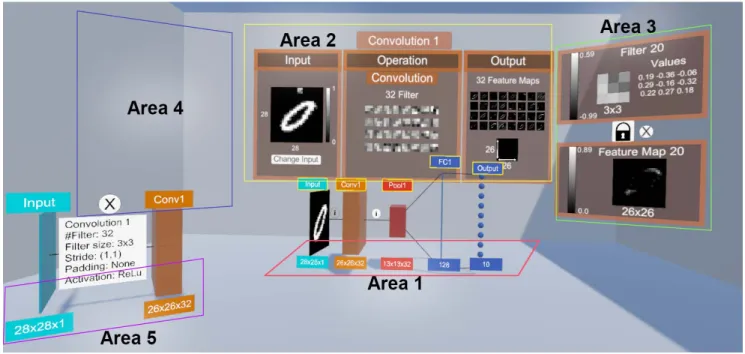
Fig. 2. Five visual areas of the CNN visualization.
visualization. Our visualisation concept concentrates on mak-ing optimum use of the available space by clearly presentmak-ing relevant information in five areas (Figure 2).
The depth in the room offers the possibility to present information on different levels one behind the other. The most important information to understanding CNNs is displayed in the direct field of view of the user, that is the floor in front of the user (Area 1) and the wall behind (Area 2). On the left and right, there are further areas for more detailed information (Areas 3 and 4). In addition we implemented a fifth area on the ground on the left side of the user (Area 5) for settings and additional information.
B. Convolutional Neural Network
The visualization is intended to illustrate the structure and functionality of a CNN. Therefore, the user is able to select different input images and have them classified by CNN. For each different layer of the CNN, the user is able to see the intermediate results for the respective input image and the output of the model. Since the convolutional and pooling layers represent the special feature of a CNN, they are the focus of our visualization.
We developed a 3D-model (Figure 3) that models the structure of the CNN by the individual layers (Figure 4). The representation is based on the 2D representation of LeNet-5 [29]. The individual feature maps of the convolution and pooling layers are combined in boxes for better scalability. Each of these layers is thus displayed as a box whose size dimensions are based on the dimensions of the layer. The dimensions of the convolutional and pooling layers refer to the size of the output that results from the operation on the layer. This representation should enable the user to see at a
Fig. 3. 3D-model of the convolutional neural network.
glance the structure of the model and the dimensional change of the data within the CNN which is a distinct characteristic of CNNs.
Moreover, the 3D-model is the main anchor point of the visualization and therefore placed inArea 1. The model allows the user to display further information on the other respective areas. Area 2 displays the main information for the selected layer, divided in the input, operation and output of the layer. For the convolutional layer it displays a visualization of the filters and the produced feature maps.Area 3andArea 4offer additional information to specific items of Area 2. Area 5
functions as an addition to the 3D-model and provides further details on the parameters chosen for the operations. It also highlights the dimensions of the input and output data of the specific operation.
Fig. 4. Concept for mapping convolutional layers.
V. IMPLEMENTATION
To evaluate the visual concept described in Section IV, we developed a software prototype, which is able to visualize CNNs in VR. It is available under an Open Source license [30].
A. Development Environment
We developed the software prototype based on the UNITY
platform and STEAMVR. The deep learning networks are defined using KERAS [31], which we use as an high-level layer on top of TENSORFLOW[2].
As hardware for development and evaluation, we used the VR headsets HTC VIVEand HTC VIVEPROand a PC with
• Windows 10
• Intel Core i7-4770K CPU/2.50 Ghz, 16 GByte • NVIDIA GeForce RTX 2070 8 GByte
B. Visualization of CNNs
The model that we visualize is defined in KERAS using PYTHON. For testing and evaluation, we use a simple CNN model that is based on an example in the KERAS documenta-tion [31] (Listing 1).
Listing 1. Simplified Python example for a CNN
model = S e q u e n t i a l ( )
model . add ( Conv2D ( 3 2 , k e r n e l s i z e = ( 3 , 3 ) , a c t i v a t i o n = ’ r e l u ’ ,
i n p u t s h a p e = i n p u t s h a p e ) )
model . add ( MaxPooling2D ( p o o l s i z e = ( 2 , 2 ) ) ) model . add ( D r o p o u t ( 0 . 2 5 ) )
model . add ( F l a t t e n ( ) )
model . add ( Dense ( 1 2 8 , a c t i v a t i o n = ’ r e l u ’ ) ) model . add ( D r o p o u t ( 0 . 5 ) )
model . add ( Dense ( n u m c l a s s e s , a c t i v a t i o n = ’ s o f t m a x ’ ) )
Our visualization of filter and feature maps is based on a methodology described by Irvine [32]. Feature maps of each convolutional layer and each pooling layer are rendered as 2D images with MATPLOTLIBusing thegraycolormap (Figure 5). The design and implementation of the whole 3D scene is done with the UNITYeditor (Figure 6). For the prototype, we
Fig. 5. Visualization of filters and feature map for an input image with digit “5.”
created the 3D model (Figure 3) in the editor, which is then connected with application logic using fiveC#scripts (∼1500 lines of code; see [30]).
Fig. 6. Overview of the virtual scene in the Unity editor.
VI. EXPLORATORYSTUDY
We executed an exploratory study to gather insights into how users would use and evaluate our visualization approach. This included satisfaction, perceived learning, and perceived usefulness.
We conducted the study in our VR lab. Session with each participant took 30 minutes on average. Before entering the VR, participants should read an introductory text on CNNs to ensure that everyone is on the same minimum level. While participants were in the virtual environments, they had all time the opportunity to ask questions and share feedback. Afterwards, participants were asked to rate items regarding the usability of the application. The study was completed by open questions and the opportunity to share feedback, concerns or ideas regarding our visualization concept.
A. Results and Discussion
In total, 14 persons (10 female) participated in our study with a mean age of 28.29 (SD = 4.41). All participants reported working in a field of computer science and had, except one, at least a little experience with virtual reality applications. Most of the participants had no or little prior knowledge of CNNs before the evaluation, according to their
own assessment. Even though the group size is too small for a quantitative analysis, the assessed questionnaires and given oral feedback already provide important insights.
Our visualization was very well accepted by all users and described as “helpful for the introduction to the topic of artificial neural networks,” whereby one person justified this by stating that one “can focus precisely on the relevant components in each case.” One participant pointed out as a positive feature of the visualization that the application was “almost completely self-explanatory.” Overall, participants stated they “think they have understood the concept of CNN” and one person suggested that our visualization alone is not enough to achieve a deeper understanding.
The environment was generally reported as being comfort-able, fun, and exciting compared to the traditional desktop visualizations. One participant stated that the motivation to deal with the topic CNN was increased by the use of the innovative VR technology and that the interaction thus became a playful component. Half of the participants said that the use of VR eliminates external distractions that lead to a higher focus on the visualization. Interestingly, 7participants considered the visualization to be implemented as a 2D or 3D desktop application.
Fig. 7. Box plot representing the participants ratings for the dependent vari-ables on a 7-point Likert scale after they have experienced the visualization.
Figure 7 shows the participants ratings on a 7-point Likert scale (1=not at all–7= totally) the following variables:
• Movement: How natural did the controller/head/locomo-tion/ movement feel in the virtual environment? • Orientation: How well did the spatial orientation in the
virtual environment work for you?
• Intuitiveness: How intuitive did your interactions with the virtual environment feel?
• Clearness: How clear/straightforward did you find the visualization?
• Recognition: How well did you recognize/perceive the visualization in the virtual environment?
• Focus: To what extent did you have the impression that you could concentrate more on the data displayed in the
virtual environment than in a normal office environment on a PC/laptop screen?
• VR: In your opinion, to what extent did the use of VR support this visualization?
The results show that overall the interaction with our application and the way of visualizing CNNs is perceived good. Most importantly, people were not overwhelmed by the displayed information, even though they were new into this field. Overall, the participants claimed a good benefit for learning CNNs and said that their knowledge about neuronal networks improved (Figure 8). This does not necessarily prove that the virtual reality learning environment is better than a traditional desktop environment because the learning effect may be due to the amount of time they spend with the topic but this result definitely shows that the virtual reality technology does not distract people from learning. It is quite the opposite in so far that people had the feeling of focusing more on the topic and longer as they would do on a desktop application.
Fig. 8. Learning effect of participants before user session, after reading the introductory text, and after experiencing the VR visualization on a 7-point Likert scale.
VII. CONCLUSION ANDFUTUREWORK
We presented our first approach to visualize CNNs in VR with the aim to give users an introduction to its functionality. We propose that the use of immersive VR allows users to better concentrate on the complex architecture of CNNs. Therefore, we have created and evaluated a first visualization concept in VR considering cognitive psychological principles and an intuitive navigation.
The exploratory study partially supported our assumptions, as it to some extent stimulates learning processes but we do not know whether the users learning outcome and satisfaction is based on the immersive character of the virtual environment or on any other factor. Therefore, it is necessary to compare the learning success of our visualization approach in a VR environment with desktop version. We plan to create an equiv-alent prototype of this visualization for a traditional desktop visualization. A follow up quantitative user study comparing VR with desktop 3D will provide further information.
Moreover, our user study also revealed suggestions on how to improve our visualization. For example, people expected to use the entire virtual room, including the space behind them. We had deliberately refrained from this to have the visualization in the direct field of view but we could imagine allowing users to place the individual objects where they
want. Accordingly, we want to make individual visualization elements movable and scalable, so users can to a certain extent design the structure of the visualization in space according to their own needs and preferences.
REFERENCES
[1] S. Chakraborty, R. Tomsett, R. Raghavendra, D. Harborne, M. Alzantot, F. Cerutti, M. Srivastava, A. Preece, S. Julier, R. M. Rao, T. D. Kelley, D. Braines, M. Sensoy, C. J. Willis, and P. Gurram, “Interpretability of deep learning models: A survey of results,” in2017 IEEE Smart-World, Ubiquitous Intelligence Computing, Advanced Trusted Computed, Scalable Computing Communications, Cloud Big Data Computing, Internet of People and Smart City Innovation (SmartWorld/SCAL-COM/UIC/ATC/CBDCom/IOP/SCI), Aug 2017, pp. 1–6.
[2] M. Abadi, A. Agarwal, P. Barham, E. Brevdo, Z. Chen, C. Citro, G. S. Corrado, A. Davis, J. Dean, M. Devin, S. Ghemawat, I. Goodfellow, A. Harp, G. Irving, M. Isard, Y. Jia, R. Jozefowicz, L. Kaiser, M. Kudlur, J. Levenberg, D. Man´e, R. Monga, S. Moore, D. Murray, C. Olah, M. Schuster, J. Shlens, B. Steiner, I. Sutskever, K. Talwar, P. Tucker, V. Vanhoucke, V. Vasudevan, F. Vi´egas, O. Vinyals, P. Warden, M. Wattenberg, M. Wicke, Y. Yu, and X. Zheng, “TensorFlow: Large-scale machine learning on heterogeneous systems,” 2015, software available from tensorflow.org. [Online]. Available: https://www.tensorflow.org/
[3] J. Yosinski, J. Clune, A. Nguyen, T. Fuchs, and H. Lipson, “Understand-ing neural networks through deep visualization,” inIn ICML Workshop on Deep Learning, 2015.
[4] A. W. Harley, “An interactive node-link visualization of convolutional neural networks,” inAdvances in Visual Computing, G. Bebis, R. Boyle, B. Parvin, D. Koracin, I. Pavlidis, R. Feris, T. McGraw, M. Elendt, R. Kopper, E. Ragan, Z. Ye, and G. Weber, Eds. Cham: Springer International Publishing, 2015, pp. 867–877.
[5] K. Simonyan, A. Vedaldi, and A. Zisserman, “Deep inside convolutional networks: Visualising image classification models and saliency maps,” 2013. [Online]. Available: http://arxiv.org/abs/1312.6034v2
[6] J. T. Springenberg, A. Dosovitskiy, T. Brox, and M. Riedmiller, “Striving for simplicity: The all convolutional net,” 2014. [Online]. Available: http://arxiv.org/abs/1412.6806v3
[7] M. D. Zeiler and R. Fergus, “Visualizing and understanding convolutional networks,” 2013. [Online]. Available: http://arxiv.org/abs/ 1311.2901v3
[8] P.-J. Kindermans, K. T. Sch¨utt, M. Alber, K.-R. M¨uller, D. Erhan, B. Kim, and S. D¨ahne, “Learning how to explain neural networks: Patternnet and patternattribution,” in6th International Conference on Learning Representations, 2018.
[9] B. Zhou, A. Khosla, A. Lapedriza, A. Oliva, and A. Torralba, “Learning deep features for discriminative localization,” 2015. [Online]. Available: http://arxiv.org/abs/1512.04150v1
[10] L. v. d. Maaten and G. Hinton, “Visualizing data using t-SNE,”Journal of machine learning research, vol. 9, no. Nov, pp. 2579–2605, 2008. [11] M. Kahng, P. Y. Andrews, A. Kalro, and D. H. P. Chau, “ACTIVIS:
Visual exploration of industry-scale deep neural network models,”IEEE Transactions on Visualization and Computer Graphics, vol. 24, no. 1, pp. 88–97, Jan 2018.
[12] C. Olah, A. Satyanarayan, I. Johnson, S. Carter, L. Schubert, K. Ye, and A. Mordvintsev, “The building blocks of interpretability,”Distill, 2018, https://distill.pub/2018/building-blocks.
[13] S. Carter, Z. Armstrong, L. Schubert, I. Johnson, and C. Olah, “Activa-tion atlas,”Distill, 2019, https://distill.pub/2019/activation-atlas. [14] B. Zobel, S. Werning, D. Metzger, and O. Thomas,Handbuch Mobile
Learning, ser. The name of the series one. Wiesbaden: Springer, 2018.
[15] A. G. Abulrub, A. N. Attridge, and M. A. Williams, “Virtual reality in engineering education: The future fo creative learning.”2011 IEEE Global Engineering Education Conference (EDUCON), pp. 751–757, 2011.
[16] W. Alhalabi, “Virtual reality systems enhance students achievements in engineering education.” Behaviour & Information Technology, vol. 35, no. 11, pp. 919–925, Jul. 2016. [Online]. Available: https://doi.org/10.1080/0144929X.2016.1212931.
[17] R. Mintz, S. Litvak, and Y. Yair, “3d-virtual reality in science education: An implication for astronomy teaching,” Journal of Computers in Mathematics and Science Teaching, vol. 20, no. 3, pp. 293–305, 2001. [Online]. Available: https://www.learntechlib.org/p/9543
[18] C. Dede, M. C. Salzman, and R. B. Loftin, “Sciencespace: Virtual realities for learning complex and abstract scientific concepts.” in
Proceedings of the IEEE 1996 Virtual Reality Annual International Symposium, 1996, pp. 246–252.
[19] M. Bock and A. Schreiber, “Visualization of neural networks in virtual reality using UNREAL ENGINE,” in Proceedings of the 24th ACM Symposium on Virtual Reality Software and Technology, ser. VRST ’18. New York, NY, USA: ACM, 2018, pp. 132:1–132:2. [Online]. Available: http://doi.acm.org/10.1145/3281505.3281605
[20] A. Schreiber and M. Bock, “Visualization and exploration of deep learning networks in 3d and virtual reality,” inHCI International 2019 -Posters, C. Stephanidis, Ed. Cham: Springer International Publishing, 2019, pp. 206–211.
[21] J. Psotka, “Immersive training systems: Virtual reality and education and training.”Instructional Science, vol. 23, no. 5-6, pp. 405–431, Nov. 1995.
[22] D. Paes, E. Arantes, and J. Irizarry, “Immersive environment for improving the understanding of architectural 3d models: Comparing user spatial perception between immersive and traditional virtual reality systems.”automation in Construction, vol. 84, pp. 292–303, Sep. 2017. [Online]. Available: http://dx.doi.org/10.1016/j.autcon.2017.09.016 [23] B. G. Witmer and M. J. Singer, “Measuring presence in virtual
environ-ments: A presence questionnaire,”Presence, vol. 7, no. 3, pp. 225–240, Jun. 1998.
[24] G. Chu, I. Humer, and C. Eckhardt, “Special relativity in immersive learning.”International Conference on Immersive Learning, pp. 16–29, Jun. 2019.
[25] G. Makransky and L. Lilleholt, “A structural equation modeling investigation of the emotional value of immersive virtual reality in education,” Educational Technology Research and Development, vol. 66, no. 5, pp. 1141–1164, Oct. 2018. [Online]. Available: https://doi.org/10.1007/s11423-018-9581-2
[26] C. Cruz-Neira, D. J. Sandin, T. A. DeFanti, R. V. Kenyon, and J. C. Hart, “The cave: audio visual experience automatic virtual environment.”
Communications of the ACM, vol. 35, no. 6, pp. 64–73, Jun. 1992. [27] G. Makransky, T. S. Terkildsen, and R. E. Mayer, “Adding immersive
virtual reality to a science lab simulation causes more presence but less learning.” Learning and Instruction, 2017. [Online]. Available: https://doi.org/10.1016/j.learninstruc.2017.12.007.
[28] S. Guberman, “On gestalt theory principles.”Gestalt Theory, vol. 27, no. 1, pp. 25–44, Jan. 2015.
[29] Y. LeCun, L. Bottou, Y. Bengio, and P. Haffner, “Gradient-based learning applied to document recognition.”Proceedings of the IEEE, vol. 86, no. 11, pp. 2278–2324, 1998.
[30] N. Meißler, “Dlr-sc/cnn-vis-vr: Prototype version,” 2019. [Online]. Available: https://github.com/DLR-SC/cnn-vis-vr
[31] F. Cholletet al., “Keras,” https://keras.io, 2015.
[32] M. Irvine. (2017) Introduction to convolutional neural networks. [Online]. Available: https://sempwn.github.io/blog/2017/04/06/conv net intro